Influence of phosphorus content on the structure of nickel electroless deposits†
Luisa M. Abrantes*a, Alda Fundoa and Gang Jinb
aICAT, Faculdade de
Ciências da Universidade de Lisboa, Campo Grande, 1749016, Lisboa, Portugal
bInstitute of Mechanics, Chinese
Academy of Sciences, 15 Zhong-Guan-Cun
Rd., Beijing 100080, P.R. China
First published on UnassignedUnassigned6th October 2000
Abstract
Ni–P electroless films prepared from a sulfate-based solution using hypophosphite ion as a reducing agent were optically characterised by ellipsometry. The refractive indices were recorded as a function of the deposition time and the concentration of reductant in the plating bath. To complement the ellipsometric data, X-ray diffraction analysis was performed.
It is shown that ellipsometric measurements can be used to elucidate the change from crystalline to amorphous-like phases induced by the phosphorus content and therefore to correlate the composition with the properties required for Ni–P technological applications.
Introduction
The electroless deposition of metals and alloys can be considered an established industrial practice. Apart from its well-known applications in circuit technology1 and for the production of corrosion and wear-resistant coatings,2,3 this technique has also attracted interest as a preparation method for new electrocatalytic electrode materials.4,5Electroless Ni–P alloy is a typical metal–metalloid binary system and has been extensively investigated. The reported work covers a wide domain from fundamental research towards the characterisation of the electroless deposition process at the molecular level,6,7 to studies devoted to the correlation of the alloy properties with its composition and structural features, with the aim of reaching improved performance conditions.2,8
The amount of phosphorus in electroless Ni–P deposits has an important effect on the behaviour of the alloy. Although the structure of electroless nickel may not be determined solely by the phosphorus content,9 it is clear and generally accepted that Ni–P alloy properties are structure dependent. Many authors have reported that as-deposited Ni–P is crystalline provided the phosphorus is within a composition range of 1–3 wt%, whereas metallic glass behaviour is displayed for a P content higher than 10 wt%.10–12 Intermediate values (4–8 wt% P) have been described as giving semi-amorphous structures11 or amorphous with microcrystallites.12
The effect of solution composition on the structure of Ni–P thin films and the distribution of P from the base metal to the film surface during film thickening are still not established, although they are important factors in controlling the final properties of the films.
Ellipsometry is an optical reflection technique based on the determination of the change in the polarised state of reflected light on a sample surface13 and has proven to be a powerful experimental tool for studies of thin surface layers.14,15 Even though the monitoring of the optical constants of Ni–P coatings is an important source of information about changes in films prepared under different conditions, few studies relying on ellipsometric measurements have been reported.16
In the present study, ex situ conventional ellipsometry has been employed to characterise as-deposited Ni–P coatings on steel. Determination of the optical parameters and their change with the film thickness and with the modification of reductant concentration in the electroless bath reveals the high sensitivity of this technique. The Ni–P optical properties seem to be in agreement with the information obtained by analysing X-ray diffraction measurements on the same samples. The results of this work, although considered preliminary, give evidence of the ability of ellipsometry to elucidate the crystalline state and the homogeneity of crystallite distribution in semi-amorphous Ni–P coatings.
Experimental
Deposits of Ni–P alloy were successfully obtained on 1 mm thick AISI 1010 carbon steel plates. This substrate does not contain nickel, has a very low phosphorus content (0.012%) and represents the conditions under which the Ni–P coating can be of practical importance in preventing corrosion.Steel plates of 30 mm × 10 mm were coarsely polished with emery paper (200) and then electrolytically degreased.17 After rinsing with distilled water and ultrasonic cleaning for 5 min, a mirror finish was generated on one side of each sample by hand polishing with emery paper (1200) and subsequently with successively finer grades of alumina down to 0.3 µm.
The deposition of electroless nickel was carried out from a solution containing nickel sulfate (25 g dm−3), sodium hypophosphite (23 g dm−3) and sodium acetate (12 g dm−3), as described elsewhere.18 Electrolytic “solutions” were made up from P.A. grade chemicals with Millipore water.
The pH of the electroless bath was adjusted to 4.9 with acetic acid and
during the deposition the temperature was kept at 81 ± 1![[thin space (1/6-em)]](https://www.rsc.org/images/entities/char_2009.gif) °C.
°C.
Two series of plating experiments were carried out using fresh solutions for each run and a surface area to volume ratio of 3 cm2 ∶ 0.3 dm3. The thickness of the electroless Ni–P matrix films was controlled by the immersion time. A slight pH decrease (down to 4.8) in bulk solution was observed for the longest immersion time (90 min).
To investigate the role of the reducing agent in determining the amount of deposited phosphorus, similar plating conditions were employed but the concentration of sodium hypophosphite was changed, varying now from 11.5 to 46.0 g dm−3).
The thickness of the coatings was estimated using a Rodenstock profile measuring station (RM 600 2D/3D model).
The phosphorus content in each plated sample was evaluated by chemical analysis.19
The ellipsometric measurements were performed with a SENTECH rotating analyser ellipsometer equipped with an He–Ne laser (632.8 nm) as a probe. The experiments were carried out at an incident angle of 70°. Traditionally, the ellipsometric parameter is defined20 by the ratio ρ = Rp/Rs = tgΨeiΔ, where Rp and Rs are the reflection coefficients of polarised parts, parallel and perpendicular to the incident plane respectively. The tgΨ is the amplitude of the ratio and Δ the difference in the phases of the reflection coefficients. Therefore, the measured characteristic quantities are the angles Ψ and Δ from which the coating optical parameters, n (reflection index) and k (absorption index) or the complex refractive index ñ = ns − iks are evaluated.
Pairs of Ψ and Δ were collected for at least three different regions in each sample. For all cases the measurement deviations were less than 0.020° in both Ψ and Δ.
The structural Ni–P thin film analysis was made by X-ray diffraction, using a Philips PW 1710 diffractometer and Cu-Kα radiation (λ = 1.54056 Å), the diffractograms were recorded for a step scan (step size 0.020°, 0.4 s count time per step) with 20–120° angle range.
For testing corrosion resistance and, eventually, to correlate the behaviour to the structure induced by the phosphorus content, the coated steel plates were exposed to a neutral salt spray atmosphere in accordance with ASTM B117, for 240 h. A metallographic microscope (Zeiss-AXIOVERT 100A) was employed in the periodic inspection (every 24 h) of the samples subjected to the corrosion test.
Results and discussion
The Ni–P samples deposited onto pre-cleaned and polished carbon steel substrates were obtained for different periods of immersion (10–90 min) in the electroless solution, giving films with a thickness in the range 1.5–12.0 µm.The ellipsometric measurements were recorded for the as-deposited films. Since the effective sample depth of absorption (e.g., 31 nm at k = 3.2 and wavelength 632.8 nm) is smaller than the film thickness, the sample can be considered a semi-infinite bulk system and the analysis of the data can be carried out straightforwardly by directly converting Δ and Ψ to the complex refractive index, ñ = ns − iks.
In Fig. 1, the real and imaginary parts of the Ni–P refractive indices are shown, as a function of the deposition time. The order of magnitude of the observed ns and ks values is in good agreement with the reported16 complex optical index of bulk electrolessly deposited Ni–P (ñ = 2.262 − j2.375). However, our ellipsometric observations indicate significant differences in the optical properties of the material as the Ni–P film thickens.
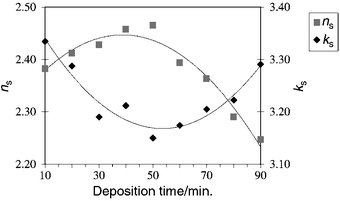 | ||
| Fig. 1 Evolution of the real and imaginary optical indices of Ni–P films as a function of deposition time from a solution containing 23.0 g dm−3 sodium hypophosphite (the curve represents a second order polynomial fit to the data points). | ||
Actually, for deposition times up to about 50 min, the real component of the refractive index increases and the imaginary part decreases. Thereafter, the sense of variation of the two components changes abruptly. Since ks is related to the absorption coefficient α (α = 4πks/λ),21 the highest values of ks (at 10 and 90 min deposition time) should be attributed to the presence of more absorbing and dense materials. The variation of the optical parameters over the deposition time is indicative of structural modifications occurring during the coating process; these are probably due to an increase in the P content with the thickness of the deposit as previously reported22 and also observed in the present samples (4–8 wt% P). The high sensitivity of ellipsometry in detecting structural changes is even more remarkable when the inversion in the sense of variation of ns and ks at about 50 min is noticed. This feature suggests that, thereafter, another stage in the Ni–P growth process takes place.
The structure of as-plated deposits was also analysed by X-ray diffraction and Fig. 2 shows typical diffraction diagrams. Despite the hindrance, due to the large sharp substrate peaks, to definite characterisation of the Ni–P layers, the results clearly reveal a considerable broadness of the diffraction line in the angle range 2θ = 35–55°, which can be interpreted as an overlap between the Ni(111) and Ni(200) diffraction lines. It is also worthwhile to note that the most intense Ni3P diffraction lines [Ni3P(231) and (141)] can appear within the same angle range. Thus, the broadness of the line at the angle corresponding to Ni(111) might be a result of a low ordered structure with microcrystallites. The average size of the crystallites is 25–40 Å, estimated assuming the Scherrer equation23 holds (in this case, D ≈ 0.9λ/βcosθ where β is the half-width of the diffraction line, in radians, and θ the Bragg angle). Similar values have been reported for Ni–P alloy deposits containing about 5 wt% P24 and indicate grain coarsening of the nickel phase (and/or the formation of Ni3P). As the thickness of the film increases, there is a decrease in crystallinity, which is particularly noticeable for deposition times longer than 50 min. Large humps are observed as well as a shoulder in the diffraction line for Ni(222).
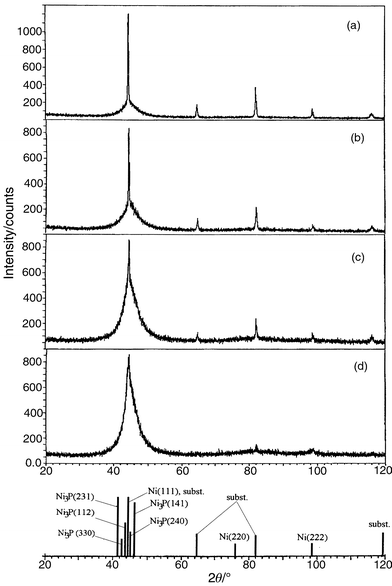 | ||
| Fig. 2 Typical X-ray patterns of electroless Ni–P coatings on carbon steel deposited from a solution containing 23.0 g dm−3 sodium hypophosphite for (a) 10, (b) 40, (c) 60 and (d) 90 min. | ||
A reduction in the hypophosphite ion concentration in the plating solution would lead to a decrease in the percentage of phosphorus in the deposit2,6,7 and therefore films displaying better crystallinity are expected. X-Ray diffraction patterns for Ni–P deposited over 30 min from electrolytes with various hypophosphite concentrations are presented in Fig. 3. Despite the influence of the hypophosphite concentration on the plating rate,22 the main features of the X-ray diffraction profiles are similar to those in Fig. 2. However, it must be pointed out that the films prepared from solutions with lower reductant concentration present a well-defined diffraction line for the preferred orientation of nickel; a solid solution of phosphorus in a polycrystalline nickel system is probably occurring. On the other hand, coatings formed from relatively high hypophosphite ion contents exhibit the same trends as Fig. 2c and d. The microcrystalline size was estimated as described above; as expected,8 it decreases progressively when the P content increases: 40 Å (4 wt% P, Ni–P prepared from 23.0 g dm−3 H2PO2−), 20 Å (7 wt% P, Ni–P obtained from 40.0 g dm−3 H2PO2−).
 | ||
| Fig. 3 Diffractograms of Ni–P films over carbon steel deposited at different concentrations of hypophosphite ion in the plating bath: (a) 11.5, (b) 23.0, (c) 34.5 and (d) 40.3 g dm−3. | ||
It was also seen that further increases in hypophosphite ion concentration, e.g. > 40 g dm−3, do not increase the amount of amorphous phase in the deposits.
Fig. 4 displays the ellipsometric data collected from the same samples. The optical properties of the films change drastically when the amount of reductant added to the plating bath is increased. When compared to the results in Fig. 1, a better defined variation in the real and imaginary components of the reflection indices is observed. This can be attributed to the higher crystallinity of the deposits with lowest P content, in contrast to the amorphous character imparted by the increase in the phosphorus percentage.
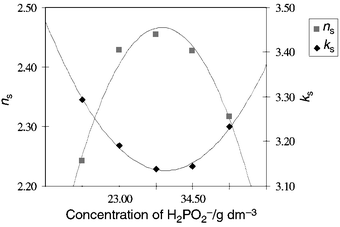 | ||
| Fig. 4 Real and imaginary components of the refractive indices of Ni–P films as a function of reductant concentration in the plating solution; 30 min deposition time. | ||
Large imaginary components are observed for more homogeneous structures, i.e. either Ni–P deposits consisting mainly of fine crystallites (uniform dense grains) or amorphous electroless nickel alloys, even bearing very fine crystallites. For intermediate stages, the values obtained for the optical properties suggest a lattice disorder—the increase in P content is responsible for structures under tension.
When subjected to corrosion tests under a neutral salt spray atmosphere, the sample behaviour corroborates this analysis. Higher resistance to corrosion has been observed25 for coatings prepared from solutions containing 40.3 g dm−3 H2PO2− or deposited over longer times, situations where large ks values were obtained.
Conclusions
The structure of the Ni–P films deposited by electroless plating using hypophosphite ion as reductant changes from crystalline to amorphous as the film thickness and/or the concentration of H2PO2− in the bath increases. Although the period of crystalline growth still deserves more detailed X-ray analysis, the X-ray diffraction data are consistent with the ellipsometric information. At intermediate stages, a rather disturbed crystalline phase prevails, which gives rise to fine crystallites dispersed in a semi-amorphous medium. Finally, a homogeneous amorphous material can be expected.Ellipsometry is revealed as an efficient technique for the characterisation of small variations in the phosphorus distribution and content of electroless Ni–P coatings. The possibility of distinguishing changes in the Ni–P structure is particularly relevant when reproducible properties are required.
Acknowledgements
The authors wish to thank Prof. A. Correia dos Santos (Dep. Química/FCUL) for his helpful suggestions. Alda Fundo wishes to express her gratitude to FCT/programa PRAXIS XXI for a master scholarship. G. Jin also acknowledges ICCTI for the financial support to visit the University of Lisbon.References
- Y. Hanada, K. Fushimi, S. Madokoro, H. Sawai and S. Ushio, J. Electrochem. Soc., 1986, 133, 242.
- M. Mukhtarian, R. Tracy and J. Evarts, Proceedings of Surface Finishing International Technical Conference, American Electroplaters and Surface Finishers Society, Florida, 1996, p. 271. Search PubMed.
- U. Ma and D. T. Gawne, Trans. Inst. Met. Finish., 1985, 63, 64 Search PubMed.
- C. D. Iacovangelo, J. Electrochem. Soc., 1986, 133, 1359 CAS.
- A. P. Ricardo and L. M. Abrantes, in Surface Modification Technologies VIII, ed. T. S. Sudarshan and M. Jeandin, The Institute of Materials, London, 1995, p. 918. Search PubMed.
- M. C. Oliveira, Ph. D. Thesis, University of Lisbon, 1996..
- Y. Zeng and S. Zhou, Electrochem. Commun., 1999, 1, 217 CrossRef CAS.
- H. Zhang, X. J. Zhang and Y. K. Zhang, Plat. Surf. Finish., 1993,(April), 80 Search PubMed.
- K. Sugita and N. Ueno, J. Electrochem. Soc., 1984, 131, 111 CAS.
- R. O. Cortijo and M. Schlesinger, J. Electrochem. Soc., 1983, 130, 2341 CAS.
- N. M. Martyak, S. Wetterer, L. Harrison, M. McNeil, R. Hen and A. A. Neiderer, Plat. Surf. Finish., 1993,(June), 60 Search PubMed.
- P. S. Kumar and P. K. Nair, J. Mater. Sci. Lett., 1994, 13, 671 CrossRef CAS.
- S. Gottesfeld, in Electroanalytical Chemistry: a Series of Advances, ed. A. J. Bard, Marcel Dekker Inc., New York, 1989, p. 143. Search PubMed.
- L. M. Abrantes, A. Boutry, F. Chao, M. Costa and A. P. Ricardo, Port. Electrochim. Acta, 1995, 13, 531 Search PubMed.
- F. Koug, R. Kostecki, F. McLarnon and R. H. Muller, Thin Solid Films, 1998, 313–314, 775.
- E. Dumont, B. Dugnoille, J. P. Petitjean and M. Barigand, Thin Solid Films, 1997, 301, 149 CrossRef CAS.
- ASTM B322-108, Standard Practice for Cleaning Metals Prior to Electroplating..
- H. J. Riesenfeld, Surfaces, 1984, 164, 47 Search PubMed.
- P. Stapleton, in Electroless Plating—Fundamentals and Applications, ed. G. O. Mallory and J. B. Hajdu, American Electroplaters and Surface Finishers Society, Florida, 1990, p. 169. Search PubMed.
- R. M. A. Azzam and N. M. Bashara, Ellipsometry and Polarised Light, 3rd edn., North Holland Publishing Co., Amsterdam, 1996, p. 270. Search PubMed.
- A. Hamnett, J. Chem. Soc., Faraday Trans., 1993, 89, 1593 RSC.
- A. J. Gould, P. J. Boden and S. J. Harris, Surf. Technol., 1981, 12, 93 Search PubMed.
- R. W. James, in The Optical Principles of the Diffraction of X-Rays, ed. L. Bragg, Cornell University Press, New York, 1967. Search PubMed.
- M. Matsuoka, S. Imanishi and T. Hayashi, Plat. Surf. Finish., 1989,(November), 54 Search PubMed.
- L. M. Abrantes, A. Fundo and A. S. Henriques, Corros. Prot. Mater., submitted. Search PubMed.
Footnote |
| † Basis of a presentation given at Materials Discussion No. 3, 26–29 September, 2000, University of Cambridge, UK. |
| This journal is © The Royal Society of Chemistry 2001 |