Ab initio calculation of phase diagrams of ceramics and minerals†
Neil L. Allana, Gustavo D. Barrerab, Mikhail Yu. Lavrentiev‡a, Ilian T. Todorova and John A. Purtonc
aSchool of Chemistry, University
of Bristol, Cantock’s Close, Bristol, UK BS8 1TS. E-mail: n.l.allan@bris.ac.uk
bDepartamento de Química, Universidad Nacional de la Patagonia SJB, Ciudad
Universitaria, 9000, Comodoro Rivadavia, Argentina
cCLRC, Daresbury Laboratory, Warrington, Cheshire, UK WA4 4AD
First published on UnassignedUnassigned5th October 2000
Abstract
A range of methods, based on Monte Carlo and lattice dynamics simulations, are presented for the calculation of the thermodynamic properties of solid solutions and phase diagrams. These include Monte Carlo simulations with the explicit interchange of cations, the use of the semigrand-canonical ensemble and configurational bias techniques, hybrid Monte Carlo/molecular dynamics, and a new configurational lattice dynamics technique. It is crucial to take account of relaxation of the local atomic environment and vibrational effects. Examples studied are (i) the enthalpy and entropy of mixing, the phase diagram and the spinodal of MnO/MgO. The available experimental data disagree widely for this system; (ii) the enthalpy of mixing of CaO/MgO, where the size mismatch between the cations is considerably larger than in (i); (iii) the postulated high-pressure orthorhombic to cubic phase transition in (Mg,Mn)SiO3 perovskite, where we show that impurity cations can have a much larger effect than that expected from a mean-field treatment or linear interpolation between end-member compounds.
Introduction
Grossly disordered materials and solid solutions present considerable challenges to the theoretician. Ceramic solid solutions in particular are often strongly non-ideal. Cation ordering, for example, is often crucial in determining phase stability and in determining thermodynamic and chemical properties; understanding ordering and non-ideality is fundamental also to the interpretation of any processes involving partitioning between phases. Approaches such as the Cluster Variation Method (CVM),1 widely used for metallic alloys, often perform poorly where the species involved are markedly dissimilar, as is usually the case in ceramics and minerals. In addition, despite the importance of accurate thermodynamic data for oxide solid solutions in such areas as ceramic fabrication and design, and mineralogy, such information is rare.Disorder in ionic materials has largely been investigated theoretically via point defect calculations2 (the dilute limit), or via ‘supercells’,3 in which a superlattice of defects is introduced, extending throughout the macroscopic crystal. The periodicity is then of the particular superlattice chosen and convergence towards properties of an isolated defect occurs as the superlattice spacing is increased. These methods are not readily extended to solid solutions or disordered systems with a finite impurity or defect content far from the dilute limit.
We are currently developing a series of new codes and methods to address such problems. A key feature of all of these is the need to sample many different arrangements of ions, allowing for the exchange of ions located at crystallographically inequivalent positions. Any methods must also take into account the local environment of each ion and the local structural movements (relaxation), which accompany any exchange of ions and reduce considerably the energy associated with any such interchange. Local effects due to ion association or clustering should not be averaged out. Methods should be readily extendible to incorporate the effects of high-pressure or thermal (vibrational) effects. The use of parameterised Hamiltonians (e.g., of Ising type) is increasingly difficult beyond binary or pseudobinary alloys; we do not resort to any such approximate scheme. In this paper we concentrate chiefly on Monte Carlo methods; for the purposes of comparison, some results obtained using our new configurationally averaged lattice dynamics approach4 are also presented. We pay particular attention here to the calculation of free energies and phase diagrams, extending earlier work on enthalpies.5
Our methods are illustrated using three examples. The first is the system MnO/MgO, for which there are not only several sets of experimental enthalpy data,6,7 but also two conflicting reports of the phase diagram. As discussed by de Villiers et al.,8 the experimental data of Raghavan et al.9 suggest the formation of a complete solid solution at all compositions at temperatures as low as 600 K, whereas the results of Wood et al.10 are consistent with a much larger consolute temperature of almost 1100 K, and a markedly asymmetric phase diagram. The data of ref. 9 are indeed somewhat surprising in view of the phase diagram of CaO/MgO (our second example), in which there is a large two-phase region, and the mismatch in ionic radii11 between Mn2+ (0.83 Å) and Mg2+ (0.72 Å), which is still substantial although smaller than that between Ca2+ (1.00 Å) and Mg2+ (0.72 Å). Our third example is the high-pressure orthorhombic to cubic phase transition in (Mg,Mn)SiO3 perovskite, where the influence of a high impurity concentration on the transition is examined.
Theoretical methods
The basis for most of the approaches we discuss in this paper is the well-known Monte Carlo method, but modified as described below. All calculations are based on an ionic model using two-body potentials to represent short-range forces.The first approach is a Monte Carlo simulation (MC) in which there are no interchanges. Vibrational effects are taken into account by allowing random moves of randomly selected atoms. The MC calculations are carried out within the NPT ensemble, i.e., both the atomic coordinates and cell dimensions are allowed to vary during the simulation. During one step of the MC simulation, an atomic coordinate or a lattice parameter is chosen at random and altered by a random amount. To determine whether the change is accepted or rejected, the usual Metropolis algorithm12 is applied. The maximum changes in the atomic displacements and the volume are governed by the variables rmax and vmax respectively. The magnitudes of these parameters are adjusted automatically during the equilibration part of the simulation to maintain an acceptance/rejection ratio of approximately 0.3.
In the second approach, Monte Carlo Exchange (MCX), both the atomic configuration and the atomic coordinates of all the atoms are changed. In any step, a random choice is made whether to attempt a random exchange between two atoms, a random displacement of an ion, or a random change in the volume of the simulation box. Again, the Metropolis algorithm is used to accept or reject any move.
In our final technique, hybrid Monte Carlo (HMC),5 local structural relaxation is achieved by means of a short molecular dynamics (MD) run, thus combining Monte Carlo and molecular dynamics steps in the same simulation. Related techniques have been widely used in the modelling of polymers and biomolecules.13 Like MCX, the HMC technique allows the efficient sampling of a large number of different configurations. During one HMC cycle, one of three options is chosen at random, with equal probabilities. The first is a short NVE molecular dynamics simulation (15 steps, timestep 1.5 fs) in which the last configuration is accepted or rejected by comparing its energy with the energy of the starting configuration and using the Metropolis algorithm. If the last configuration is not accepted, the original configuration is included in the statistical averaging of thermodynamic properties. In the second option, which is only applicable in the case of a solid solution, a short MD run follows a random exchange of ions. Again, the difference in energy between the previous configuration and that immediately after the MD simulation is used in the Metropolis algorithm. At the start of each MD run, velocities are assigned at random from a Maxwellian distribution. The third option is a random change of the volume/shape of the box, again accepted or rejected using the Metropolis algorithm.
Our configurational lattice dynamics approach is somewhat different, building on our recent work on the full structural optimisation of periodic systems with large unit cells,14,15 using a combination of lattice statics and quasiharmonic lattice dynamics (QLD). The calculation of the free energy to high precision via QLD, which for ionic solids is usually valid up to about one-half to two-thirds of the melting point, is quick and computationally efficient14 and does not resort to lengthy thermodynamic integration. An appropriate thermodynamic average over a (limited) set of calculations is evaluated for different configurations of cations within a supercell. Given the free energy, Gk, for the relaxed structure of each possible cation arrangement k we then average:
 | (1) |
 | (2) |
Results and discussion
MgO/MnO
All Monte Carlo simulations reported here for MgO/MnO use a box size of 512 ions and 4 × 10⁷ steps, following initial equilibration of 1 × 10⁷ steps. The interionic potentials were taken from ref. 16.In the MC calculations, each step comprises either an attempted atom movement or a change of size of the simulation box. The MC calculations thus almost always sample only one cation arrangement, the initial configuration, which is chosen at random. Consequently, the calculated variation of ΔHmix varies erratically with composition, and there is strong variation with the choice of the initial arrangement. For a composition with a MgO∶MnO ratio of 1∶1, in a series of tests ΔHmix varied by as much as ca. 1.1 kJ mol−1, depending on initial cation arrangement. This variation is ca. 20% of the final value for ΔHmix obtained below. If the size mismatch between the ions is larger, as with CaO/MgO, this erratic variation is even more marked.
In MCX simulations, any step may attempt the movement of an atom, a change in size of the simulation box or an explicit exchange of an Mg and Mn ion, each chosen at random. About 25% of attempted exchanges are successful. The resulting values of ΔHmix at 1000 K, which, unlike the MC results, do not vary with initial configuration, are shown in Fig. 1. Also shown in this figure are results from configurationally averaged quasiharmonic lattice dynamics (QLD) using a unit cell of 128 atoms and 250 randomly chosen configurations. The excellent agreement between the two very different techniques, MCX and QLD, is striking, and lends support to our approach.
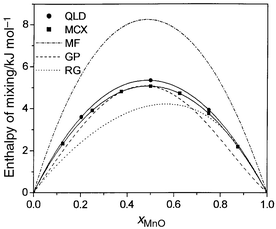 | ||
| Fig. 1 Calculated values of ΔHmix (kJ mol−1) at 1000 K for MnO/MgO using exchange Monte Carlo (MCX). For comparison purposes, values obtained using configurational quasiharmonic lattice dynamics (QLD), and the mean-field theory (MF) described in the text, are also given. Two sets of experimental data (RG from ref. 6, GP from ref. 7) are shown. | ||
The calculated enthalpy of mixing is symmetric with a maximum at ca. 5 kJ mol−1 (50% MgO, 50% MnO). Agreement with the data of Gripenberg et al.7 is good, but the results show none of the asymmetry reported by Raghavan;6 no constraints as to this symmetry have, of course, been imposed in the calculations. We find ΔHmix does not change significantly with temperature, supporting the common assumption that ΔHmix is largely temperature independent.
For comparison, values calculated using a “mean-field” (MF) approach are also plotted in Fig. 1. Instead of separate, distinct Mn2+ and Mg2+ ions, a “hybrid” ion is introduced, for which the non-Coulombic potentials are a linear combination of the potentials for Mn2+ and Mg2+, weighted by the site occupancies appropriate to the particular overall composition considered. If the local atomic environment of the ions, or clustering is important, then these mean-field results will be poor, since these effects are averaged out by the “hybrid” ion. Fig. 1 shows that this is indeed the case. The effects of the relaxation of the local atomic environments of each cation can be seen by repeating the calculation without such atomic relaxation. In the absence of relaxation of the basis atoms in the supercell, the enthalpy of mixing at 1000 K for a 50/50 composition is ca. 9 kJ mol−1, again far in excess of our value of 5 kJ mol−1.
Calculation of the free energy is less straightforward. Absolute magnitudes of this quantity cannot be obtained readily from Monte Carlo calculations. However, the calculation of the phase diagram of MgO/MnO requires free energy differences rather than absolute values, and here we have resorted to novel Monte Carlo techniques used for liquids, but, surprisingly, to our knowledge unexplored for oxides and minerals. We use semigrand-canonical ensemble simulations17,18 to calculate the difference in chemical potential of Mg and Mn ions. In this method one species, B, is converted into another, A, and the resulting potential energy change ΔUB/A determined. This is related to the change in chemical potential ΔμB/A by:
 | (3) |
The calculated variation of ΔμMg/Mn with composition is shown at three temperatures (800, 1100 and 1600 K) in Fig. 2. It is clear from the shapes of these curves that 800 K (Fig. 2a) corresponds to a temperature below the consolute temperature, with the formation of one- and two-phase regions at different compositions. 1100 K (Fig. 2b) is just below the consolute temperature, while 1600 K (Fig. 2c) is above this temperature, indicating complete miscibility and the formation of a single phase at all compositions.
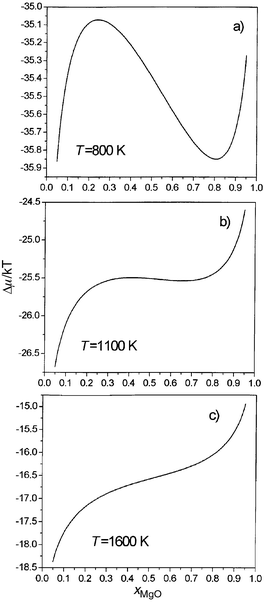 | ||
| Fig. 2 Calculated variation of ΔμMg/Mn/kBT (=μMn – μMg) vs. composition at (a) 800 K, (b) 1100 K, (c) 1600 K for MnO/MgO. | ||
A common model for solid solutions of oxides and minerals assumes a subregular solution and the Margules approximation,19 in which the excess (non-ideal) free energy is written as a third degree polynomial in the concentration:
 | (4) |
 | (5) |
By integration of eqn. (5) with respect to composition, we then obtain the variation of free energy with composition at each temperature. These curves are shown in Fig. 3. From these values a straightforward common tangent construction yields the phase diagram given in Fig. 4. A further advantage of using the semigrand-canonical ensemble is that it is also straightforward to extract the spinodal, which defines the region where a single phase is kinetically as well as thermodynamically unstable with respect to the formation of two separate phases, from the positions of the maxima and minima in the ΔμMg/Mn plots in Fig. 2. Calculated phase diagrams and spinodals are given in Fig. 4, together with those extracted by de Villiers et al.8 from the experimental data of ref. 10.
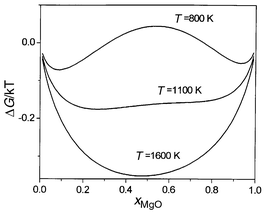 | ||
| Fig. 3 Calculated variation of ΔGmix/kBTvs. composition at 800, 1100 and 1600 K for MnO/MgO. | ||
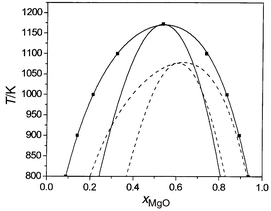 | ||
| Fig. 4 Calculated (solid lines) and experimental (dashed lines) phase diagrams, and spinodals for MnO/MgO. | ||
It is clear that our results provide substantial support for the experimental findings of Wood et al.,10 ruling out the formation of a complete solid solution at temperatures as low as 600 K, as suggested by the data of Raghavan.9 Although our calculated ΔHmixvs. composition curve is symmetric, our calculated phase diagram (Fig. 4) possesses a marked asymmetry, with MnO less soluble in MgO than MgO in MnO. The same type of asymmetry is also observed in the CaO/MgO system, with the smaller cation more soluble in CaO than is the larger cation in MgO. The phase diagram obtained from the measurements of Wood et al.10 is somewhat more asymmetric than that calculated. In this context, it is again worth noting the conclusions of de Villiers et al.,8 who emphasise the large experimental errors and suggest the asymmetry should be smaller.
Entropies of mixing are readily extracted from configurationally averaged lattice dynamics and from MCX calculations of ΔGmix and ΔHmix. Values of ΔSmix at 1000 K are plotted in Fig. 5 together with the ‘ideal’ entropy of mixing. Both calculations give results close to each other and to the ‘ideal’ entropy. It is important to note that the calculated ΔSmix includes both configurational and vibrational contributions, making no assumptions concerning the ideality or otherwise of the solid solution. Calculated point defect entropies of mixing for a Mn2+ substitutional defect in MgO show that in this region the vibrational contribution is positive, being dominated by the heavier mass of the impurity ion which tends to decrease frequencies.
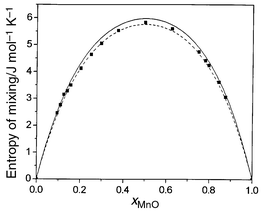 | ||
| Fig. 5 Calculated values of ΔSmix (J K−1 mol−1) at 1000 K for MnO/MgO. Shown are results of exchange Monte Carlo (solid line) and QLD (squares) calculations. For comparison the ideal entropy of mixing is also shown (dashed line). | ||
CaO/MgO
Our second example is the system CaO/MgO, which is characterized by a larger mismatch between the cation radii. Consequently, the rate of successful exchanges in MCX calculations carried out as for MnO/MgO is substantially smaller and only ca. 3%. Long runs are thus necessary in order to obtain a good sampling of configurations and these are far too computationally expensive. In order to accelerate the movement of the system in configuration space, we have applied a configurational-bias scheme.18 Such an approach is widely used in polymer modelling. The details of the implementation of this bias scheme to MCX simulations will be described in detail elsewhere.20 Here, we note that instead of choosing at random a pair of ions to exchange, exchange probabilities are calculated for a number of pairs (100).One exchange is then selected with a probability proportional to the corresponding Boltzmann factor. Special care is required in order to satisfy the condition of detailed balance.We use the same set of potentials for CaO/MgO as Ceder and co-workers.21 Our configurational-bias Monte Carlo results for the enthalpy of mixing show striking differences from those reported in ref. 21 using the same set of interionic potentials. Fig. 6 shows the calculated enthalpy of mixing as a function of composition at T = 2000 K. This curve, unlike that for MgO/MnO, is asymmetric, with a maximum of ca. 25.3 kJ mol−1 for a mol fraction of CaO just under 0.5. These enthalpies are substantially lower than those obtained by Ceder and co-workers,21 who, for example, predict enthalpies as high as ca. 49 kJ mol−1 for a mixture comprising 50% CaO/50% MgO. We have previously evaluated22 enthalpies of mixing for small CaO concentrations using hybrid Monte Carlo, which are close to those obtained here using configurational bias Monte Carlo. Although ΔHmix for CaO/MgO is large and positive, configurational lattice dynamics calculations23 show this is offset in the single-phase regions by large, positive values of ΔSmix, which are in excess of the ‘ideal’ value.
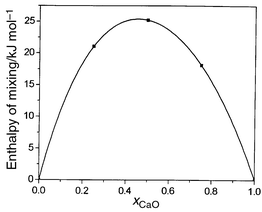 | ||
| Fig. 6 Calculated values of ΔHmix (kJ mol−1) at 2000 K for CaO/MgO using configurational bias exchange Monte Carlo. | ||
A major advantage of our MCX approach over lattice dynamics is that it is also applicable to the liquid phase. This work is currently in progress and preliminary results indicate that all the characteristic features of the MgO/CaO phase diagram, including the eutectic point and the regions of liquid–solid coexistence, are reproduced.
Hybrid Monte Carlo—MgSiO3/MnSiO3
We now turn to an example of our hybrid Monte Carlo technique, in which local structural relaxation is achieved by means of short molecular dynamics runs. A valuable feature of HMC is that it can be readily used to examine the influence of high impurity or defect concentrations on phase transitions. Alternative methods, such as the use of an Ising-type Hamiltonian, can not only average out local effects such as ion association but also are not readily extended to include the effects of lattice vibrations and high pressure. Since Mn–Mg mixing in silicates is expected to be non-ideal,10 we have chosen to examine (Mg,Mn)SiO3 perovskite.24We used the same set of interionic potentials for MgSiO3 as
for Mg2SiO4 in ref. 5.
The HMC runs are for a simulation cell of 540 ions (3 × 3 × 3
unit cells), with an equilibration period of 50![[thin space (1/6-em)]](https://www.rsc.org/images/entities/char_2009.gif) 000 steps and
averaging enthalpy and structural data over a further 50
000 steps and
averaging enthalpy and structural data over a further 50![[thin space (1/6-em)]](https://www.rsc.org/images/entities/char_2009.gif) 000 steps.
Matsui and Price25 have used constant-pressure
molecular dynamics to show that above 10 GPa, orthorhombic MgSiO3
undergoes a temperature induced phase transition to a cubic phase prior to
melting, whereas at lower pressures the orthorhombic phase melts without any
change of solid phase. For MgSiO3 itself, HMC results are very
similar. The calculated transition temperature from the orthorhombic to the
cubic phase is 3900 K at 20 GPa. Fig. 7
shows the variation of the lattice parameters of Mg0.6Mn0.4SiO3
with temperature, which shows this compound also undergoes such a phase transition
at this temperature. The transition temperature (2500 ± 50 K)
is lower than for MgSiO3, in keeping with simple radius ratio
arguments. The calculated transition temperature at 20 GPa as a function
of Mn composition is displayed in Fig. 8,
and it is evident that a linear interpolation between the end members is a
very poor approximation. The orthorhombic–cubic phase transition for
Mg0.6Mn0.4SiO3 is 500 K lower than
the value of ca. 3000 K predicted by such an interpolation.
In passing, it is worth noting that, unlike the transition temperature, the
calculated volume as a function of Mn composition shows only a small positive
deviation from Vegard’s Law, since the a lattice parameter
has a positive deviation and the other two negative deviations. We have not
been able to find experimental data for comparison; data are particularly
sparse where a combination of high temperatures and high pressures is required.
If the analogous compound (Mg,Fe)SiO3 were to exhibit
such a phase transition,26 there would be
important implications for the thermodynamic and compositional modelling of
the Earth’s mantle.
000 steps.
Matsui and Price25 have used constant-pressure
molecular dynamics to show that above 10 GPa, orthorhombic MgSiO3
undergoes a temperature induced phase transition to a cubic phase prior to
melting, whereas at lower pressures the orthorhombic phase melts without any
change of solid phase. For MgSiO3 itself, HMC results are very
similar. The calculated transition temperature from the orthorhombic to the
cubic phase is 3900 K at 20 GPa. Fig. 7
shows the variation of the lattice parameters of Mg0.6Mn0.4SiO3
with temperature, which shows this compound also undergoes such a phase transition
at this temperature. The transition temperature (2500 ± 50 K)
is lower than for MgSiO3, in keeping with simple radius ratio
arguments. The calculated transition temperature at 20 GPa as a function
of Mn composition is displayed in Fig. 8,
and it is evident that a linear interpolation between the end members is a
very poor approximation. The orthorhombic–cubic phase transition for
Mg0.6Mn0.4SiO3 is 500 K lower than
the value of ca. 3000 K predicted by such an interpolation.
In passing, it is worth noting that, unlike the transition temperature, the
calculated volume as a function of Mn composition shows only a small positive
deviation from Vegard’s Law, since the a lattice parameter
has a positive deviation and the other two negative deviations. We have not
been able to find experimental data for comparison; data are particularly
sparse where a combination of high temperatures and high pressures is required.
If the analogous compound (Mg,Fe)SiO3 were to exhibit
such a phase transition,26 there would be
important implications for the thermodynamic and compositional modelling of
the Earth’s mantle.
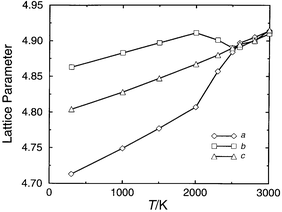 | ||
| Fig. 7 Lattice parameters (Å) vs.T (K) at 20 GPa for Mg0.6Mn0.4SiO3 | ||
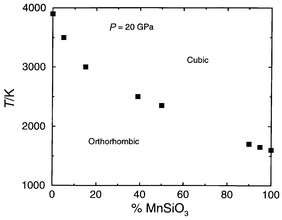 | ||
| Fig. 8 Calculated orthorhombic–cubic transition temperature (K) at 20 GPa vs. Mn content. | ||
The HMC technique includes vibrational effects. In the static limit there is no transition between orthorhombic and cubic phases. The importance of allowing for vibrational effects more generally has also been emphasised by Barrera et al.27 in a study of order–disorder transitions in CuAu alloys. For CuAu, calculations were carried out using MCX and, for comparison, a further set in which vibrational contributions were neglected by fixing the atoms at their crystallographic (fractional) positions, although the simulation cell was allowed to change shape in order to keep the pressure constant. The order–disorder transition temperature from this second Ising-type model was larger by 300 K than that predicted by MCX, indicating the importance of vibrational contributions and relaxation effects. It is also worth noting that no transition was observed without explicit exchange of Cu and Au atoms.
Final remarks
In this paper we have presented a range of methods for the simulation of solids with a large impurity or defect content, for solid solutions and for the calculation of phase diagrams. No empirical data are required. All the methods sample many configurations, explicitly considering different arrangements of ions, and allow for the local structural relaxation surrounding each cation. This relaxation is crucial. If ignored, the energy of exchange of any two ions is usually very high and all exchanges are rejected, thus sampling only one arrangement. All the methods include vibrational effects and are applicable over ranges of pressure and temperature.Each method has its own strengths and advantages: Monte Carlo techniques are applicable to the solid at high temperatures and liquids. The semigrand canonical ensemble will be particularly useful in future work for the calculation of spinodals and thus provides a route to kinetic effects. Configurational lattice dynamics provides a convenient route to entropies of mixing and for studies at lower temperatures where quantum effects are important. Further work is currently in progress to develop all of the methods and apply them to more complex systems.
Acknowledgements
This work was funded by EPSRC grants GR/M34799, GR/M53899 and ANPCyT grant BID 802/OC-AR-PICT0361. G. D. B. acknowledges support from el Consejo Nacional de Investigaciones Científicas y Técnicas de la República Argentina, and his contribution to this work has been possible due to a grant from the Fundación Antorchas. I. T. T. is grateful to EPSRC and the ORS scheme for financial support.References
- D. de Fontaine, Solid State Phys., 1994, 47, 33 Search PubMed.
- E.g., (a) C. R. A. Catlow and W. C. Mackrodt, Computer Simulation of Solids, 1982, ed. C. R. A. Catlow and W. C. Mackrodt, Springer-Verlag, Berlin, 1982, ch. 1. Search PubMed.
- E.g., (a) M. B. Taylor, G. D. Barrera, N. L. Allan, T. H. K. Barron and W. C. Mackrodt, Faraday Discuss., 1997, 106, 377 RSC.
- E.g., (a) J. A. Purton, J. D. Blundy, M. B. Taylor, G. D. Barrera and N. L. Allan, Chem. Commun., 1998, 627 RSC.
- J. A. Purton, G. D. Barrera, N. L. Allan and J. D. Blundy, J. Phys. Chem. B, 1998, 102, 5202 CrossRef CAS.
- S. Raghavan, Ph.D. Thesis, Indian Institute of Science, Bangalore, 1971..
- H. Gripenberg, S. Seetharaman and L. I. Staffansson, Chem. Scr., 1978–79, 13, 162 Search PubMed.
- J. P. R.de Villiers, P. R. Buseck and H. S. Steyn, Mineral. Mag., 1998, 62, 333 Search PubMed.
- S. Raghavan, G. N. K. Iyengar and K. P. Abraham, J. Chem. Thermodyn., 1985, 17, 585 CrossRef CAS.
- B. J. Wood, R. T. Hackler and D. P. Dobson, Contrib. Mineral. Petrol., 1994, 115, 438 CrossRef CAS.
- All ionic radii are for six-fold coordination and taken from: R. D. Shannon, Acta Crystallogr., Sect. A, 1976, 32, 751. Search PubMed.
- N. I. Metropolis, A. W. Rosenbluth, M. N. Rosenbluth, A. H. Teller and E. Teller, J. Chem. Phys., 1953, 21, 1087 CrossRef CAS.
- For example, (a) M. E. Clamp, P. G. Baker, C. J. Stirling and A. Brass, J. Comput. Chem., 1994, 15, 838 CrossRef CAS.
- M. B. Taylor, G. D. Barrera, N. L. Allan, T. H. K. Barron and W. C. Mackrodt, Comput. Phys. Commun., 1998, 109, 135 CrossRef CAS.
- M. B. Taylor, G. D. Barrera, N. L. Allan and T. H. K. Barron, Phys. Rev. B, 1997, 56, 14380 CrossRef CAS.
- G. V. Lewis and C. R. A. Catlow, J. Phys. C: Solid State Phys., 1985, 18, 1149 Search PubMed.
- D. A. Kofke and E. D. Glandt, Mol. Phys., 1988, 64, 1105 CAS.
- D. Frenkel and B. Smit, Understanding Molecular Simulation, Academic Press, San Diego–London, 1996. Search PubMed.
- E.g., (a) J. B. Thompson, in Researches in Geochemistry, ed. P. H. Abelson, John Wiley, New York, 1967, vol. II, p. 340. Search PubMed.
- M. Lavrentiev, N. L. Allan, G. D. Barrera and J. A. Purton, unpublished results..
- (a) P. D. Tepesh, A. F. Kohan, G. D. Garbulsky, G. Ceder, C. Coley, H. T. Stokes, L. L. Boyer, M. J. Mehl, B. P. Burton, K. Cho and J. Joannopoulos, J. Am. Ceram. Soc., 1996, 79, 2033 Search PubMed; (b) A. F. Kohan and G. Ceder, Phys. Rev. B, 1996, 54, 805 CrossRef CAS.
- R. M. Fracchia, J. A. Purton, N. L. Allan, T. H. K. Barron, G. D. Barrera and J. D. Blundy, Radiat. Eff. Defects Solids, 1999, 151, 197 Search PubMed.
- N. L. Allan, G. D. Barrera, J. A. Purton, C. E. Sims and M. B. Taylor, Phys. Chem. Chem. Phys, 2000, 2, 1099 RSC.
- J. A. Purton, N. L. Allan and J. D. Blundy, Chem. Commun., 1999, 707 RSC.
- M. Matsui and G. D. Price, Nature, 1991, 351, 735 CrossRef CAS.
- The experimental evidence is contradictory; e.g., (a) E. Knittle and R. Jeanloz, Science, 1987, 235, 668 CAS; (b) C. Meade, H. K. Mao and J. Hu, Science, 1995, 268, 1743 CAS.
- G. D. Barrera, R. H. de Tendler and E. P. Isoardi, Model. Simul. Mater. Sci. Eng., 2000, 8, 389 CrossRef CAS.
Footnotes |
| † Basis of a presentation given at Materials Discussion No. 3, 26–29 September 2000, University of Cambridge, UK. |
| ‡ On leave from Institute of Inorganic Chemistry, 630090 Novosibirsk, Russia. |
| This journal is © The Royal Society of Chemistry 2001 |
