Structural information from ion mobility measurements: applications to semiconductor clusters
Alexandre A. Shvartsburg†a, Robert R. Hudgins‡a, Philippe Dugourdb and Martin F. Jarrold*a
aDepartment of Chemistry, Northwestern University, 2145 Sheridan Road, Evanston, IL 60208, USA.. E-mail: mfj@northwestern.edu
bLaboratorie de Spectrométrie Ionique et
Moléculaire, UMR No. 5579, CNRS et Université Lyon 1, 43 bd du 11 novembre 1918, 69622, Villeurbanne Cedex, FranceFirst published as an Advance Article on the web
First published on 21st December 2000
Abstract
Ion mobility measurements are one of the few methods presently available that can directly probe the structures of relatively large molecules in the gas phase. Here we review the application of ion mobility methods to the elucidation of the structures of semiconductor clusters (Sin, Gen, and Snn). We describe the new high-resolution implementation of the technique and the advanced methods of mobility calculations that are crucial for the correct analysis of the experimental data.
 Alexandre A. Shvartsburg Alexandre A. Shvartsburg | Alexandre A. Shvartsburg was born in Moscow, Russia. He received an MS from the University of Nevada, Reno in 1995 and a PhD from Northwestern University in 1999. He is currently a Postdoctoral Fellow at York University in Canada. |
 Robert R. Hudgins Robert R. Hudgins | Robert R. Hudgins was born in New Jersey, USA and obtained his undergraduate education from the College of William and Mary in Williamsburg, Virginia. He received his PhD from Northwestern University in 1999, where he worked on the development and applications of high resolution ion mobility measurements. He currently holds an NSF International Post- doctoral Fellowship at the University of Basel in Switzerland. |
 Philippe Dugourd Philippe Dugourd | Philippe Dugourd was born in Angers, France. He obtained his undergraduate degree from the Ecole Normale Superieure in Paris, and received his PhD from the University of Lyon. In 1991 he joined the French National Center for Scientific Research (C.N.R.S.) and since then he has held a permanent research appointment at the University of Lyon. In 1995 he spent a year as a visiting scholar in the Chemistry Department at Northwestern University. |
 Martin F. Jarrold Martin F. Jarrold | Martin F. Jarrold was born in Haslemere, Surrey. He obtained his undergraduate and graduate degrees from the University of Warwick, and then went to the University of California, Santa Barbara as a NATO Postdoctoral Fellow. In 1985 he joined the Physics Research Division of AT&T Bell Laboratories. Since 1992 he has been a Professor in the Chemistry Department at Northwestern University. |
1 Introduction
It is difficult to understand anything without information about its structure. While this statement is probably true in all areas of science, it is particularly valid in the chemical sciences where understanding of a molecular system almost always hinges on elucidation of its structure. In the gas phase, high resolution spectroscopy has provided remarkably detailed structural information for small molecules. However, current interest is focused more on much larger and more complex systems, for example, atomic clusters and anhydrous biomolecules. The traditional spectroscopic methods often fail for these complex systems. And the other structural tools available to chemists, such as NMR and X-ray diffraction, cannot be used because the sample densities are too low. In this article, we describe the development of high-resolution ion mobility methods as a structural tool and the application of this approach to the characterization of gas phase atomic clusters,1 specifically semiconductor clusters. Our interest in the structures of these species stems from a desire to understand how the geometries of small particles containing tens of atoms evolve into the bulk crystal structure. The methods outlined here have also been applied to relatively large biomolecules, such as peptides and proteins, but we do not describe that work here.22 Ion mobility measurements
The mobility of an ion is a measure of how rapidly it moves through a buffer gas under the influence of an electric field.3 In the low field limit (see below) the mobility of a cation or anion depends on its orientationally-averaged collision integral with the buffer gas, which in turn depends on the ion’s geometry. Ions with open geometries undergo more collisions with the buffer gas and hence travel more slowly than compact ions. Thus ion mobilities provide a way to characterize an ion by its physical size and this property has been exploited by analytical chemists.4 For example, the portable chemical warfare agent detectors currently used by the US Army and NATO are ion mobility spectrometers that operate under ambient conditions (the mobilities are measured in air). Ion mobility measurements have been used by physical chemists for many years to characterize ion–molecule interactions.3 These measurements are usually performed under well-defined conditions on instruments that incorporate mass spectrometers to identify the ion. Mobility measurements have also been used to determine particle size distributions.5 That structural isomers of the same ion can have different mobilities was first demonstrated by Carr,6 though it was the work of Bowers and collaborators which really showed the potential of mobility measurements as a structural probe. Their studies of carbon clusters confirmed the presence of chains, monocyclic rings, and fullerenes and revealed a variety of polycyclic ring isomers.7 A number of new, and more exotic, carbon cluster isomers have now been observed and assigned, including ‘fullerene dumbells’ (fullerenes linked by a carbon chain) and ‘tadpoles’ (a chain attached to a carbon ring).8 Furthermore, annealing studies have shown that carbon rings can be converted into fullerenes, providing the basis for the most plausible mechanism of fullerene synthesis.9 Mobility measurements have also been applied to a variety of metal-containing carbon clusters, salt clusters, and metal clusters in addition to the clusters of the Group 14 elements discussed here.103 Experimental methods
Mobility measurements are usually performed in a drift tube.3 The drift tube contains the buffer gas and provides a uniform electric field for the ions. Experiments intended to deduce structural information from ion mobility measurements must be performed under well defined conditions, where the mass of the drifting ion is known and the buffer gas does not contain species that can cluster with the drifting ions. Two basic experimental configurations have been employed: the injected ion drift tube (which usually has a buffer gas pressure <10 Torr)11 and the high resolution configuration (with a buffer gas pressure of hundreds of Torr).12,13 In the injected ion drift tube approach, ions (often mass-selected) are injected into a drift tube through a small aperture. After traveling across the drift tube, some of the ions exit through another aperture. They are then mass analyzed and detected. Mobilities are measured by injecting a short packet of ions and recording how long it takes for them to reach the detector. If the injected packet is sufficiently narrow, the width of the ion packet at the detector is limited by diffusional broadening as it travels through the drift tube (the ion densities are usually low enough that space charge effects are negligible in these experiments). The resolving power is then given by eqn. (1)14 | (1) |
The high resolution configuration is conceptually similar to that employed in ion mobility spectrometers developed for analytical applications. Our high resolution apparatus is shown schematically in Fig. 1.12 It consists of a source region directly attached to a 63 cm long drift tube and the whole assembly operates at a pressure of around 500 Torr. At the end of the drift tube the exiting ions are analyzed by a quadrupole mass spectrometer and detected. Cluster ions are generated by pulsed laser vaporization and drawn into the drift tube region of the instrument by electric fields. Neutral species are prevented from passing from the source region into the drift tube by the ion gate which consists of a stack of electrodes with 5 mm apertures. An electric field draws the ions through the ion gate while a counter flow of buffer gas stops the neutrals. In the drift tube, a uniform electric field is provided by a stack of electrodes connected to a voltage divider. The drift voltage is 10000–15000 V. This provides a resolving power of >100, an order of magnitude improvement over that obtained in the injected ion drift tube configuration. The drift voltage is limited by electrical breakdown.
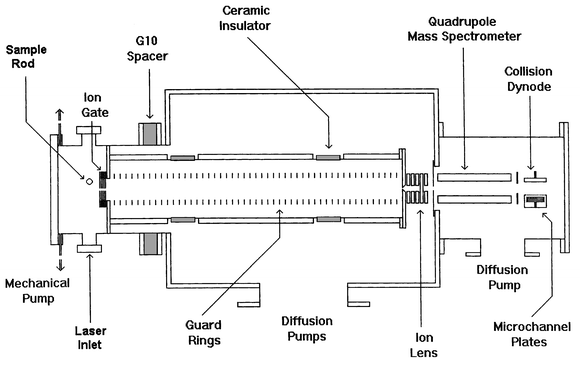 | ||
| Fig. 1 Schematic diagram of the high-resolution ion mobility apparatus. | ||
In many respects the injected ion drift tube and the high resolution configuration are complementary. With the ability to inject ions at controlled energies, and with mass selection before and after the drift tube, the injected ion drift tube can be used to perform studies beyond simple mobility measurements. For example, isomer-specific reactivities with molecules diluted into the buffer gas can be examined.11 By varying the injection energy one can examine the interconversion between different structural isomers.10 Here, some of the ion’s injection energy is converted into internal energy as it enters the drift tube. Once in the drift tube the cluster cools by further collisions with the buffer gas. This heating–cooling cycle anneals a cluster into the geometry that is thermodynamically preferred at the energy where the isomer populations are frozen-in (this is not necessarily the global minimum). By raising the injection energy further the ions become hot enough to dissociate and one can estimate dissociation energies and identify the fragmentation products.15
Another important feature is the ability to change the temperature of the drift tube. Temperature-dependent measurements provide information about the ion–buffer gas interaction potential and enables one to study the processes of thermally-induced dissociation and isomerization. Information on liquid–solid phase transitions has also recently been obtained (see below). The small drift tube used in the injected ion drift tube apparatus is readily cooled down to <80 K by liquid nitrogen flow or resistively heated to >500 K. The temperature of the large drift tube in the high-resolution apparatus can be varied over a narrower range around 300 K. With the high resolution apparatus it is possible to follow cluster isomerization processes that occur as the ions travel through the drift tube. Isomerization rates can be obtained by varying the drift time (over the range 0.1–1.0 s) and Arrhenius activation parameters can be derived if these measurements are performed as a function of temperature.10
4 Mobility calculations
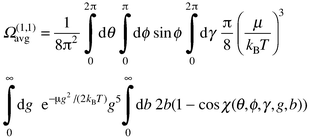
Structural assignments for unknown species observed in mobility measurements become possible by comparison of the measured mobilities with mobilities computed for reasonable candidate geometries. In general, the mobility of a rigid ion undergoing elastic collisions with a gas depends on a series of collision integrals, Ω(l,s), which characterize the ion and buffer gas combination. In the Rayleigh limit where m (the mass of the ion) >> mb (the mass of a buffer gas atom) the series of collision integrals reduces essentially to a single one, Ω(1,1) (see below). Since helium is the buffer gas of choice, this approximation is almost always valid. Another crucial simplification is achieved by operating in the low field limit where the relative velocity distribution of the ion and buffer gas is essentially thermal at the buffer gas temperature. This ensures that there is no alignment of the drifting ion and so the effective collision integral equals the orientationally averaged quantity Ω(1,1)avg . In the low field limit, the mobility is proportional to the diffusion constant and can be calculated from eqn. (2)14 | (2) |
Ignoring rotational–translational coupling, the collision integral is obtained by integrating the momentum transfer cross-section over the distribution of relative velocities between the buffer gas atom and the ion. The momentum transfer cross-section (for a particular collision geometry) is obtained by averaging a function of scattering angle χ over the impact parameter beqn. (3):
 | (3) |
 | (4) |
While it is obvious that the projection approximation neglects all long-range attractive interactions between the ion and buffer gas atoms, it is less obvious that it also ignores all the details of the scattering process. For a body made entirely of convex surfaces the effects of scattering (with a hard sphere potential) are not important and the collision integral evaluated from the scattering angles is equal to that obtained from the projection approximation.17 However, when atoms are scattered on bodies with concave surface some of the trajectories experience multiple collisions. The collision integral calculated from the scattering angles then exceeds that obtained from the projection approximation.17 While all molecular surfaces have concave parts because of local surface roughness, this typically only results in a few percent difference between the collision integral and the projection. However, for objects with grossly uneven surfaces or cavities, differences of up to 25% have been found.17 The exact hard-spheres scattering (EHSS) model was developed to account for multiple scattering within the framework of a hard sphere potential.17 Like the projection approximation, the ion is treated as a collection of hard spheres and the collision radius is adjusted to reproduce the measured mobilities. While this model is a significant improvement over the projection approximation, it still ignores all long-range interactions between the ion and buffer gas.
The long-range interactions are incorporated by propagating classical trajectories between buffer gas atoms and the target ion in a realistic intermolecular potential.18 The scattering angle, χ, is determined from the trajectory and eqn. (3) is solved numerically. In the work performed so far, the potential between the ion and buffer gas atom is assumed to consist of two parts: van der Waals and charge-induced dipole interactions. The first term is modeled as a sum of pair-wise Lennard–Jones (6–12) interactions between the buffer gas atom and each atom in the ion. The Lennard–Jones parameters (the depth ε and σ, the distance where ε is zero) are obtained by fitting measured mobilities as a function of temperature. The charge-induced dipole term was initially evaluated assuming that the charge was uniformly delocalized over all atoms. The charge distribution obtained from the first-principles calculations is now usually employed. In most cases, the charge distribution makes a noticeable (>1%) difference only at low temperatures. However, a highly non-symmetric charge distribution has significant consequences at room temperature.8 Calculating the mobility by the trajectory method is time consuming, requiring tens of hours on a workstation for the clusters considered here.
In the three methods described above—the projection approximation, the exact hard spheres scattering model, and the trajectory method—the clusters are represented through the position of atomic nuclei. In reality, the buffer gas atoms interact with ions via their electronic wave functions, thus the mobility actually characterizes not the nuclear geometry of an ion, but the electron density distribution. Ideally, this distribution should be converted into a potential which can then be used for trajectory calculations. Such an approach has not yet been employed. However, the electron density distributions have been introduced within the framework of a hard sphere potential in a model that employs scattering on electron density isosurfaces (SEDI).19 In this approach, the cluster is represented by a surface defined numerically as a set of points in space where the calculated electron density assumes a certain value. This value is adjusted to fit the measured mobilities. The collision integral is evaluated by scattering buffer gas atoms on the isosurface. Like the EHSS model, this treatment obviously ignores the long-range ion–buffer gas interactions that are accounted for by the trajectory method. It is, however, superior to the trajectory method in some respects for negative ions. Anions often have mobilities which are systematically smaller than the mobilities of the corresponding cations. This difference appears to be related to the electron density of the anions extending further than for the corresponding cations. Models where the clusters are represented through the position of their atomic nuclei (EHSS and the trajectory method) often fail to accurately reproduce the mobilities of anions, presumably because of the difficulty of representing the spill-out of the electron density. However, the SEDI model, which is based on calculated electron densities, can account for the differences between the mobilities of anions and cations.
5 Semiconductor clusters: an overview
Clusters of the semiconducting elements (silicon and germanium) are of interest for both scientific and technological reasons. They are fascinating scientifically because they assume geometries that have nothing in common with the packing of the corresponding bulk solids. They are important technologically because with the continuing miniaturization of electronic devices, minimum device features will eventually approach the cluster size regime. This makes understanding the properties of semiconductor clusters of critical importance. Under ambient conditions tin (which is below germanium in the periodic table) is a metal (white tin). However, it appears that tin clusters adopt geometries similar to those found for silicon and germanium clusters rather than those expected for a metal cluster. Bulk tin has another allotrope (grey tin) that is a semiconductor with the same crystal structure as silicon and germanium, but it is only stable at low temperatures. Because tin clusters adopt geometries that are similar to those found for silicon and germanium clusters, our findings for tin clusters are included here. Tin clusters are of particular interest because ion mobility measurements also indicate that they have melting points that are higher than the bulk material (clusters are normally expected to have depressed melting points). Finally, we also touch upon results for lead clusters, to contrast them with the species of lighter Group 14 elements.For the reasons described above, silicon clusters in particular have attracted an intense research effort, and there has been a lot of speculation about their structures. For example, the prevalence of Si10 and Ge10 fragments in the dissociation of Sin and Gen anions and cations20 was interpreted as evidence for various types of packing in larger Sin and Gen clusters, and the low reactivity of Si13+ with C2H4, NH3, O2, and H2O21 has been taken to indicate icosahedral packing. However, the preference for certain fragments appears to reflect their thermodynamic stability rather than the presence of particular structural units, and calculations for silicon clusters consistently show the icosahedral geometry to be extremely high in energy and not even stable as a local minimum. As we will describe below, most of our current knowledge about the geometries of medium-sized atomic clusters has been gained from ion mobility measurements.
There have been a number of spectroscopic investigations of small silicon and germanium clusters. The geometries of some size-selected, matrix-isolated Sin (n ≤ 7) have been determined by Raman and IR spectroscopy.22 Structural assignments were made by comparing the measured vibrational spectrum to those calculated for a variety of low energy geometries. The structures of some Sin (n ≤ 7) and Gen (n ≤ 4) clusters have also been elucidated using vibrationally-resolved anion PES.23 Vibrational resolution could not be achieved for larger cluster sizes, however the structures of Si10−, Ge7−, and Ge10− have been assigned on the basis of their electronic band patterns.
Optimization of small Sin using ab initio24 and density functional theory (DFT)25 methods yields highly coordinated structures which are favored over bulk-like fragments because they have fewer dangling bonds. The global minima are a triangle for n = 3, a rhombus for n = 4, trigonal, tetragonal, and pentagonal bipyramids for n = 5, 6, and 7 respectively, and a distorted bicapped octahedron for n = 8. Note the transition to three-dimensional geometries at n = 5. The geometries for n ≤ 7 have been confirmed by vibrational spectroscopy. For n = 9 and 10, structures produced by capping an octahedron and a trigonal prism are both low in energy. For Si10 the tetracapped trigonal prism is now accepted as the global minimum. However, the global minimum for Si9 is neither of the above but a capped Bernal’s structure (a stack of two rhombuses with a capping atom on top).26 Searches for ground state geometries for n ≥ 11 using first-principles energy evaluations have been less extensive. For n = 11–13 geometries based on further capping of the trigonal prism unit have been considered.27,28 The results of unbiased geometry searches for these and larger silicon clusters will be described below.
6 Ion mobility measurements for silicon cluster cations
Fig. 2 shows drift time distributions measured for Si27+ and Si28+ using an injected ion drift tube apparatus (low resolution) and the new high resolution apparatus. The drift time distribution shows the amount of time it takes for the ions to travel through the drift tube, and each peak represents a different structural isomer. With the dramatic improvement in the resolving power many more structural isomers have been resolved. The distribution for Si27+ is dominated by two main isomers while that for Si28+ is dominated by one. Fig. 3 shows a plot of the inverse reduced mobilities of the main features resolved in the drift time distributions for silicon cluster cations, Sin+, with n = 4–60.29 The dominant feature in the drift time distribution for each cluster size is represented by the filled point while other clearly resolved features are represented by open points. The reduced mobility is the measured mobility normalized to the buffer gas number density at STP, while the inverse reduced mobilities are plotted here because they are proportional to the collision integral of the ion with the buffer gas. The systematic increase in the inverse mobilities apparent in Fig. 3 results from the increase in the physical size from adding more atoms to the cluster. The break in the mobilities at around n = 24–34 indicates a structural transition to more compact geometries (both exist in the transition region). Crude estimates suggested that the clusters undergo a transition from prolate growth to near-spherical geometries.21 However, unlike carbon clusters where it was known what geometries to expect, for silicon the geometries were largely unknown. The results of theoretical studies for silicon clusters with up to around 11 atoms were described above. The problems associated with extending these studies to larger cluster sizes are well known: first, as the cluster becomes larger the time required for a single energy calculation usually increases as a fairly high power of the number of atoms; and second, there is more phase space to search before one can be sure that the lowest-energy geometry has been found. Many reports on the structural optimization of silicon clusters have been published over the last decade. Each one presenting geometries lower in energy than those previously known. The major problem in these studies is not so much finding a lower-energy geometry, but knowing when the lowest-energy geometry is found and hence when to stop looking. The strategy that we have adopted is to compare properties of the calculated geometries to those that have been measured, and to use agreement between the measured and calculated properties as a criteria for identification of the global minimum. Not surprisingly, the most important piece of experimental information employed in these studies is the mobility. While a mobility measurement alone usually cannot uniquely identify a particular geometry (many different geometries can have the same mobility) the criteria that the calculated geometry be low in energy and have a mobility that fits the measured mobility is often sufficient to uniquely identify the ground state. Another important piece of experimental data employed in these studies is the dissociation energies. Agreement with the measured dissociation energies as a function of size indicates that the search procedure has, at least, come close to finding the global minimum.30 Ionization energy measurements,31 electron affinities, and fragmentation patterns have also been used to confirm the structural assignments described below.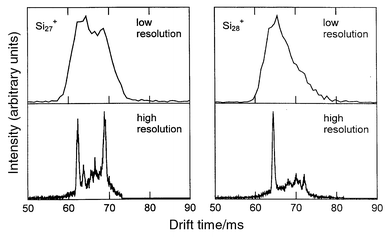 | ||
| Fig. 2 Drift time distributions measured for Si27+ and Si28+ with the injected ion drift tube apparatus (low resolution) and with the high resolution apparatus. | ||
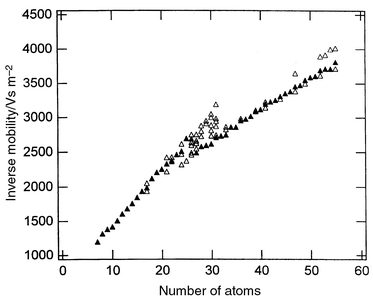 | ||
| Fig. 3 Plot of the inverse reduced mobilities for silicon cluster cations, Sin+, n = 4–60. The dominant feature in the drift time distribution for each cluster size is represented by the filled point while other clearly-resolved features are represented by open points. | ||
The geometries for Sin, n = 10–20, were found by Ho and collaborators32 primarily through an unbiased global search using simulated annealing and a genetic algorithm coupled with a tight-binding potential. Promising candidates were re-optimized with DFT. Simulated annealing had repeatedly failed to locate the lowest-energy geometries for n > 12, so the use of a genetic algorithm was critical. The geometries for cations and anions were found by relaxing a number of low-energy neutral geometries for each Sin (n ≤ 20) without symmetry constraints. Additional simulated annealing was performed using the Car–Parrinello LDA method. For n < 12, a global search was performed. For n > 12 a local search was initiated from the geometries of low-energy neutrals with the objective of finding any distortions that lower the energy. For neutrals, cations, and anions with n < 11 the accepted geometries were obtained.19 For larger sizes, the geometries were substantially lower in energy than any previously described in the literature. The global minima found for n = 11–18 are shown in Fig. 4. Geometries based on stacked Si9 tricapped trigonal prism (TTP) units are prevalent. However, the geometries of Sin, Sin+, and Sin− differ in details for most n. For n = 19 and 20, near-spherical, cage-like geometries become competitive with prolate TTP stacks, with the exact energetic ordering depending on the charge.
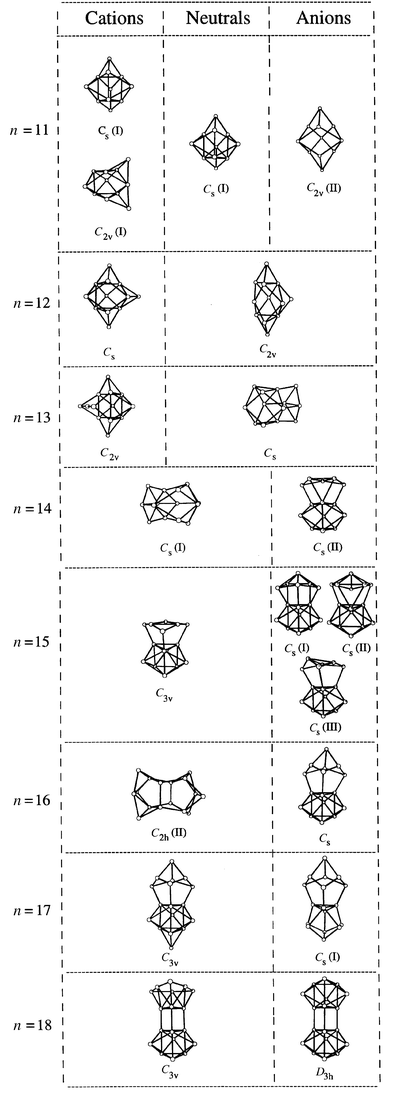 | ||
| Fig. 4 Global minima (obtained with the Perdew–Wang–Becke 88 gradient corrected functional) for the Sin, n = 11–18, cations, neutrals, and anions. For Si15−, the Cs(I)/Cs(II) minimum that is believed to be the lowest energy geometry (see text) is also shown. Multiple entries indicate that the geometries are degenerate to within the computational error margin (∼ 3 meV atom−1). | ||
Fig. 5 shows a comparison of the measured inverse mobilities for silicon cluster cations (n = 4–18) to those calculated by the trajectory method for the lowest energy cation geometries. Since the geometries of smallest clusters (n ≤ 7) are known, they were used to extract the Lennard–Jones parameters for the elementary Si–He interactions (ε = 1.38 meV and σ = 3.47 Å). The calculations employed partial charge distributions obtained from DFT, although this made only a small difference (<1%) to the calculated mobilities. Except for Si18+ the calculated mobilities are within 2% of the measured values. This is the generally accepted error margin (it is a combination of the errors from the experiment, the calculated bond lengths and angles, and the mobility calculations). For Si18+, two isomers are resolved in the high resolution ion mobility measurements. The mobility of the dominant isomer does not match the mobility calculated for the lowest-energy geometry found in the DFT calculations. However, the calculated mobility for the second lowest-energy isomer found (a D3h geometry) is in excellent agreement with the mobility of the dominant isomer, while the mobility of the lowest energy isomer is in good agreement with the mobility of the minor component in the drift time distribution. Thus DFT may have switched the ordering of these two isomers. It is also possible that the ground state geometry has yet to be found for this cluster.
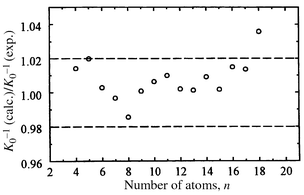 | ||
| Fig. 5 Comparison of measured inverse mobilities for the dominant features to those calculated forthe lowest-energy geometries for the Sin cations with n = 4–18. Dashed lines delimit the customary 2% error margin. | ||
Mobilities calculated for all previously proposed non-TTP based Sin geometries in the n ≲ 25 range deviate from the measured values by 5–15%. In particular, the mobility measurements rule out the stacked alternating triangles,33 the stacked hexagonal rings,34 icosahedron-based geometries, and any geometry based on the tetrahedral bonding network of bulk silicon. In addition to agreement with the mobilities, the dissociation energies computed for Sin (n ≤ 18) cations match the experimental results, indicating that the search procedure has, at least, come close to the global minima. The fragmentation channels calculated for Sin+ global minima also agree with experiment.
7 The differences between silicon cluster anions and cations
The mobilities of silicon cluster anions show the same general features as observed for the cations.29 The addition of two electrons apparently increases the stability of the prolate isomers relative to the more spherical ones, so that the structural transition from prolate to more spherical geometries occurs slightly later for the anions than for the cations. The inverse mobilities of the anions are also systematically larger than those for the cations. This shift presumably results from differences in the exterior electron densities caused by the addition of the extra electrons. Mobilities calculated for the anions by the trajectory method do not fit the measured values. The calculated inverse mobilities increase faster as a function of cluster size than the measured values. This discrepancy also probably results from the electron density spill-out. The SEDI (scattering on electron density isosurfaces) model should be able to account for this effect. Like the exact hard-spheres scattering (EHSS) model, the SEDI model ignores the long-range interactions between the ion and buffer gas. However, mobilities calculated for all the silicon cluster cations by the EHSS model are within 1% of those calculated by the trajectory method, and so the SEDI model should work well for the anions. This is quite different from the situation with carbon clusters where substantial deviations where found when the long-range interactions were not properly taken into account. One obvious difference is that silicon clusters have less diverse geometries than carbon clusters. Silicon clusters with n ≥ 5 all have relatively compact, three-dimensional structures. In addition, silicon clusters have longer bond lengths, about 2.5 Å compared to 1.3–1.4 Å in carbon, and for this reason the cumulative long-range potential for silicon clusters depends less strongly on the cluster size and shape. Thus a Si–He collision distance, which incorporates the local environment, is more transferable to different cluster geometries than for carbon.The mobilities evaluated by the SEDI model for the global minima of the Sin anions are within 2% of the measurements for all sizes considered. In particular, the systematic deviations observed with the EHSS model and the trajectory method are not present. The systematic deviations result because the mean negative charge per atom is proportional to 1/n. So the electron spill-out for smaller clusters is more significant, making them physically ‘larger’. This effect is neglected in the EHSS model, but accounted for by the SEDI model. In principle, the same phenomenon should arise for cations, where the mean positive charge increases with decreasing cluster size. In practice, the expansion of the anion’s electronic cloud appears to be greater than the contraction of the cation’s, thus the effect is primarily manifested for anions.
Fig. 6 shows a plot of the difference between the inverse mobilities of the Sin anions and cations (the points are the experimental data for the dominant isomers and the lines are SEDI calculations). The difference is about 100 Vs m−2 for most n, but substantial fluctuations occur for some cluster sizes. The fluctuations result when changing the charge state causes a reordering of the low-energy isomers and hence a geometry change. Significant fluctuations are observed for clusters as large as Si43. The dashed line in Fig. 6 shows mobilities calculated by the SEDI method assuming that the anions have the same geometries as the cations (except for local relaxation). The solid line shows the result when the global minima are used for the anions, except for Si15− (see below). The minima at n = 9, 15, 16, and 18 indicate that the anion geometries are more compact than the cation analogs for these clusters. For Si15− the Cs(III) global minima does not fit the difference between the anion and cation mobilities, while that for the second lowest energy isomer (the Cs(I)/Cs(II) isomer shown in Fig. 4) does. The Cs(I)/Cs(II) geometry may be the global minimum for Si15−. Note that the mobilities of both the Cs(III) and Cs(I)/Cs(II) isomers are within 2% of the measured value for Si15−; it is the difference in mobilities on going from the cation to the anion that does not fit for the Cs(III) geometry.
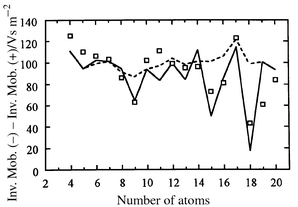 | ||
| Fig. 6 Differences between the inverse mobilities (K0−1) for Sin+ and Sin–. The points are the measured values for the dominant isomers and the lines are from SEDI calculations. The solid line corresponds to the assumption that the clusters in both charge states adopt their lowest-energy geometries (except that we have used the Cs (I)/Cs (II) isomer for Si15−). The dashed line shows the result if the geometries of the Sin anions were identical to those of global minima for cations except for local relaxation. | ||
The mobility measurements have confirmed (with a few minor adjustments) the TTP-based structures of medium-sized Sin+ and Sin− found by global optimization. This is a strong indication that the neutral geometries predicted by the same optimization scheme are also correct. This is supported by ionization potentials calculated for the Sin global minima which are in a good agreement with the measurements for all n < 20, whereas ionization potentials calculated for second-lowest energy geometries are not in agreement with experiment for many sizes.35
8 Structural characterization of medium-sized germanium clusters
Bulk germanium and silicon pack in the same diamond lattice and the geometries of smallest (n ≤ 10) Gen and Sin clusters appear to be identical by both calculation and experiment.26 So it was often assumed that the geometries of silicon and germanium clusters would be identical except for the 4% difference in the bond lengths. However, mobility measurements for Gen cations revealed that the structural transition to more spherical geometries begins at n ∼ 65,36 almost three times the size where this occurs for Sin+ species. The size-dependent features in mobilities of Gen+ and Sin+ start differing at n ∼ 15. So in the intermediate size regime the geometries of silicon and germanium clusters are significantly different and perhaps the first question to answer is where and how the growth patterns of silicon and germanium clusters diverge.A geometry search was performed for Gen and Gen+ with n ≤ 16 by relaxing an extensive set of low-energy Sin and Sin+ isomers.37 The structures for Gen and Sin neutrals first differ at n = 13, while those for cations diverge one size earlier. The geometries for Ge14 and Ge14+ are identical to Si14 and Si14+, but they diverge again for for n = 15 and 16. A comparison of the Gen and Sin geometries for n = 13, 15, and 16 is shown in Fig. 7. For n = 13 and 15 the silicon and germanium geometries just differ in the orientation of the capping atoms. For n = 16 the difference is more substantial. To test these predictions, mobilities were calculated and compared with the measured values. The results are shown in Fig. 8. The filled points are the lowest-energy Gen+ geometries according to the DFT calculations of ref. 37. For n = 12, 13, 15, and 16 the lowest-energy Gen+ geometries are different from their silicon analogs and the open points for these clusters are the mobilities of the lowest- energy silicon geometries relaxed for germanium. For Ge12+, the open point (the lowest-energy silicon geometry relaxed for germanium) fits the measured value better than the filled point (the lowest-energy Ge12+ geometry according to DFT). Apparently, DFT has reversed the ordering of these isomers. For Ge13+ the lowest-energy isomer according to DFT and the lowest-energy silicon geometry relaxed for germanium are both in good agreement with the measured mobility. However, for n = 15 and 16 the lowest-energy isomers according to DFT fit the measured mobilities while the lowest-energy silicon geometries relaxed for germanium clearly do not. Thus comparison of the measured and calculated mobilities proves that the growth pathways of Sin and Gen cations indeed diverge by n = 15. This conclusion is supported by data on the dissociation energies and the fragmentation pathways.
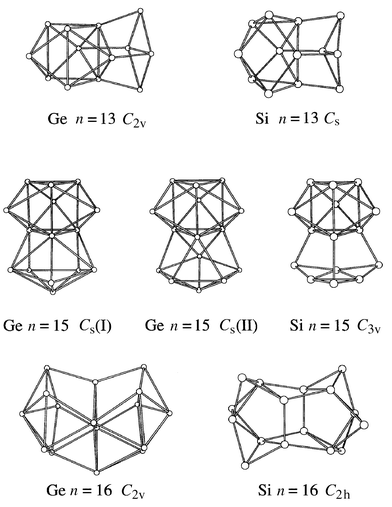 | ||
| Fig. 7 Lowest-energy geometries according to DFT (using the Perdew–Wang–Becke 88 gradient corrected functional) for the Sin and Gen neutrals with n = 13, 15, and 16. | ||
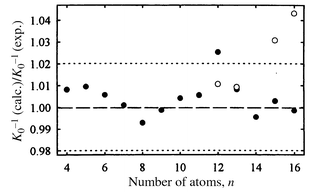 | ||
| Fig. 8 Relative deviations of the inverse mobilities (K0−1) calculated for Gen cations from the measurements. Filled circles are for the lowest-energy isomers according to DFT. For Sin+n < 12 and n = 14 the lowest energy germanium geometries are identical to their silicon analogs. The open points for n = 12, 13, 15, and 16 are the mobilities of the lowest-energy silicon geometries relaxed for germanium. | ||
9 Tin clusters are like silicon and germanium clusters
Tin is at the transition between the semiconducting elements above it in the periodic table, and the metallic elements below. Tin’s normal allotrope under ambient conditions (β-tin) is a metal with a body-centered tetragonal lattice, but it also has a semiconducting form (α-tin) that is more stable below 286 K. α-Tin has the same diamond lattice as silicon and germanium. The mobilities of Snn cations have recently been measured up to n = 68.38Fig. 9 shows a plot of the relative mobilities of silicon, germanium, and tin clusters. The relative mobility is given by the measured mobility divided by the mobility of a sphere of bulk density. A prolate growth pattern is characterized by relative mobilities which decrease with increasing cluster size. While clusters that retain spherical geometries have relative mobilities close to 1.0. The relative mobilities of tin clusters up to n ∼ 35, generally follow the prolate growth pattern of Gen+, but there are size-specific variations above n = 21 (see Fig. 9). This suggests that tin clusters in this size regime adopt the same TTP-based geometries as their silicon and germanium analogs. In the n ∼ 35–65 size range, tin clusters gradually rearrange towards near-spherical geometries, passing through several intermediate structural families. This stepwise ‘creep’ towards spherical structures is distinct from the abrupt rearrangements that occurs for Sin and Gen cations.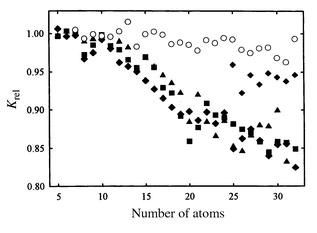 | ||
| Fig. 9 Relative mobilities of group 4 cluster cations measured at room temperature. Filled symbols are for silicon (diamonds), germanium (squares), and tin (triangles). Empty circles are for lead. | ||
Mobilities were measured for tin clusters at low temperatures. Two or three isomers were resolve for some Snn+ sizes in the n = 18–49 range at 78 K. However, the emergence of these isomers is just a consequence of the improved resolution at low temperature. Hence the geometries of Snn+ remain unchanged between 300 K and 78 K. In contrast, bulk tin undergoes a reversible β to α phase transition within this temperature range. Furthermore, annealing with high injection energies does not affect the Snn+ mobilities even up to the point of collisional dissociation. So the prolate TTP-based structures certainly appear to be the lowest-energy geometries for tin clusters up to n ∼ 35. This is the first time that clusters of a metallic element have been found to form highly distorted, non-compact geometries; in all other cases they form near-spherical, close-packed structures.
10 Melting points of tin clusters
The melting transition in finite systems has attracted attention since the early 1900s. All theoretical treatments (both analytical/macroscopic and computational/microscopic) show a depression of the melting point in nanoparticles compared to that of the bulk.39 This has been confirmed in experiments on both surface-supported and gas-phase clusters.40 The simple explanation for the depressed melting points is that the surface atoms are under-coordinated and thus can be detached from their positions and moved around easier than internal atoms. Previously, the melting points of free (unsupported) metal clusters have been determined indirectly by a novel method that depends on monitoring the extent of photodissociation as a function of temperature.40 Another way of locating the melting transition is directly through a shape change. Since a liquid cluster is expected to be a spherical droplet, if the solid cluster has a geometry that is distorted from spherical, it should be possible to identify the melting transition from the mobility change associated with the non-spherical to spherical transition. Tin clusters with n ∼ 20–30 have highly prolate geometries and the low melting point of bulk tin (505 K) makes the relevant temperature range easily accessible. Note that many small molten metal clusters are expected to be slightly distorted from perfect spherical symmetry because of electronic shell effects. However, these distortions are small and, in particular, they are much less distorted than the prolate tin clusters. Mobilities have been measured for Snn+ (n < 32) at temperatures up to ∼ 555 K.41 Surprisingly, the clusters retained their prolate geometries, thus no melting occurs at temperatures up to 50 K above the bulk melting point. This is the first observation of solid clusters above the bulk melting point. However, the origin of the enhanced melting points is not really clear. One factor may be that the clusters have geometries which are quite different from the body-centered tetragonal habit of β-tin. On the other hand, the cohesive energies of the reconstructed clusters are still expected to be significantly less than the cohesive energy of bulk tin.11 The covalent to metal transition in group 14 clusters
It is apparent from the preceding that the geometries of medium-sized tin clusters are more closely allied with the semiconducting elements of group 14 than the close packed near-spherical geometries expected for a typical metal cluster. In a sense, the nonmetal-to-metal transition that occurs between germanium and tin in the bulk elements fails to occur in their clusters. So a natural question to ask is whether this transition occurs between Snn and Pbn. Relative mobilities measured for Pbn (n ≤ 32) cations are shown in Fig. 9.42 The relative mobilities are close to one for all Pbn+ studied, which indicates that they assume compact near-spherical geometries throughout this size range. Such geometries are expected for metal clusters, and one can conclude that the transition from ‘covalent’ to ‘metallic’ geometries in the group 14 clusters occurs between tin and lead, one row lower than in the bulk elements.12 Conclusions
In this article we have described recent developments in the measurement and analysis of ion mobilities. The new high resolution implementation of the technique provides an order of magnitude improvement in the resolving power and permits the separation of previously unresolved structural isomers. Structural assignments are based on the comparison of measured and calculated mobilities, and there has been a corresponding improvement in the methods used to calculate mobilities: the trajectory method and the SEDI method (which is based on scattering off of the electron density) are more sophisticated and more reliable than previous methods.A combination of ion mobility measurements and density functional theory has been used to elucidate the geometries of medium-sized semiconductor clusters. The geometries are based on stacked tricapped trigonal prisms. Mobility measurements alone can only provide information on the general shape of the cluster. They usually cannot identify the specific geometry because many different geometries can have the same mobility. However, the combination of theory with mobility measurements provides a powerful approach to identifying the lowest-energy geometry. Agreement with the measured mobility is a good indication that the lowest-energy geometry has been found and that the search for a lower-energy geometry can be terminated. For silicon cluster anions and cations with n ≤ 18 there was good agreement between the measured mobilities and those determined for the optimized geometries, except for Si15− and Si18+. For these clusters the second-lowest energy isomer fits the experimental data. It also possible that the lowest-energy isomer has not yet been found in these cases. The methods described here are quite general and should be extendable to larger cluster sizes and to different types of clusters.
In addition to information on the geometries, ion mobilities can be used to provide information on phase transitions in clusters. So far the method has only been used to show that tin clusters with around 20–30 atoms have melting points that are more than 50 K above that of the bulk. The measurement of melting points for individual clusters as a function of size are feasible. The method should also be extendable to clusters of other types of elements, the only limitation is that there should be a detectable geometry or volume change associated with the melting transition.
13 Acknowledgments
We are indebted to K.-M. Ho, B. Liu, Z.-Y. Lu, and C.-Z. Wang for an extended collaboration on the optimization of semiconductor clusters and the calculation of their properties. We are grateful to G. C. Schatz for help in developing methods to calculate mobilities. This research was supported by the National Science Foundation and by the Army Research Office.14 References
- For a recent review of atomic cluster studies, see, W. A. de Heer, Rev. Mod. Phys., 1993, 65, 611 CrossRef CAS
.
- For a recent review of gas phase biomolecule studies, see, C. S. Hoagland-Hyzer, A. E. Counterman and D. E. Clemmer, Chem. Rev., 1999, 99, 3037 CrossRef
.
- E. A. Mason and
E. W. McDaniel,
Transport Properties of Ions in Gases,
Wiley, New York,
1988. Search PubMed
.
- For a recent review of the analytical applications of ion mobility
measurements, see, J. I. Baumbach and G. A. Eiceman, Appl. Spectrosc., 1999, 53, 338A Search PubMed
.
- T. M. Sanders and S. R. Forest, J. Appl. Phys., 1989, 66, 3317 CrossRef CAS
.
- T. W. Carr, J. Chromatogr. Sci., 1977, 15, 85 CAS
.
- G. von Helden, M. T. Hsu, P. R. Kemper and M. T. Bowers, J. Chem. Phys., 1991, 95, 3835 CrossRef CAS
.
- See, for example, P. Dugourd, R. R. Hudgins, J. M. Tenenbaum and M. F. Jarrold, Phys. Rev. Lett., 1998, 80, 4197 CrossRef CAS
.
- For a review of the fullerene formation mechanisms, see, N. S. Goroff, Acc. Chem. Res., 1996, 29, 77 CrossRef CAS
.
- For an overview of the other cluster studies, see, D. E. Clemmer and M. F. Jarrold, J. Mass Spectrom., 1997, 32, 577 CrossRef CAS
.
- See, for example, M. F. Jarrold and J. E. Bower, J. Chem. Phys., 1992, 96, 9180 CrossRef CAS
.
- Ph. Dugourd, R. R. Hudgins, D. E. Clemmer and M. F. Jarrold, Rev. Sci. Instrum., 1997, 68, 1122 CrossRef CAS
.
- C. Wu, W. F. Siems, G. R. Asbury and H. H. Hill, Anal. Chem., 1998, 70, 4929 CrossRef CAS
.
- H. E. Revercomb and E. A. Mason, Anal. Chem., 1975, 47, 970 CrossRef CAS
.
- M. F. Jarrold and E. C. Honea, J. Phys. Chem., 1991, 95, 9181 CrossRef CAS
.
- L. A. Viehland and A. S. Dickinson, Chem. Phys., 1995, 193, 255 CrossRef CAS
.
- A. A. Shvartsburg and M. F. Jarrold, Chem. Phys. Lett., 1996, 261, 86 CrossRef CAS
.
- M. F. Mesleh, J. M. Hunter, A. A. Shvartsburg, G. C. Schatz and M. F. Jarrold, J. Phys. Chem., 1996, 100, 16082 CrossRef CAS
.
- A. A. Shvartsburg, B. Liu, M. F. Jarrold and K.-M. Ho, J. Chem. Phys., 2000, 112, 4517 CrossRef CAS
.
- Q. L. Zhang, Y. Liu, R. F. Curl, F. K. Tittel and R. E. Smalley, J. Chem. Phys., 1988, 88, 1670 CrossRef CAS
.
- M. F. Jarrold, Science, 1991, 252, 1085 CAS
.
- E. C. Honea, A. Ogura, C. A. Murray, K. Raghavachari, W. O. Sprenger, M. F. Jarrold and W. L. Brown, Nature, 1993, 366, 42 CrossRef CAS
.
- C. C. Arnold and D. M. Neumark, J. Chem. Phys., 1993, 99, 3353 CrossRef CAS
.
- K. Raghavachari and C. M. Rohlfing, J. Chem. Phys., 1988, 89, 2219 CrossRef CAS
.
- P. Ballone, W. Andreoni, R. Car and M. Parrinello, Phys. Rev. Lett., 1988, 60, 271 CrossRef CAS
.
- I. Vasiliev, S. Öǧüt and J. R. Chelikowsky, Phys. Rev. Lett., 1997, 78, 4805 CrossRef CAS
.
- M. V. Ramakrishna and A. Bahel, J. Chem. Phys., 1996, 104, 9833 CrossRef CAS
.
- U. Röthlisberger, W. Andreoni and P. Giannozzi, J. Chem. Phys., 1992, 96, 1248 CrossRef
.
- R. R. Hudgins, M. Imai, M. F. Jarrold and Ph. Dugourd, J. Chem. Phys., 1999, 111, 7865 CrossRef CAS
.
- A. A. Shvartsburg, M. F. Jarrold, B. Liu, Z.-Y. Lu, C.-Z. Wang and K.-M. Ho, Phys. Rev. Lett., 1998, 81, 4616 CrossRef CAS
.
- K. Fuke, K. Tsukamoto, F. Misaizu and M. Sanekata, J. Chem. Phys., 1993, 99, 7807 CrossRef CAS
.
- K.-M. Ho, A. A. Shvartsburg, B. Pan, Z.-Y. Lu, C.-Z. Wang, J. G. Wacker, J. L. Fye and M. F. Jarrold, Nature, 1998, 392, 582 CrossRef CAS
.
- J. C. Grossman and L. Mitas, Phys. Rev. Lett., 1995, 74, 1323 CrossRef CAS
.
- E. Kaxiras and K. A. Jackson, Phys. Rev. Lett., 1993, 71, 727 CrossRef CAS
.
- B. Liu, Z.-Y. Lu, B. Pan, C.-Z. Wang, K.-M. Ho, A. A. Shvartsburg and M. F. Jarrold, J. Chem. Phys., 1998, 109, 9401 CrossRef CAS
.
- J. M. Hunter, J. L. Fye, M. F. Jarrold and J. E. Bower, Phys. Rev. Lett., 1994, 73, 2063 CrossRef CAS
.
- A. A. Shvartsburg, B. Liu, Z.-Y. Lu, C.-Z. Wang, M. F. Jarrold and K.-M. Ho, Phys. Rev. Lett., 1999, 83, 2167 CrossRef CAS
.
- A. A. Shvartsburg and M. F. Jarrold, Phys. Rev. A, 1999, 60, 1235 CrossRef CAS
.
- For a review of melting and freezing in finite systems,
see, R. S. Berry, Microscale Thermophysical Engineering, 1997, 1, 1 Search PubMed
.
- See, for example, M. Schmidt, R. Kusche, B. von Issendorff and H. Haberland, Nature, 1998, 393, 238 CrossRef CAS
.
- A.A. Shvartsburg and M.F. Jarrold, Phys. Rev. Lett., 2000, 85, 2530 CrossRef CAS
.
- A.A. Shvartsburg and M.F. Jarrold, Chem. Phys. Lett., 2000, 317, 615 CrossRef CAS
.
Footnotes |
| † Present address: Department of Chemistry, York University, 4700 Keele Street, Toronto, Ontario, M3J 1P3, Canada. |
| ‡ Present address: Institute for Physical Chemistry, University of Basel, Klingelbergstrasse 80, CH-4056 Basel, Switzerland. |
| This journal is © The Royal Society of Chemistry 2001 |
