Density functional calculations of valence and core photoionization of C6H6 with an exchange-correlation potential with the correct asymptotic behaviour
M. Stener, S. Furlan and P. Decleva
Dipartimento di Scienze Chimiche, Uni![[italic v]](https://www.rsc.org/images/entities/char_e0f5.gif) ersità di Trieste, Via L. Giorgieri 1, I-34127, Trieste, Italy
ersità di Trieste, Via L. Giorgieri 1, I-34127, Trieste, Italy
First published on 5th December 2000
Abstract
The cross section and the asymmetry parameter profiles of C6H6 have been calculated for all the one-electron states, from the outer valence to the core C 1s. The theoretical method is based on the density functional theory, and consists in solving the Kohn–Sham equations for the explicit continuum wavefunction, within a single center basis set of B-splines functions. The employment of the LB94 exchange-correlation potential with the correct asymptotic behaviour gives an improvement of the results with respect to previous calculations. High energy features discovered in a recent experiment have been successfully reproduced by the theory. The core cross section is well reproduced by the theory and the observed features are ascribed to shape resonances and an assignment is proposed.
1. Introduction
In recent years the easier availability of last generation synchrotron radiation sources has renewed interest in photoabsorption and photoemission processes, which now can be studied with more accuracy and detail than with previous conventional sources. The photoelectron spectra, in particular, are strictly related to the electronic structure of the system under study, and therefore the rationalization of the experimental finding often benefits considerably from a clear assessment of the electronic structure of the system. Of course, the photoionization process includes a wide set of phenomenology, so the theory may be asked to answer different questions. For example, in simple cases, a simple ground-state Hartree–Fock (HF) calculation may give a reasonable picture of the photoelectron spectrum, allowing the assignment of the observed peaks to the one-electron molecular orbitals. However, if electron correlation plays an important role, breakdown of the one-electron picture may occur and methods beyond the HF must be used, like, for example, for the description of the satellites in inner valence ionization.In this work we are interested in the following aspects of photoionization: the absolute intensity (cross section) and the angular distribution (asymmetry parameter) for the emitted photoelectrons of the main line peaks in the photoelectron spectrum as functions of the photon energy. The theoretical calculation of these two observables needs explicit evaluation of the unbound photoelectron wavefunction, since the intensity is related to the transition moment between the initial and final state wavefunction, and the latter must describe properly the emitted photoelectron. The asymmetry parameter is related to the unbound wavefunction phase-shifts with respect to the asymptotic solutions. The calculation of the unbound wavefunction for molecules is still far from being a routine task in quantum chemistry, due to the special boundary condition obeyed by such wavefunctions as well as to the basis set requirements, which are different from conventional bound-state calculations.
So far, the most commonly employed methods for calculating such properties on medium-sized systems are the Stieltjes theory (ST) imaging method1 and the continuum multiple scattering method (CMSM).2,3 In the ST approach, the problem of calculating the unbound orbital is actually circumvented, since the cross section is extracted from a discrete variational pseudo-spectrum which can be obtained with conventional well established quantum chemistry methods. The advantages are straightforward implementation and computational economy, and the possibility to include electron correlation in the computational scheme used to produce the discrete spectrum. The disadvantages are the low resolution on the energy scale, which prevents description of sharp or multiple structures, and the total preclusion of calculating the angular distribution. In particular, the low resolution is a very strong limitation, since the importance of the cross section profiles stems mainly from the presence of sharp features like the shape-resonances. The CMSM approach is a full-continuum treatment, but the effective potential employed is built with the muffin-tin (MT) approximation, which is rather crude and has been completely abandoned for bound states calculations. Despite this limitation, the CMSM approach is the only practicable way to study very large systems, and is still widely employed for the description of X-ray absorption spectra.4
A very promising new treatment of the molecular continuum is represented by the Lobatto technique,5–8 which joins the flexibility of localized Gaussian-type orbitals (GTO) with a single-centre expansion whose radial components are developed with Lobatto-shape functions, which are particularly suited to the proper treatment of the continuum boundary conditions. The Lobatto method is very powerful since it allows calculations on rather extended systems, like for example Ni(C5H5)NO9 without drastic approximation of the potential, as in the MT CMSM methods.
In this work we employ the B-spline one-centre expansion (OCE) density functional method,10 which has proven very efficient from small molecules,11,12 up to large systems, like C6013 and M@C60.14,15 This method has been recently updated, by employing the LB94 exchange-correlation potential,16 which displays the correct asymptotic Coulomb behaviour. In fact it has been recently pointed out that the correct asymptotic behaviour of the potential improves the results for some properties which are sensitive to the regions of space at large distances, like for example the cross section itself,17 or the dynamic polarizability18 calculated with the time-dependent version of the theory (TD-DFT). It has been shown17 that for the cross section calculations the LB94 potential in the ground state (GS) configuration is, in general, a better choice than the previously employed Vosko–Wilk–Nusair (VWN)19 potential with the transition state (TS) configuration, which corresponds to half an electron removed from the ionized orbital. The arguments in favour of the LB94-GS choice are essentially two: better accuracy of the results and computational economy. This latter is due to the GS configuration choice, which is obviously the same irrespective of the orbital which is ionized, so that the same Hamiltonian is used in all the calculations with noticeable computational economy.
For this reason in this work we have decided to reconsider the C6H6 molecule with the LB94-GS potential: the profiles have been recalculated and extended to higher photon energy than in the previous study,10 in order to compare with more recent experimental data.20 Moreover, due to the more economic computational scheme, we have explored the ionization of all the orbitals, from the valence to the core C 1s, while in our previous work only the seven uppermost valence levels were considered.10
It is important to underline that in the present method the electronic structure is described in terms of a one-electron picture, according to the Kohn–Sham (KS) DFT approach.21 For this reason the phenomena related to many-body effects, like for example the intensity redistribution from the main line to satellites, cannot be described. However, these effects are not prominent in benzene, and are expected to be really important only for the inner valence ionizations, so we believe that this limitation is not relevant for the present study.
Finally, experimental data are rather complete for C6H620,22–24 so this theoretical study may help give better understanding of the spectroscopic measurements, and from the observed discrepancies some suggestions to improve the present method are gained.
2. Theoretical method
In this work we employ the OCE B-spline DFT method, which has been described in detail previously,10 and therefore here we only sketch the main steps.The basis set consists of a OCE, factorized in a radial set of B-splines and an angular set of real spherical harmonics (Yl,mR). A given function may be expanded, if the basis is complete, according to:
 | (1) |
and the radial expansions Rl,m(r) are actually calculated by means of:
 | (2) |
Rl,m(r) is expanded in one-dimensional B-splines,25 while a further transformation26 adapts the real harmonics to the point group symmetry.
In the Hamiltonian matrix, the kinetic energy and the
nuclear attraction terms are easily calculated, while electron–electron interaction is treated with a KS approach.21 The self-consistent field (SCF) electron density is obtained by a
previous KS-LCAO calculation. The SCF density is then
expanded ![[italic v]](https://www.rsc.org/images/entities/i_char_e0f5.gif) ia eqn. (1) and (2), then the Hartree potential is
computed by solving the Poisson equation. The exchange
correlation potential is a function of the density and its gradient
(LB94),16 so it is calculated from the SCF density and
expanded with eqn. (1) and (2).
ia eqn. (1) and (2), then the Hartree potential is
computed by solving the Poisson equation. The exchange
correlation potential is a function of the density and its gradient
(LB94),16 so it is calculated from the SCF density and
expanded with eqn. (1) and (2).
The bound states are calculated by means of a generalized
diagonalization of the KS Hamiltonian matrix HKS, while the
inverse iteration procedure27 is employed to get the continuum
states. The cross section and the asymmetry parameter
are finally obtained ia dipole transition moments and phase
shifts.3
3. Computational details
The SCF electron density is obtained from the LCAO-ADF program,28,29 employing the LB9416 exchange-correlation potentials and the STO DZP basis set taken from the optimized database included with the ADF package. The SCF procedure is performed with the GS configuration. The OCE calculations are performed with the radial basis set of B-splines of order 10, defined over a radial grid consisting of 100 intervals, up to a radial cutoff Rmax = 22 au, and with the maximum angular momentum LMAX = 30. The centre of the OCE is set on the centre of the molecule. Convergence checks ensure that photoionization profiles reported are convergent with respect to the OCE expansion, as will be shown in the next section. The cross section and asymmetry parameter profiles have been shifted to the experimental thresholds, as is customary in RPA calculations. The experimental geometry is employed in all the calculations.4. Results and discussion
Before analysing the cross section profiles, it is useful to consider the KS eigenvalues of C6H6, obtained with various schemes as reported in Table 1, and compared with the experimental data taken from ref. 22 and 30. We can start the comparison between the LB94 GS eigenvalues obtained with the LCAO ADF program and the experimental ionization potentials. It is well known that the KS eigenvalues cannot be directly compared with ionization potentials, since the latter should rather be calculated with the ΔSCF scheme. A valid alternative often employed in DFT calculations of photoelectron spectra is the TS approach, where the ionization potential is extracted from the eigenvalue of the ionized orbital, from which half an electron has been removed in the electron configuration employed in the calculation. Actually, if the exact KS potential were employed, a theorem states that the first ionization potential (IP) equals the HOMO KS eigenvalue (at GS configuration).31 Of course the exact KS potential is not known, but the present LB94, having the correct asymptotic behaviour, has shown very good agreement between the HOMO IP and the HOMO KS eigenvalue in atoms and small molecules.16 Although this argument strictly holds only for the HOMO, we try to compare all the spectrum with the experimental data. The absolute discrepancies are high for the HOMO (2.4 eV) but decrease on going to the inner states. The most important finding is that the ordering of the states is correct, at variance with the VWN-TS spectrum obtained with the same basis set and reported in Table 1, where the states 1b2u and 2b1u are inverted. This finding is important since this inversion has been pointed out already in Xα calculations,32 and therefore is ascribed to a deficiency of the potential, which is recovered by the more accurate LB94. The large absolute deviations are not important for the present study, since the cross section profiles are shifted to the experimental thresholds.| LB94 GS | ||||||
|---|---|---|---|---|---|---|
| OCE | ||||||
| Orbital | ADF | LMAX = 30 | LMAX = 50 | LMAX = 70 | Exp. IP | ADF VWN TS |
| a Ref. 22.b Ref. 30.c Result of a single, symmetry lowered, calculation to allow core hole localization. | ||||||
| 1e1g | −11.64 | −11.69 | −11.75 | −11.82 | 9.2a | −10.00 |
| 3e2g | −13.13 | −13.06 | −13.13 | −13.16 | 11.5a | −11.84 |
| 1a2u | −14.23 | −14.35 | −14.41 | −14.47 | 12.3a | −12.69 |
| 3e1u | −15.17 | −14.97 | −15.11 | −15.15 | 13.9a | −13.86 |
| 1b2u | −15.70 | −15.70 | −15.77 | −15.80 | 14.8a | −14.97 |
| 2b1u | −16.14 | −15.13 | −15.63 | −15.78 | 15.5a | −14.68 |
| 3a1g | −17.89 | −17.81 | −17.88 | −17.90 | 16.9a | −16.53 |
| 2e2g | −19.63 | −18.22 | −18.94 | −19.14 | 19.2a | −18.47 |
| 2e1u | −23.15 | −20.64 | −21.70 | −22.30 | 22.5a | −22.18 |
| 2a1g | −25.92 | −23.49 | −24.73 | −25.05 | 25.9a | −25.29 |
| 1b1u | −290.55 | −242.40 | −267.45 | −273.90 | 290.38b | −294.40c |
| 1e2g | −290.55 | −244.24 | −268.13 | −274.05 | 290.38b | −294.40c |
| 1e1u | −290.55 | −242.00 | −267.70 | −273.88 | 290.38b | −294.40c |
| 1a1g | −290.55 | −245.04 | −268.22 | −274.01 | 290.38b | −294.40c |
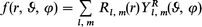
The comparison between the ADF and the OCE results is useful to assess the convergence of the OCE description, since the latter is strongly affected by the maximum angular momentum (LMAX) employed in the calculation. The convergence of the eigenvalues with LMAX is fairly good for the outer valence, with differences lying between 0.1 and 0.2 eV going from LMAX = 30 up to 70. For the inner valence states with C 2s atomic character (2b1u, 2e2g, 2e1u and 2a1g), the convergence is of course slower, owing to the pronounced localization of these states; the differences being less than 1.3 eV going from LMAX = 30 to 50, and less than 0.6 from LMAX = 50 to 70. It is interesting that all the orbitals with C 2s atomic character lie between the core C 1s states and the other outer valence states, with the exceptions of the 2b1u orbital which is pushed above the 3a1g level. For the core C 1s levels, the convergence is very slow, due to the extreme localization of the orbitals, and the eigenvalues decrease by more than 20 eV from LMAX = 30 to 50 and by about 6 eV from LMAX = 50 to 70. From this eigenvalues analysis it seems that only outer valence states are described with reasonable accuracy. However, in our previous work33 we have pointed out that the convergence of the cross section and asymmetry parameter may be much faster than that of the eigenvalues, so we have calculated the cross section and the asymmetry parameter profiles of the 3a1g and 1a1g levels with LMAX = 30, 50 and 70, and the results are reported in Fig. 1. It is quite apparent that the results obtained with LMAX = 30 are already convergent, at least for the purposes of the present work. Very small differences are observed between the results obtained with LMAX = 30 and 50, while the further basis enlargement to LMAX = 70 no longer changes the results appreciably and complete convergence is gained. In practice the largest deviation detected and attributable to the slow OCE convergence is the maximum of the shape resonance in the 3a1g cross section profile, which increases from 12.8 up to 14.2 and 14.5 Mb for LMAX = 30, 50 and 70 respectively.
 | ||
| Fig. 1 The cross section and the asymmetry parameter profiles of the 3a1g and 1a1g orbitals of C6H6: (——) LMAX = 30, (– – –) LMAX = 50, (···) LMAX = 70. | ||
Moreover, the core profiles display the same fast convergence as the valence ones, despite the much worse performances as regards the eigenvalues. For this reason we decided to employ LMAX = 30 in all further calculations, for which we expect the same convergence as found for the 3a1g and 1a1g levels.
Valence photoionization profiles
The cross section and asymmetry parameter profiles relative to the photoionization of the valence orbitals are reported in Fig. 2–6, together with the available experimental data20,22 and the previous calculations with the VWN TS potential.10 In the discussion of the present results we will focus mainly on the performance of the new LB94-GS potential with respect to the experimental results rather than on the interpretation of the observed features. The latter, in fact, have been already considered in detail in previous studies.7,10 However, since the energy range of the present work is wider and new features have been recently found,20 we will consider these novel aspects in a separate section. | ||
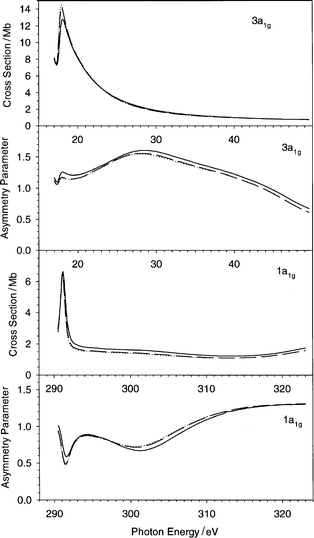
| Fig. 2 The cross section and the asymmetry parameter profiles of the 1e1g and 3e2g orbitals of C6H6: (——) present LB94-GS, (···) previous VWN-TS.10 Experimental data: (○) ref. 22, (♦) ref. 20. | ||
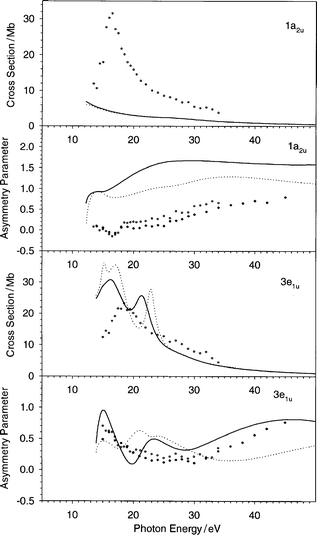 | ||
| Fig. 3 The cross section and the asymmetry parameter profiles of the 1a2u and 3e1u orbitals of C6H6: (——) present LB94-GS, (···) previous VWN-TS.10 Experimental data: (○) ref. 22, (♦) ref. 20. | ||
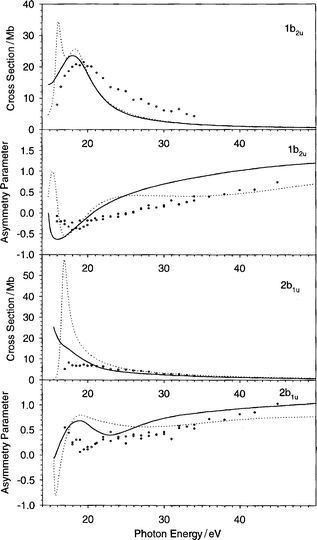 | ||
| Fig. 4 The cross section and the asymmetry parameter profiles of the 1b2u and 2b1u orbitals of C6H6: (——) present LB94-GS, (···) previous VWN-TS.10 Experimental data: (○) ref. 22, (♦) ref. 20. | ||
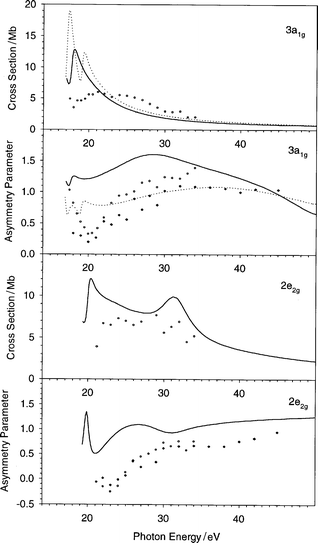 | ||
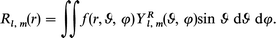
| Fig. 5 The cross section and the asymmetry parameter profiles of the 3a1g and 2e2g orbitals of C6H6: (——) present LB94-GS, (···) previous VWN-TS.10 Experimental data: (○) ref. 22, (♦) ref. 20. | ||
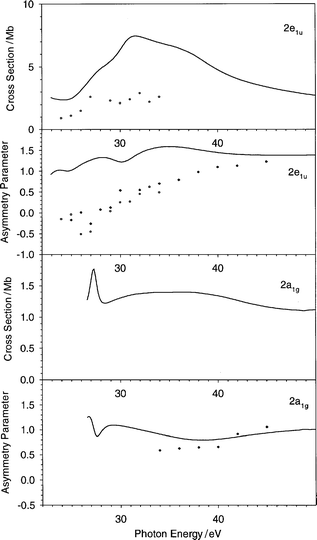 | ||
| Fig. 6 The cross section and the asymmetry parameter profiles of the 2e1u and 2a1g orbitals of C6H6: (——) present LB94-GS, (···) previous VWN-TS.10 Experimental data: (○) ref. 22, (♦) ref. 20. | ||
The cross section of the HOMO orbital 1e1g (Fig. 2) displays better correlation with experiment than the previous VWN-TS result. The difference is actually only significant within 3 eV above the threshold, while at higher energy the two profiles are almost indistinguishable. The observed difference between the two calculations is attributed to the more attractive character of the LB94-GS potential, which brings below the threshold the narrow shape resonance which was present in the VWN-TS calculation. Although the results are slightly improved, the discrepancy with respect to experiment is still important: in the experimental result the shape resonance lies to higher energy by about 6 eV and the profile is broader. It is reasonable to attribute this deviation to neglect of the screening effect due to the response of the system to the external field. In fact these effects can be considered by using TD-DFT:34,35 TD-DFT calculations with LB94-GS potential have recently been performed on N2 and PH3, giving excellent agreement with experiment.36 In particular, it has been observed that the main effect of inclusion of the response in the formalism is to shift the shape-resonances to higher energy with a concomitant broadening of the profile, which is the same discrepancy between the calculated and the experimental cross section observed here.
In contrast to the cross section, the calculated 1e1g asymmetry parameter profile shows a noticeable improvement with respect to the previous VWN-TS calculation: although the shape is very similar the agreement with experiment is now more quantitative, only near the threshold is the theoretical slope still too high. It will be noticed also in the analysis of the further profiles that the asymmetry parameter profile is more sensitive than the cross section to the potential choice, at least for energy higher than a few tens of eV. This is probably due to the fact that the cross section decays rather quickly with the photon energy and therefore the differences soon become too small to be noted.
For the 3e2g orbital, the LB94-GS cross section is too intense near the threshold, and the shape resonance is calculated too sharp, again here it is a typical discrepancy due to neglect of screening. Comparison with the VWN-TS calculation suggests that only a slight shift to lower energy due to the more attractive LB94 potential is actually observed. For the asymmetry parameter, the situation is more interesting, since the potential choice changes the shape of the profile more noticeably, which with the LB94-GS scheme performs better with respect to experiment.
The next orbital is the 1a2u, and for this state the cross section results do not compare favourably with experiment: the measured feature is completely absent since it is shifted below the threshold; the previous VWN-TS calculations gave a very similar low intensity. For the asymmetry parameter the situation is less negative: although the agreement is not quantitative, the shape resembles the experimental data. We are led to assign this deterioration also to screening effects, since these may redistribute the intensity above the threshold. There are a series of reasons which corroborate the attribution of the observed discrepancies between the theory and the experiment to screening effects: first, the screening effects are expected to be important only at low photon energy (few tens of eV), and this is in agreement with the good results obtained with the present method at higher energy (see Fig. 8, later). Moreover, the response of the system should influence the results mainly in the outer valence, in fact as we analyze the one-electron spectrum starting with the HOMO and going to lower levels, the screening effects should become less and less important. This finding is also consistent with the present results, in fact only the three highest orbitals shows important deviations with respect to experiment, while the inner ones perform much better. The next orbital 3e1u is the fourth one and the calculated cross section is in good agreement with experiment, in accord with the previous arguments about the minor importance of screening for the inner states. The previous VWN-TS curve is too intense, and it is interesting that the sharp shape resonance at 23 eV due to the ka2g continuum (compatible at least with angular momentum l = 4) and due to a valence virtual σ*(C–C) molecular orbital,10 is now shifted to lower energy (21 eV) and broader, while the two shape resonances just above the threshold are now unresolved but are calculated at the same position for both the potential choices. The asymmetry parameter profile compares equally favourably with experiment, with a decided improvement with respect to the previous VWN-TS calculation, especially for photon energy higher than 30 eV.
The next orbital 1b2u is in very good agreement with experiment (Fig. 4), both for the cross section and the asymmetry parameter. The LB94-GS potential improves the results in the energy region near the threshold in both curves.
The results concerning the 2b1u orbital are also displayed in Fig. 4. The present theoretical cross section profile is overestimated with respect to experiment in the 5 eV wide region above the threshold, while for higher energies the results match the experiment well. In the VWN-TS curve the overestimate is much larger, and refers to the same region near the threshold. The asymmetry parameter is nicely reproduced by the theory, also here the threshold region is more difficult to describe, but above 23 eV the agreement is good.
The results concerning the 3a1g ionization are reported in Fig. 5: the cross section is too sharp and shifted too near the threshold with respect to experiment. This discrepancy is very similar to that found for the three highest valence orbitals, and is similarly ascribed to screening effects, it is rather curious that this shows up again in this rather inner state. In any case, with the present potential the intensity at the threshold is reduced. The calculated asymmetry parameter reproduces the experimental pattern of the broad maximum around 35 eV, although it is calculated too high and a little shifted towards the threshold.
The next orbitals investigated belong to the inner valence ionizations (2e2g, 2e1u and 2a1g): they are characterized to have high C 2s contribution, this is reflected in the weak and slowly decreasing absolute cross section and in flat asymmetry parameter profiles (Fig. 5 and 6). The comparison with experiment is rather good in general, but it is important to consider that the presence of many satellites in the photoelectron spectrum20 makes this comparison less easy, since the intensity is redistributed over many states which cannot be described at the present level of theory, which is limited to a one-electron model.
We conclude this section by giving a general observation about the valence ionization profiles, which appear to be in good agreement with the experimental data. The most important discrepancies are found for the higher orbitals and have been ascribed to neglect of screening effects in the present computational scheme, apart from possible experimental inaccuracies.
This finding suggests that the efforts to extend the capabilities of the TD-DFT method to more extended systems are meaningful. On the other hand, it is worth noting that screening effects are beyond the single-particle picture, and therefore are less easily rationalized with simplified and straightforward models. For the present case, we are led to consider that the presence of many π electrons may enhance the polarizability due to the high electron mobility.
Unresolved valence photoionization bands
In the previous section the profiles relative to each single orbital have been discussed, and compared with the experimental results. However it must be considered that the experimental photoelectron spectrum of C6H6 is not easily resolved:20,22 apart from the HOMO (1e1g) and the 3a1g main lines, which are completely resolved, two rather large bands are observed: the first derives from the 3e2g + 1a2u ionizations, the second from the 3e1u + 1b2u + 2b1u ionizations. The fact that the bands are unresolved is not a problem of experimental resolution, but rather the result of overlap of very close vibrational structures, whose deconvolution is not easy. For this reason, it is quite reasonable to assume that the experimental data concerning the orbitals included in these two bands may suffer from errors due to an arbitrary deconvolution. Of course these errors are not present if the profiles are summed for all the states which constitute each single band: such results are reported in Fig. 7. The cross section of the first band (3e2g + 1a2u) reflects the problems already present in the individual orbital profiles, and the difference with respect to the previous VWN-TS calculation are important only very near to the threshold. The LB94-GS theoretical asymmetry parameter profile, on the other hand, is in better agreement with the experimental data than the VWN-TS one.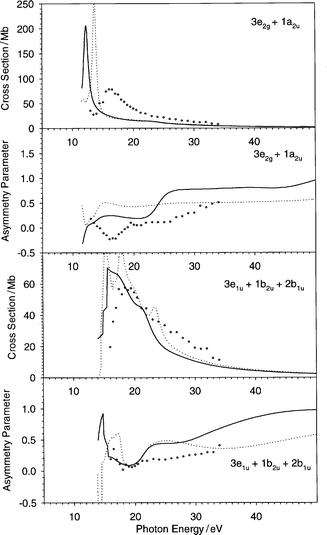 | ||
| Fig. 7 The cross section and the asymmetry parameter profiles relative to the two unresolved bands 3e2g + 1a2u and 3e1u + 1b2u + 2b1u of C6H6: (——) present LB94-GS, (···) previous VWN-TS.10 Experimental data: (○) ref. 22. | ||
The cross section profile of the second band (3e1u + 1b2u + 2b1u) is in very good agreement with experiment, in this case it is also improved with respect to the previous VWN-TS calculation. For the asymmetry parameter, it seems that the region at about 20 eV is properly described, for higher energy values the increasing trend is also properly found, although a little overestimated.
High energy valence photoionization profiles
The theoretical calculations reported up to now on C6H6 are limited to a region lying between the threshold and about 30 eV above it.7,10,22 Since recently new experimental data have been collected up to a photon energy of 120 eV,20 we decided to explore this region also, since the present method is quite general. In Fig. 8 the asymmetry parameter profiles of the valence orbitals are reported, together with the experimental data up to 120 eV on the photon energy scale. It is quite interesting to observe that the agreement between theory and experiment is good, with the only exception being the 1a2u state, which is not correctly reproduced. In fact it is possible to identify three profiles (3e1u, 1b2u and 3a1g) which are heavily structured even at high energy, and the global shapes are correctly reproduced by the theory. For example the experimental 3e1u profile displays a neat increase at about 40 eV, followed by a shallow minimum at about 75 eV and then increases again. In the theoretical profile the minimum at 75 eV is exaggerated, but the global shape is correct and even the energy position of the features is in good agreement with experiment. Interestingly, the structures near the threshold are also correctly reproduced: the sharp maximum followed by a minimum which supports a sketched structure in the experimental measurements have their counterpart in the theoretical profile. For the other two very structured ionizations (1b2u and 3a1g), the agreement is even more quantitative. In fact, in the 1b2u experimental profile the shape consists of a weak minimum at the threshold followed by a very wide waving behaviour, and the calculation reproduces the shape correctly even as it concerns the maximum and minimum energy position, only the amplitudes of the oscillations are slightly overestimated. In the 3a1g ionization, the experimental data give a weak minimum at the threshold, and then a sudden increase followed by another minimum and a wide tail with a second maximum. In this case also the theory furnishes the correct shape, although near the threshold the first maximum is overestimated, as well as the tail after the second maximum which is calculated to decrease too fast.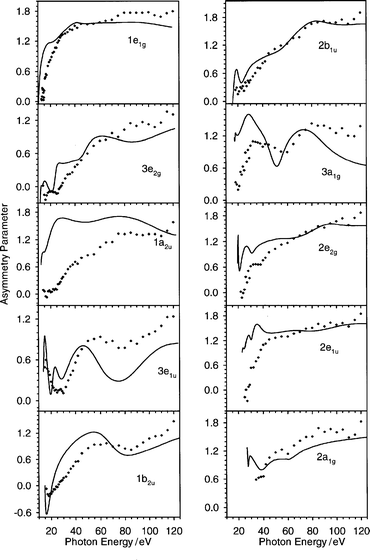 | ||
| Fig. 8 The asymmetry parameter profiles relative to all valence orbitals of C6H6 up to 120 eV in the photon energy scale: (——) present LB94-GS. Experimental data: (♦) ref. 20. | ||
It is worth noting that, apart from these three very structured profiles just discussed, there are some minor features which are present in the asymmetry parameter of the other orbitals and which are correctly reproduced by the theory. In the 1e1g orbital, the experimental data follow an increasing curve, but the slope decreases with two discontinuities at about 30 and 45 eV. The theoretical results are in good agreement with the experimental findings. Further interesting behaviour well predicted by the theory is the slope change at 80 eV found in the 2b1u ionization.
The 1a2u orbital is the only one for which the theory furnishes results which are in disagreement with experiment, and it is reasonable to attribute this deterioration to the fact that the peak is actually unresolved in the photoelectron spectrum, and therefore the experimental data may suffer from a large error due to the arbitrary deconvolution.
The presence of important features at high photon energy values (more than 40 eV) is very interesting, since it is widely believed that the asymmetry parameter profile reaches an asympototic value rather quickly (in a few tens of eV). Such features appear to be well described by the present theoretical approach, indeed a comparison on a wider energy scale reveals much closer agreement than can be expected on the basis of the near-threshold region alone. So it is expected that significant new information can be gained by exploring a wide energy range, now accessible with improved experimental facilities.
However, it is still very difficult to identify a simple physical mechanism which may originate these high energy features. As already pointed out in ref. 20, the resonances observed experimentally in the asymmetry parameter profiles can be ascribed to autoionization resonances or to shape resonances. We can exclude the presence of autoionization processes at high energy because the present calculation would not have found them, since it cannot describe this kind of process, and therefore the observed features must be ascribed to shape resonances. These latter are usually described in terms of excitations to virtual valence orbitals lying above the threshold, whose position on the energy scale may be roughly given by a minimal basis calculation. We performed a minimal basis calculation on C6H6 employing the LB94-GS potential, and the highest valence virtual state is calculated to be only 6.7 eV above the threshold, a value which excludes the presence of such a mechanism as the physical origin for the features at high photon energy. Therefore it is reasonable to attribute the high energy features to spatial anisotropy of the molecular effective potential, which may contain shallow minima and walls, where the continuum states may localize themselves to some extent within a given energy interval. It is worth noting that at high photoelectron energy, it is rather difficult to characterize the continuum states, in fact while for low energy the resonances may be attributed for example to waves with well defined angular momentum, at high energy the continuum is distributed uniformly over a rather wide set of angular momentum contribution, and therefore the physical origin of the resonance is somehow hidden as a result of very many contributions.
Although a precise assessment of these high energy features is still difficult, it is possible at least to identify whether they are connected to the nature of the ionized orbitals. It is quite easy to identify three important patterns in the calculated profiles.
First, the 1e1g and 1a2u profiles do not display important structures at the threshold, they increase rather rapidly within 30 eV and then they keep an almost constant value; this behaviour may be ascribed to the π nature of these orbitals. It is interesting that very similar behaviour has been observed experimentally for both π orbitals of butadiene.37 Moreover, this is actually another argument in favour of the theoretical 1a2u profile with respect to the experiment, this latter probably being affected by deconvolution errors. It is worth noting that this behaviour, typical of π ionizations, has been found also in C6H5Cl, C6H5Br and C6H5I.38–40
Second, the most structured profiles are 3e2g , 3e1u, 1b2u and 3a1g , which are attributed to C–C and C–H σ bonds, with mainly C 2p contribution. The close resemblance of the profiles relative to these ionizations with the corresponding ones in C6H5Cl, C6H5Br and C6H5I has already been pointed out in ref. 38. In butadiene37 the structures are not very evident, but at least the pronounced minimum at low energy is much wider than in the π orbitals. So we are led to attribute the features of C6H6 to the C 2p contribution of σ type.
Third, the remaining orbitals (2b1u, 2e2g, 2e1u and 2a1g) are essentially of C 2s nature, and their asymmetry parameter profiles are less structured. Their C 2s nature is also reflected by the rather low absolute cross section (Fig. 4–6).
In summary, the high energy region, different from what is usually assumed, is rather rich in features, as has already been found experimentally, and these features can be satisfactorily reproduced by the present theoretical model. Moreover, the features seem to be connected to the nature of the orbital with σ C 2p character.
It is important to stress that, at high photon energy, the asymmetry parameter profile is more suitable than the cross section to analyze the features, in fact the cross section falls down rather rapidly with increasing energy and it is difficult to identify tiny structures over a very weak background. However, to overcome this problem, it is possible to analyze the ratio between different profiles: this excludes normalization error and may enhance the features at high energy. This approach has been successfully employed, for example, to identify some oscillations in the ratio between the HOMO and the successive two inner bands in C60 , both in experiment41,42 and in the theory.13 We tried to perform the same analysis on C6H6; so in Fig. 9 the ratio σHOMO/σi is reported, where σHOMO is the HOMO (1e1g) cross section and σi is the cross section of the ith orbital. It is quite apparent that some features are now visible, although the differences are not so neat as for the asymmetry parameter, and therefore the results are not so interesting, for example, to assist in an assignment problem. The most original features are present in the 3a1g and 2a1g ionizations, with satisfactory agreement with experiment. Some oscillations are visible, especially in the theoretical 1a2u profile, but the wavelength is rather high (about 80 eV) so the presence of behaviour similar to C60 would need corroboration by an analysis to even higher photon energy.
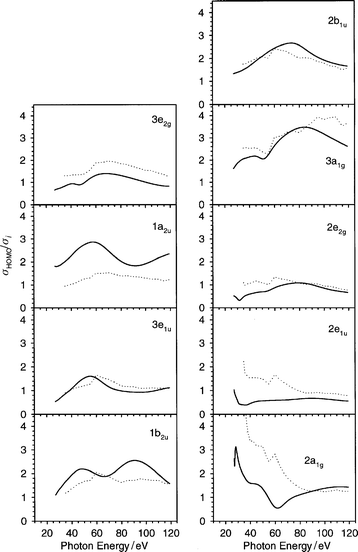 | ||
| Fig. 9 The ratio σHOMO/σi relative to all valence orbitals of C6H6 up to 120 eV in the photon energy scale: (——) present LB94-GS, (···) experimental data ref. 20. | ||
Core ionization
The present C 1s cross section and its partial contributions relative to each initial state are reported in Fig. 10. In Fig. 11 the calculated cross section and asymmetry parameter profiles are compared with recent experimental data.23,24 For the cross section, the agreement with experiment is quite good: the theory gives a sharp maximum near the threshold (291 eV), followed by two broad structures strongly overlapped (at 298 and 303 eV), and by a smooth tail which supports another weak structure at 325 eV. In the experimental data the first structure falls at 293.5 eV,23,43 and the other two are not completely resolved at 299 and 302 eV.24 From Fig. 10 it is clear that the three features may be assigned without ambiguity, in increasing energy order, to the 1a1g, 1e1u and 1e2g initial orbitals respectively, while the 1b1u state is very weak and does not contribute to the shape resonances. The final valence virtual orbitals related to the shape resonances may be obtained according to a minimal basis calculation, performed with the LB94-GS potential, which furnishes the following states with the corresponding eigenvalue: 5e1u − 0.6 eV, 5e2g + 0.6 eV, 1a2g + 3.6 eV and 4b1u + 6.7 eV. With the help of the partial final channel cross section profiles reported in Fig. 12, it is easy to attribute the first sharp resonance to a transition from the 1a1g to the quasi-bound 5e1u state, and the last resonance to the transition from the 1e2g to the quasi-bound 4b1u state. The attribution of the intermediate shape resonance is ambiguous, but from inspection of the partial final continuum contribution of the 1e1u ionization, it is possible to assign the resonance to the a2g channel, and therefore to the 1a2g valence virtual orbital, while the excitation to the 5e2g orbital is responsible only for the weak shoulder on the left-hand side of the resonance. The minimal basis eigenvalues give a realistic description of the quasi-bound valence virtual states, in fact the energy shift between 1a2g and 4b1u final state resonances is 3.1 eV from the minimal basis calculation and about 4 eV from the continuum calculation. It is worth noting that the present attribution differs with respect to a previous one, based on a MS-Xα calculation.43 In the latter only three final symmetries are found to contribute to the shape resonances: e1u, e2g and a2g, with relative intensity 1.54, 0.05 and 0.35 respectively. It is interesting that both present and previous43 calculations assign the first feature to the e1u final symmetry and predict the final a2g to be more intense than e2g. The most important difference between the two calculations is that in the previous one the transition to the final b1u was completely absent, while now it plays a fundamental role in the calculated features. It is not surprising that the present calculation gives a different picture of the virtual orbital spectrum with respect to the MS-Xα results, since the muffin-tin approximation is known to have a strong influence on the valence orbitals, and moreover such high energy states are very sensitive to the asymptotic form of the potential, which is of the correct Coulomb form, and therefore an improved description is expected.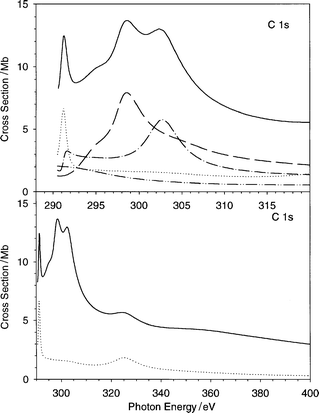 | ||
| Fig. 10 The cross section and the asymmetry parameter profiles relative to the C 1s ionization of C6H6: (——) total C 1s contribution. Partial contributions from different initial states are: (···) 1a1g, (– – –) 1e1u, (–·–·–) 1e2g, (–··–··–) 1b1u. In the lower panel the energy scale is expanded and only the 1a1g contribution is shown. | ||
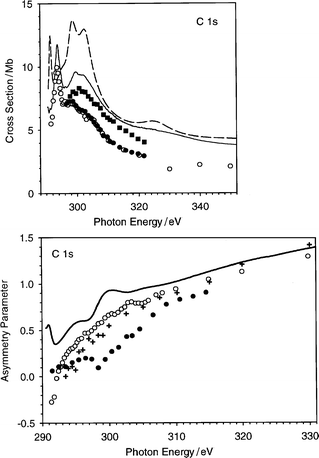 | ||
| Fig. 11 Upper panel: total C 1s cross section in C6H6, (– – –) present calculated profile, (——) absorption experimental data,24 (○) and (●) main line photoemission experimental data,24 (■) main line + satellites photoemission experimental data.24 Lower panel: C 1s asymmetry parameter in C6H6, (——) present calculated profile, (○) main line experimental data,24 (+) main line experimental data,23 (●) satellite experimental data.24 | ||
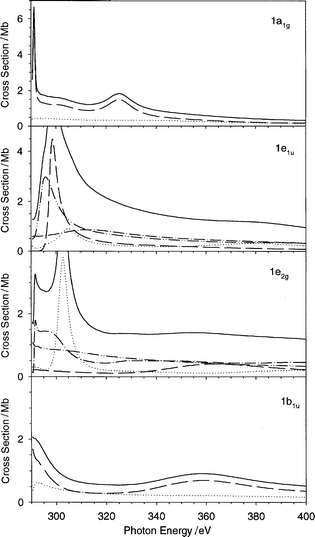 | ||
| Fig. 12 Final partial channel cross section profiles relative to each initial state which contributes to the C 1s ionization of C6H6: (——) total final contribution for each initial state. 1a1g initial state partial final contributions: (···) ka2u, (– – –) ke1u. 1e1u initial state partial final contributions: (···) ka1g, (– – –) ka2g, (–·–·–) ke1g, (–··–··–) ke2g. 1e2g initial state partial final contributions: (···) kb1u, (– – –) kb2u, (–·–·–) ke1u, (–··–··–) ke2u. 1b1u initial state partial final contributions: (···) kb2g, (– – –) ke2g. | ||
The last interesting feature in the cross section is the weak structure at 325 eV, which cannot be related to any valence virtual state, due to its very high energy position. This is in excellent agreement with the experimental observation, as regards both energy position and absolute intensity. Even a second weak feature is apparent around 360 eV. These features are the first terms of a series of EXAFS oscillations, which have been determined experimentally:24 the analysis of the EXAFS signal gave a very good estimate of the C–C bond distance. From Fig. 12 it is possible to attribute the features at 325 and 360 eV to shape resonances of type 1a1g → ke1u and 1b1u → ke2g respectively. It is worth noting that the features related to EXAFS oscillations have been already calculated with the OCE VWN-TS method in N233 and with its LCAO extension in Cl2,44 ClF and ClF3,45 for both Cl 1s and Cl 2p core ionization.
Even the absolute agreement with the absorption data reported in Table 2 is quite satisfactory, although there is a clear overestimate close to the threshold which reduces as the energy increases. This can also be a minor manifestation of the neglect of screening, which tends to redistribute the oscillator strength towards higher energies. On the whole the agreement with the experimental absorption spectrum is very satisfactory. The surprisingly sharp resonance close to the threshold comes out very clearly, as do the following structures. It has to be noted that in the latest experimental study,24 comparison with photoemission spectra led to assignment of the following resonances to two-electron processes giving rise to satellite states. It is not straightforward whether the present theoretical model, which takes into account only the primary hole final states, should be better compared to the photoabsorption (sum of all channels which originate from the primary hole) or to the single-hole photoemission channel. Comparison with experimental data clearly favours the former. What is however clear is that the presently calculated structures are one-electron processes (shape resonances) and are sufficient to give a full reproduction of the experimental features of the absorption spectrum.
| Cross section/Mb | ||
|---|---|---|
| Photon energy/eV | Theory | Experiment |
| 300 | 12.794 | 9.592 |
| 325 | 5.687 | 5.015 |
| 350 | 4.317 | 3.843 |
| 375 | 3.718 | 3.447 |
| 400 | 3.002 | 2.989 |
The C 1s asymmetry parameter profile does not display important features, but is in general good agreement with experiment, apart from the region very near to the threshold, where the experimental data increase regularly and the calculated one is a little bit too high and shows weak structures. These latter are probably the counterpart of the shape-resonances observed in the cross section profile.
5. Conclusions
In this work the LB94-GS exchange correlation potential has been employed to calculate the cross section and the asymmetry parameter profiles of all the possible ionization of C6H6, from outer valence up to the core C 1s. Moreover, the photoelectron kinetic energy range has been explored up to 110 eV, much higher than in previous calculations or experiments which are usually limited to about 30 eV.In the low photoelectron energy region of the valence ionizations, the present results are in better agreement with experiment than previous ones obtained at the VWN-TS level. Some discrepancies which are still present are ascribed to screening effects, which are not considered in the present theoretical scheme but are included in TD-DFT.34,35 The recent OCE implementation of the TD-DFT36 should soon be efficient enough to treat medium-sized systems like C6H6 and therefore to confirm such an hypothesis and cure the present discrepancies.
The high energy region of valence ionization has been calculated for the first time, and the agreement with experiment is quite good, with the only exception being the 1a2u orbital. The latter, however, is not completely resolved in the photoelectron spectrum, and therefore it is not clear if this is a fault of the theory or is due to an arbitrary deconvolution of the unresolved band. The high energy prominent features observed in the experimental asymmetry parameter profiles of some orbitals have been confirmed by the present calculation, this finding is interesting since it is generally believed that the asymmetry parameter should soon reach an asymptotic value. It is difficult to identify a precise physical origin for these features, since they are far away from the expected position of virtual valence orbitals obtained with minimal basis calculation. A comparison with previous experimental data on butadiene and monohalogenobenzenes seems to suggest that the high energy features might be related to σ C–C bonding orbitals with C 2p character.
The cross section of core C 1s ionization is in very good agreement with experimental data, and the experimental features have been ascribed to shape-resonances, with a different assignment with respect to a previous MS-Xα calculation. The first calculated term of the series of EXAFS oscillations has been found to be in excellent agreement with experiment.
In summary the LB94-GS exchange-correlation has proven, up to now, the best choice within DFT to give cross section and asymmetry parameter profiles which are in good accordance with experiment, for both valence and core ionization and over a very wide photoelectron energy range.
Acknowledgements
This work was supported by grants from MURST of Italy and CNR of Rome (Italy). A generous INSTM grant of computer time on the CRAY T3E of CINECA (Bologna) is gratefully acknowledged. The authors are grateful to Prof. M. N. Piancastelli for providing a preprint of ref. 24 and the experimental data files.References
- P. W. Langhoff, in Electron–Molecule and Photon–Molecule Collisions, ed. T. Rescigno, V. McKoy and B. Schneider, Plenum, New York, 1979, p. 183. Search PubMed.
- D. Dill and J. L. Dehmer, J. Chem. Phys., 1974, 61, 692 CrossRef CAS.
- D. Dill and J. L. Dehmer, in Electron–Molecule and Photon–Molecule Collisions, ed. T. Rescigno, V. McKoy and B. Schneider, Plenum, New York, 1979, p. 225. Search PubMed.
- F. W. Kutzler, C. R. Natoli, D. K. Misemer, S. Doniach and K. O. Hodgson, J. Chem. Phys., 1980, 73, 3274 CrossRef CAS.
- L. Ackermann, N. Rösch and A. Görling, J. Phys. B, 1990, 23, 2485 Search PubMed.
- N. Rösch and I. Wilhelmy, Chem. Phys. Lett., 1992, 189, 499 CrossRef.
- I. Wilhelmy, L. Ackermann, A. Görling and N. Rösch, J. Chem. Phys., 1994, 100, 2808 CrossRef CAS.
- I. Wilhelmy and N. Rösch, Chem. Phys., 1994, 185, 317 CrossRef CAS.
- C. N. Field, J. C. Green, M. Mayer, V. A. Nasluzov, N. Rösch and M. Siggel, Inorg. Chem., 1996, 36, 2504 CrossRef CAS.
- M. Venuti, M. Stener and P. Decleva, Chem. Phys., 1998, 234, 95 CrossRef CAS.
- M. Stener and P. Decleva, J. Electron Spectrosc. Relat. Phenom., 1998, 94, 195 CrossRef CAS.
- M. Stener and P. Decleva, J. Electron Spectrosc. Relat. Phenom., 1999, 104, 135 CrossRef CAS.
- M. Venuti, M. Stener, G. De Alti and P. Decleva, J. Chem. Phys., 1999, 111, 4589 CrossRef CAS.
- M. Stener, G. Fronzoni, M. Venuti and P. Decleva, Chem. Phys. Lett., 1999, 309, 129 CrossRef CAS.
- P. Decleva, G. De Alti, G. Fronzoni and M. Stener, J. Phys. B, 1999, 32, 4523 Search PubMed.
- R. Van Leeuwen and E. J. Baerends, Phys. Re. A, 1994, 49, 2412 Search PubMed.
- M. Stener, S. Furlan and P. Decleva, J. Phys. B, 2000, 33, 1081 Search PubMed.
- S. J. A. Van Gisbergen, V. P. Osinga, O. V. Gritsenko, R. Van Leeuwen, J. G. Snijders and E. J. Baerends, J. Chem. Phys., 1996, 105, 3142 CrossRef CAS.
- S. H. Vosko, L. Wilk and M. Nusair, Can. J. Phys., 1980, 58, 1200 CrossRef CAS.
- P. Baltzer, L. Karlsson, B. Wannberg, G. Öhrwall, D. M. P. Holland, M. A. MacDonald, M. A. Hayes and W. Von Niessen, Chem. Phys., 1997, 224, 95 CrossRef CAS.
- R. G. Parr and W. Yang, Density Functional Theory of Atoms and Molecules, Oxford University Press, New York, 1989. Search PubMed.
- T. A. Carlson, P. Gerard, M. Krause, F. A. Grimm and B. P. Pullen, J. Chem. Phys., 1987, 86, 6918 CrossRef CAS.
- M. N. Piancastelli, T. A. Ferrett, D. W. Lindle, L. J. Medhurst, P. A. Heimann, S. H. Liu and D. A. Shirley, J. Chem. Phys., 1989, 90, 3004 CrossRef CAS.
- E. E. Rennie, B. Kempgens, H. M. Köppe, U. Hergenhahn, J. Feldhaus, B. S. Itchkawitz, A. L. D. Kilcoyne, A. Kivimäki, K. Maier, M. N. Piancastelli, M. Polcik, A. Rüdel and A. M. Bradshaw, J. Chem. Phys., 2000, 113, 7362 CrossRef CAS.
- C. de Boor, A Practical Guide to Splines, Springer, Berlin, 1978. Search PubMed.
- P. G. Burke, N. Chandra and F. A. Gianturco, J. Phys. B, 1972, 5, 2212 Search PubMed.
- M. Brosolo and P. Decleva, Chem. Phys., 1992, 159, 185 CrossRef CAS.
- E. J. Baerends, D. E. Ellis and P. Ros, Chem. Phys., 1973, 2, 41 CrossRef CAS.
- C. Fonseca Guerra, J. G. Snijders, G. te Velde and E. J. Baerends, Theor. Chem. Acc., 1998, 99, 391 CrossRef.
- S. A. Holmes and T. D. Thomas, J. Am. Chem. Soc., 1975, 97, 2337 CrossRef CAS.
- M. Levy, J. P. Perdew and V. Sahni, Phys. Re. A, 1984, 30, 2745 Search PubMed.
- G. De Alti, P. Decleva and A. Lisini, Chem. Phys., 1982, 66, 425 CrossRef CAS.
- M. Stener, G. De Alti and P. Decleva, Theor. Chem. Acc., 1999, 101, 247 CrossRef CAS.
- A. Zangwill and P. Soven, Phys. Re. A, 1980, 21, 1561 Search PubMed.
- Z.
H. Levine and P. Soven, Phys. Re. A, 1984, 29, 625 Search PubMed.
- M. Stener and P. Decleva, J. Chem. Phys., 2000, 112, 10871 CrossRef CAS.
- D. M. P. Holland, M. A. MacDonald, M. A. Hayes, P. Baltzer, B. Wannberg, M. Lundqvist, L. Karlsson and W. von Niessen, J. Phys. B, 1996, 29, 3091 Search PubMed.
- A. W. Potts, D. Edvardsson, L. Karlsson, D. M. P. Holland, M. A. MacDonald, M. A. Hayes, R. Maripuu, K. Siegbahn and W. von Niessen, Chem. Phys., 2000, 254, 385 CrossRef CAS.
- D. M. P. Holland, D. Edvardsson, L. Karlsson, R. Maripuu, K. Siegbahn, A. W. Potts and W. von Niessen, Chem. Phys., 2000, 253, 133 CrossRef CAS.
- D. M. P. Holland, D. Edvardsson, L. Karlsson, R. Maripuu, K. Siegbahn, A. W. Potts and W. von Niessen, Chem. Phys., 2000, 252, 257 CrossRef CAS.
- T. Liebsch, O. Plotzke, F. Heiser, U. Hergenhahn, O. Hemmers, R. Wehlitz, J. Viefhaus, B. Langher, S. B. Whitfield and U. Becker, Phys.
Re. A, 1995, 52, 457 Search PubMed.
- P. J. Benning, D. M. Poirier, N. Troullier, J. L. Martins, J. H. Weaver, R. E. Haufler, L. P. F. Chibante and R. E. Smalley, Phys. Re. B, 1991, 44, 1962 Search PubMed.
- J. A. Horsley, J. Stöhr, A. P. Hitchcock, D. C. Newbury, A. L. Johnson and F. Sette, J. Chem. Phys., 1985, 83, 6099 CrossRef CAS.
- G. Fronzoni, M. Stener and P. Decleva, Phys. Chem. Chem. Phys., 1999, 1, 1405 RSC.
- G. Fronzoni, M. Stener and P. Decleva, Chem. Phys., 1999, 246, 127 CrossRef CAS.
| This journal is © the Owner Societies 2001 |