DOI:
10.1039/B008582K
(Paper)
Analyst, 2001,
126, 86-90
Electrochemical titrations of thiosulfate, sulfite,
dichromate and permanganate using dual microband electrodes
Received 24th October 2000, Accepted 7th November 2000
First published on 30th November 2000
Abstract
Applications of titration using dual gold microband electrodes
in generator–collector mode are presented. The main advantage is that
the method dispenses with the need for accurate volume measurements and
reagent preparation: rather than balancing of molar amounts, the fluxes of
analyte and titrant are balanced instead. The titrant is generated
electrochemically and the end-point is detected amperometrically by the
apppearance of a current due to the presence of the titrant at the other
band. The aim is to show the versatility and capability of the method that
employs disposable mass-produced electrodes and uses pulsed motion of the
electrode before a measurement to renew the boundary conditions. The
titration of ascorbic acid (vitamin C) with ferricyanide, which has been a
model system, was extended to the determination of thiosulfate and sulfite
with iodine and the determination of dichromate and permanganate with
iron(II). The accuracy, limited by the present fabrication
reproducibility of the disposable electrodes, is ±10%. The results
demonstrate that the method is effective even with a very simple set-up,
and the actual time needed for common titrations is significantly
decreased. These examples demonstrate a comprehensive basis for further
development and applications, including standard titrations in
industry.
Introduction
In this paper, we show the usability of a simple, inexpensive and rapid
titration method that employs dual microband electrodes in
generator–collector mode. We continue the development presented in
previous papers1–4 and
demonstrate new applications. The main advantage is the lack of separate
titrant solutions, i.e., the method dispenses with the need for
accurate volume measurement and reagent preparation. Instead, the titrant
is electrogenerated and the flux of reactive material is balanced instead
of balancing the molar quantities of the titrant. The microband electrodes
are disposable and user-friendly because there is no need for electrode
polishing or prior calibration if the electrode geometry is known. On the
basis of these examples the method can be easily applied to other
analytical systems.Method
In this titration method a current is applied at the generator electrode
in order to generate the titrant electrochemically, and the collector
potential is kept constant. The potential is chosen to drive a certain
collector electrode reaction, namely the reversed reaction to the generator
electrode reaction. The end-point of the titration is detected
amperometrically. The presence of an analyte is observed as a decreased
current and as a lower collection efficiency:| |  | (1) |
The concentration of the analyte can be determined by using both the
decrease in collection efficiency and the change in shape of the collector
current transient following the application of the generator
current.4 In this paper we concentrate on
the first method.
The principle of the titration and the microband electrode construction
are presented in Scheme 1.
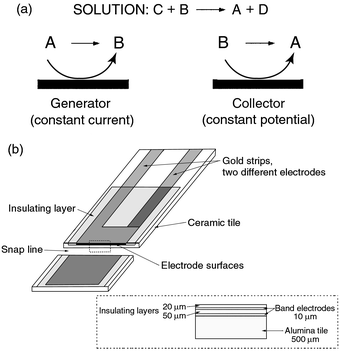 |
| | Scheme 1 (a) Electrochemical titration using dual microband electrodes. B,
titrant; C, analyte. (b) Printed double microband electrode.4 Au electrodes nominally 10 μm × 0.5
cm. | |
It is required that the titration reaction itself is fast. The simplest
case is that both the analyte C and the species D [Scheme 1(a)] produced in
the titration reaction are electrochemically inactive in the potential
range of interest but, as we show here, the method can be applied even if C
and D are electrochemically active. A pulsed movement (vibration) of the
microband electrode before each experiment is employed in order to stir the
solution, to renew the surface conditions at the electrodes and to improve
the reproducibility of the measurements. The pulsed motion of the electrode
when the generator electrode is still off and the electrochemical
measurement when the electrode is stationary leads to reliable mass
transport. The measurements can be carried out on a short enough
time-scale, during which convection does not disturb the signal. The
determination of ascorbic acid (vitamin C) with ferricyanide has been used
as an example earlier4 and the same method
was applied here to the determination of thiosulfate and sulfite with
iodine and the determination of dichromate and permanganate with
iron(II).
Titrations with electrogenerated I2
Titrations of thiosulfate
(S2O32−) and sulfite
(SO32−) with iodine (I2) are
analogous to vitamin C determination [Scheme 1(a)]. 4 Titration
of thiosulfate with iodine is a very common titration reaction in
analytical chemistry,5–7 the
stoichiometry of which is well established. It can be applied to
back-titrations. The determination of sulfite is important, e.g.,
in food analysis, and can be applied to sulfur dioxide
determination.8–10 The
overall reactions for these systems are as follows:6,11–15| | | Generator: 2I−
→ I2 +
2e− E° = +0.294 V
vs. SCE | (2) |
| | | Collector:I2 + 2e−
→ 2I− | (3) |
| | | Solution:I2 +
2S2O32−
→ 2I−
+ S4O62− (thiosulfate)
| (4) |
| | | I2 +
SO32− + H2O →
2I− + SO42− + 2H+
(sulfite) | (5) |
In practice, when an excess of iodide is present in the solution, the
triiodide ion (I3−) is the reactive species
instead of iodine (I2)5,11,16 and the generator–collector reactions and the
actual titration reactions, respectively, change. The pH of the solution in
the range 1–7 has not been observed to affect the redox behaviour of
I−–I3−–I2
systems.11,17Margerum et al.6,12
studied the reaction mechanisms and kinetics of the reactions (4) and (5)
in acidic solution. They reported very fast multi-step mechanisms for both
cases that include short-lived intermediates
I2S2O32− and
IS2O3− for thiosulfate titration and
ISO3− for sulfite titration. The kinetic
parameters of
I−–I3−–I2
−systems have proved to be dependent on the experimental
conditions used.11
Both I− and I2 adsorb on gold electrodes,
but the phenomenon is not expected to affect the reversibility of a
I−–I2 couple,11,17,18 especially when disposable electrodes are
employed. There are also several references19,20,21 reporting the solubility of gold in iodide
solutions, but again this is not expected to cause problems with disposable
electrodes.
Titrations with electrogenerated Fe(II)
Both dichromate and permanganate titrations are widely used in
analytical chemistry.7,10,22
Titration of dichromate (Cr2O72−)
with iron (Fe2+) is similar to the titrations above.
Determination of permanganate (MnO4−) differs
from them because the analyte itself is electroactive in the potential
range of interest. The reactions are as follows:13,22| | | Generator:
Fe3+ + e−
→
Fe2+ E° = +0.437 V vs.
SCE | (6) |
| | | Collector:Fe2+
→
Fe3+ + e− | (7) |
| | | Solution:Cr2O72−
+ 6 Fe2+ + 14H+
→ 2Cr3+ + 6
Fe3+ + 7H2O
(dichromate)
| (8) |
| | | MnO4− +
5Fe2+ + 8H+
→ Mn2+ + 5Fe3+
+ 4H2O
(permanganate) | (9) |
The experimental conditions are important because both chromium and
manganese can be present in several oxidation states. For example, the
formation of MnO2 is prevented by choosing a low pH
value.23The cyclic voltammograms of Fe(III),
Cr2O72− and
MnO4− solutions are presented in Fig. 1. It can be seen that permanganate is reduced
in the potential range where iron is also active, and therefore a more
complex approach is needed. When a constant current is applied at the
generator, both reaction (6) and reduction of permanganate:
| | | MnO4− + 8H+ +
5e−
→ Mn2+ + 4H2O
E° = +1.249 V, E1/2 = +0.943
V vs. SCE | (10) |
take place.
13,23 Similarly, the
current at the collector is the sum of
reactions
(7) and
(10). The reduction
potential of dichromate is more negative than that of permanganate
(
E° = +1.088 V
vs. SCE,
13 in practice
E1/2
≈ +0.500 V
vs. SCE). When a collector potential that is
positive enough is chosen an analogous reaction to
reaction (10) is not observed. Therefore, the
dichromate titration can be carried out in the same way as the ascorbic
acid titration. Both the dichromate titration and the permanganate
titration can be extended to applications where a back-titration is
needed.
![Cyclic voltammograms at freshly snapped gold microband electrodes for
iron(iii) [A, 50 mM
NH4Fe(SO4)2], dichromate (B, 2 mM
Na2Cr2O7) and permanganate (C, 5 mM
KMnO4). Scan rate, 25 mV s−1; supporting
electrolyte, 0.1 M H2SO4.](/image/article/2001/AN/b008582k/b008582k-f1.gif) |
| | Fig. 1 Cyclic voltammograms at freshly snapped gold microband electrodes for
iron(III) [A, 50 mM
NH4Fe(SO4)2], dichromate (B, 2 mM
Na2Cr2O7) and permanganate (C, 5 mM
KMnO4). Scan rate, 25 mV s−1; supporting
electrolyte, 0.1 M H2SO4. | |
Experimental
The screen-printed microband electrodes have been described in detail in
previous papers and are presented in Scheme
1(b).2,4 A new microband was
employed and the fresh electrode surface was exposed before each set of
measurements with a certain analyte concentration. The generator electrode
was the microband next to the alumina tile and the collector electrode was
that adjacent to the outer insulating layer. The reference electrode was a
saturated calomel electrode (SCE), and the counter electrode was a platinum
sheet. The experiments were carried out in an open cell at room
temperature. All the solutions were prepared using water purified using a
Millipore Milli-Q system (18.2 MΩ cm) and all the chemicals were of
analytical-reagent grade (Na2S2O3, Fisons,
Loughborough, UK; Na2SO3, Fisher Scientific,
Loughborough, UK; Na2Cr2O7, Fisons;
KMnO4, BDH, Poole, Dorset, UK). The electrolyte was either KI or
NH4Fe(SO4)2 (both from Sigma-Aldrich,
Gillingham, Dorset, UK), depending on the species to be determined. The
supporting electrolyte in all the measurements was 0.1 M
H2SO4 (pH 1.5) (BDH). The solutions were prepared
immediately prior to the measurements and degassed with argon. In previous
work,4 a hydrophobic spray coating over the
electrodes was used to prevent solution creep up to the contacts. In this
work, it was omitted because of the low pH of the solution, without causing
difficulty. A summary of the experimental conditions and reagents is
presented in Table 1.
Table 1 Experimental conditions and reagents for different analytical systems.
Supporting electrolyte, 0.1 M H2SO4, pH 1.5
| Analyte | Titrant | Electrolyte | Ecoll/V vs.
SCE |
|---|
| Sulfite (SO32−) | I2 | 50 mM KI | 0 |
| Thiosulfate
(S2O32−) | I2 | 50 mM KI | 0 |
| Permanganate (MnO4−) | Fe2+ | 50 mM
NH4Fe(SO4)2 | +0.600 |
| Dichromate
(Cr2O72−) | Fe2+ | 50 mM
NH4Fe(SO4)2 | +0.850 |
For electrochemical measurements, a purpose-built dual
potentiostat–galvanostat (Sycopel Scientific, Washington, Tyne and
Wear, UK) was employed: the assembly drove a constant current to the
generator while the collector potential was kept constant. For each analyte
concentration nine generator currents
|Igen| of 1–9 μA were
applied, starting from the lowest current. For electrode vibrations a
toothed wheel fitted to a stepper motor was used. The electrode was moved
by a push rod between the disc and the electrode holder. The collector
potential was applied just before a movement pulse of the electrode, and
the generator current was applied 1 s after the movement and removed
shortly before the next movement. The collector current
Icoll was measured as a function of time.
Results and discussion
The data were analysed by plotting Icoll
after a particular time (3 s after the generator current pulse) against
Igen. The value of
Igen that is needed to reach a certain
threshold value of Icoll determines the
concentration.Titrations with electrogenerated I2
The experimental collector current transients for thiosulfate titration
as a function of t at fixed Igen are
presented in Fig. 2, and the collector
currents for the same analyte as a function of
Igen at fixed t are shown in Fig. 3. The results are in a good agreement with the
reaction layer model:4 at sufficiently high
generator currents, the curve of the collector current as a function of the
generator current lies parallel to that in the absence of analyte. The
displacement, ΔIgen, of the curve is the
additional flux from the generator that is required to compensate the flux
of the analyte:| | | ΔIgen =
zνΔcCbFlDC
/ΓD,C | (11) |
where z is the charge number for generation of titrant,
ν is the number of moles of titrant to react with 1 mol of
analyte, cCb is the analyte bulk
concentration (species C in Scheme 1),
F is the Faraday constant, l is the length of the band
electrode, DC is the diffusion coefficient of
species C and ΓD,C is the diffusion layer
thickness for the analyte, which may be determined by numerical
simulations.4 In Fig.
4, the generator current required to reach a particular value of
collector current is presented for thiosulfate and sulfite titration. As
eqn. (11) predicts, the results are
straight lines. The displacement of the generator current is proportional
to the number of moles of titrant that is needed to react with 1 mol of
analyte, and therefore the displacements of the curves in the sulfite
titration are twice as high as those in the thiosulfate titration with the
same analyte concentrations. This is due to the different stoichiometries
of reactions (4) and (5): 1 mol of iodine reacts with 2 mol of
thiosulfate [reaction (4)] but 1 mol of
sulfite [reaction (5)]. This leads to a
higher possible analyte concentration to be detected in the thiosulfate
titration and a lower detection limit in sulfite titration. The rates of
both reactions can be assumed to be very fast, and the kinetic differences
can be neglected.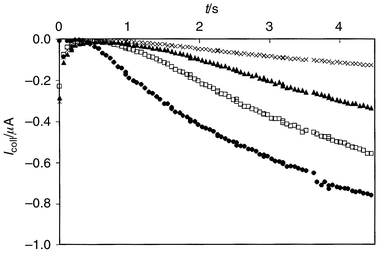 |
| | Fig. 2 Experimental collector current transients with different thiosulfate
concentrations. Generator current applied at t = 0 s,
i.e., 1 s after the movement pulse of the electrode.
Igen = 6 μA;
Ecoll = 0 V vs. SCE; 50 mM KI; 0.1 M
H2SO4: cthiosulfate =
(●) 0, (□) 0.5, (▲) 1.0 and (×) 2.0 mM. | |
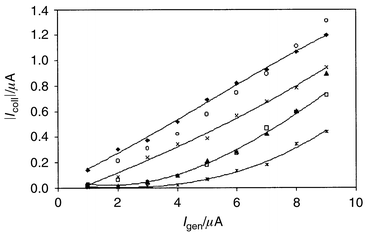 |
| | Fig. 3 Collector current vs. generator current in thiosulfate
titration. Values determined 3 s after generator current was applied.
Ecoll = 0 V vs. SCE; 50 mM KI; 0.1 M
H2SO4; cthiosulfate =
(◆) 0, (○) 0.25, (×) 0.5, (▲) 0.75, (□) 1.0
and (*) 2.0 mM. Mean values from four measurements with different
electrodes for each concentration. | |
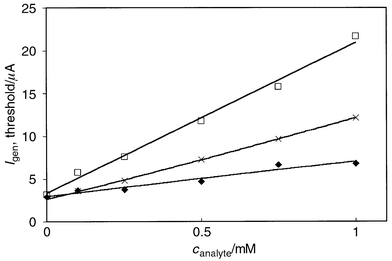 |
| | Fig. 4 Generator current that is required to produce a collector current,
|Icoll|, of 0.4 μA after a
particular time (3 s after the generator current pulse was applied) in
thiosulfate (◆), sulfite (×) and dichromate (□)
titration. Experimental conditions are presented in Table 1. Mean values from four measurements with
different electrodes for each concentration. In the case of
Cr2O72−, Igen
was negative; for higher analyte concentrations (0.75 and 1.0 mM) it was in
the range −10 to −20 μA. | |
Both systems give reliable results with approximately the same relative
standard deviation (typically10%) as reached in the ascorbic acid
titration.4 The variation in the results is
caused by the geometry of the microband electrodes: the electrodes are not
ideally flat and the snapping line near the electrode can distort the
diffusion field. The effect varies from electrode to electrode, and might
be reduced by improvements in manufacturing tolerance. The accuracy could
also be improved by establishing more reproducible experimental conditions,
i.e., identical chemical environments and careful temperature
control, but that would affect the user-friendliness of the method.
Titration with electrogenerated Fe(II)
Dichromate titration.. The calibration curve, i.e., the absolute value of the
generator current required to reach a particular value of collector
current, for the dichromate titration is presented in Fig. 4. The threshold values are relatively high
because of the stoichiometry of reaction
(8): 1 mol of dichromate reacts with 6 mole of Fe(II).
This was also seen as a delay of the collector current after the generator
was switched on at t = 1 s, and the delay increased with the
increasing analyte concentration. Owing to the stoichiometry, the detection
limit is very low. Permanganate titration.. The collector currents with different analyte concentrations in
permanganate titration are given in Fig. 5.
Two different detection methods are compared. In the direct detection
method, no iron is present in the solution and the generator electrode is
completely disconnected. The collector potential is stepped to a value on
the diffusion limit for reaction (10) at t = 0, and only one value
(diffusion limited current) is detected for each concentration. In the
indirect method, the Fe(III) concentration is 50 mM,
i.e., the same as in
Cr2O72− titration, and
Fe(II) (titrant) is generated electrochemically at the generator
electrode. The total current detected at the collector represents the sum
of the oxidation of Fe(II) back to Fe(III) and
reaction (10). In the experimental data the
transients at times 0 ⩽
t
⩽ 1 s, i.e., before the
generator is switched on, are consistent with the transients of the direct
detection method [reaction (10)]. In
Fig. 5, the collector current value for the
indirect method is the difference between the current at the point when
Igen is switched on (t = 1 s) and 3 s
after that. Analogous values are also recorded for the direct method. The
dual microband has the advantage over a simple determination of
permanganate concentration through the limiting current for reaction (10) by providing an additional,
complementary route to check the measurement. The permanganate system
demonstrates the capability of the dual microband system to be used to
measure concentrations of electroactive species accurately and
reproducibly. The method can be applied to other comparable systems.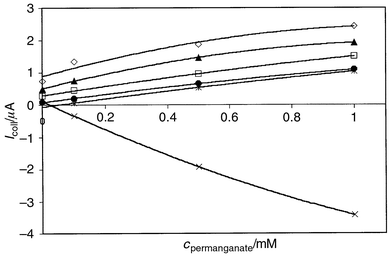 |
| | Fig. 5 Calibration curves for permanganate titration. Direct detection method
(×), i.e., no iron present in the solution and the generator
disconnected. Values recorded 4 s after the movement pulse of the
electrode. Indirect method where Fe(II) electrogenerated:
Igen = (●) −1, (○) −3,
(▲) −6 and (◇) −9 μA. The current value is the
difference between the current at t = 1 s (when the generator
current switched on) and t = 4 s. The current difference in direct
detection, I(t = 4 s) −
I(t = 1
s) for Igen = 0 (*).
Ecoll = +0.6 V vs. SCE. Mean values
from four measurements with different electrodes for each
concentration. | |
Electrode poisoning
Minor deviations in the results can be caused by electrode poisoning.
The same microband electrode was used for the entire set of measurements
with a given analyte concentration (nine scans, currents from 1 to 9
μA). The actual effect of poisoning was studied by performing sets of
measurements where the same solution (iodine present), the same generator
current and the same microband electrode were used for nine scans in a row.
We observed that the currents became smaller when the scans were repeated
but variation in the currents occurred also due to other effects
(e.g., convective effects, noise). The electrode poisoning is most
probably due to adsorbed species, especially I2,16 at the electrode surface. In addition, the
surface structure of a just snapped (fractured) electrode differs from that
of a used or polished electrode.24 Reliable
results are achieved when disposable electrodes are used immediately after
snapping to expose the gold, for a single measurement only, and the results
from the same scans are compared with each other. The reactivity of the
insulating material and its effect on the behaviour of the gold electrodes
could be investigated. After repeated measurements on a given electrode,
darkening of the electrodes or a dark precipitate at the electrode surface
was observed by an optical microscope. This effect originated particularly
at the boundary of electrode material and insulator and may have been due
to an electro-oxidation of lead leached out from the insulator (a
commercial dielectric preparation comprising PbO–SiO2
glass containing barium titanate).Conclusions
We have presented new applications of titrations with dual microband
electrodes. The titration of thiosulfate and sulfite with iodine and the
determination of dichromate and permanganate with iron(II) have
been demonstrated to work reliably within error bars similar to those
observed in previous ascorbic acid measurements. The results showed the
usability of the method in various titration systems, including
determination of an electroactive analyte. The titration can be further
extended to several applications, where at present complicated and
time-consuming analyses are carried out. The errors in the measurements
might be reduced by new electrode fabrication, and electrode poisoning can
be avoided when disposable electrodes are employed. Acknowledgements
This work was supported by EPSRC (H. R.).References
- W. J. Albery, P. N. Bartlett, A. E. G. Cass, D. H. Craston and B. G. D. Haggett, J. Chem. Soc., Faraday Trans. 1, 1986, 82, 1033 RSC.
- D. H. Craston, C. P. Jones, D. E. Williams and N. El-Murr, Talanta, 1991, 38, 17 CrossRef CAS.
- D. E. Williams, K. Ellis, A. Colville, S. J. Dennison, G. Laguillo and J. Larsen, J. Electroanal. Chem., 1997, 432, 159 CrossRef CAS.
- H. Rajantie,
J. Strutwolf and
D. E. Williams,
J. Electroanal. Chem., in the
press. Search PubMed.
- A. I. Vogel, A
Text-book of Quantitative Inorganic Analysis,
Longmans, Harlow, 3rd edn.,
1961, pp. 352–353. Search PubMed.
- W. M. Scheper and D. W. Margerum, Inorg. Chem., 1992, 31, 5466 CrossRef CAS.
- I. M. Kolthoff,
E. B. Sandell,
E. H. Meehan and
S. Bruckenstein,
Quantitative Chemical Analysis, Macmillan,
Toronto, 4th edn., 1969, pp.
816–860. Search PubMed.
- J. T. Stock,
Amperometric Titrations, Interscience,
New York, 1965, pp.
613-620. Search PubMed.
- H. Egan,
R. S. Kirk and
R. Sawyer,
Pearson’s Chemical Analysis of Foods, Longman
Scientific and Technical, Avon, 8th edn.,
1981, pp. 60–66. Search PubMed.
- F. Clowes and
J. B. Coleman, revised
by D. Stockdale and J. Dexter, Quantitative Chemical
Analysis, Churchill, London,
13th edn., 1931, pp.
186–187. Search PubMed.
- P. G. Desideri,
L. Lepri and
D. Heimler, in
Encyclopedia of Electrochemistry of the Elements, ed. A. J.
Bard, Marcel Dekker,New York, 1973, vol. I, pp.
91–153. Search PubMed.
- S. Y. Boudin and D. W. Margerum, Inorg. Chem., 1990, 29, 1559 CrossRef.
- Handbook of Chemistry and Physics, ed. R. C. Weast,
CRC Press, Cleveland, OH, 57th edn.,
1976, Sect. D-141. Search PubMed.
- I. M. Kolthoff and J. Jordan, J. Am Chem Soc., 1953, 75, 1571 CrossRef CAS.
- F. P. Treadwell,
revised by W. T. Hall, Analytical Chemistry, Volume I, Qualitative
Analysis, Wiley, Boston, 7th
edn., 1932, pp.
322–333. Search PubMed.
- P. H. Qi and J. B. Hiskey, Hydrometallurgy, 1993, 32, 161 CrossRef CAS.
- W. Zhang, H. Zha, B. Yao, C. Zhang, X. Zhou and S. Zhong, Talanta, 1998, 46, 711 CrossRef CAS.
- X. Gao and M. J. Weaver, J. Am. Chem. Soc., 1992, 114, 8544 CrossRef CAS.
- P. H. Qi and J. B. Hiskey, Hydrometallurgy, 1991, 27, 47 CrossRef CAS.
- A. Davis, T. Tran and D. R. Young, Hydrometallurgy, 1993, 32, 143 CrossRef CAS.
- T. N. Angelidis, K. A. Kydros and K. A. Matis, Hydrometallurgy, 1992, 34, 49 CrossRef.
- D. Midgley and
K. Torrance,
Potentiometric Water Analysis, Guesham
Press, Old Woking, 1978,
pp. 82–85. Search PubMed.
- C. C. Liang,
Encyclopedia of Electrochemistry of the Elements, ed. A. J.
Bard, Marcel Dekker, New York,
1973, vol. I, pp.
349–403. Search PubMed.
- D. J. Caruana and J. V. Bannister, J. Electroanal. Chem., 1997, 424, 197 CrossRef CAS.
|
| This journal is © The Royal Society of Chemistry 2001 |
Click here to see how this site uses Cookies. View our privacy policy here. 

![Cyclic voltammograms at freshly snapped gold microband electrodes for
iron(iii) [A, 50 mM
NH4Fe(SO4)2], dichromate (B, 2 mM
Na2Cr2O7) and permanganate (C, 5 mM
KMnO4). Scan rate, 25 mV s−1; supporting
electrolyte, 0.1 M H2SO4.](/image/article/2001/AN/b008582k/b008582k-f1.gif)


