High sensitivity microgravimetric biosensor for qualitative and quantitative diagnostic detection of polychlorinated dibenzo-p-dioxins
Xi Chun Zhou*a and Lan Caob
aInstitute of Materials Research and Engineering, 3 Research Link, Singapore, 117602, Republic of Singapore.. E-mail: xc-zhou@imre.org.sg
bDepartment of Chemistry, National University of Singapore, Singapore, 119260, Republic of Singapore
First published on 30th November 2000
Abstract
A piezoelectric immunosensor system was developed for the rapid detection of polychlorinated dibenzo-p-dioxins (PCDDs). The system uses a competitive inhibition enzyme immunoassay (EIA) based on a mouse monoclonal antibody that is specific for 2,3,7,8-tetrachlorodibenzo-p-dioxin (2,3,7,8-TCDD) and a conjugate of a dioxin-like competitor coupled to the enzyme horseradish peroxidase (HRP). The anti-dioxin antibody was deposited on a 10 MHz AT-cut quartz crystal resonator modified with a self-assembly monolayer of dithiobis-N-succinimidyl propionate. PCDDs at different concentrations in the range 0.001–10 ng mL−1 were mixed with a constant amount of HRP-conjugated competitor. The frequency responses due to the adsorption of the mixed samples on the biosensor surface were measured. The results show that 2,3,7,8-TCDD can be quantitatively detected with the developed immunosensor in the concentration range 0.01–1.3 ng mL−1. Cross-reactivities of the biosensor to various PCDD congeners were also investigated. The sensitivity and selectivity of the quartz crystal microbalance (QCM) biosensor is comparable to EIA and ELISA methods in the detection of polychlorinated dibenzo-p-dioxins. The developed QCM immunosensing system offers significant improvements in speed, sample throughout and cost for the qualitative and quantitative detection of PCDDs compared with GC-MS.
Introduction
Polychlorinated dibenzodioxins (PCDDs) and polychlorinated dibenzofurans (PCDFs) are persistent, toxic pollutants which pose a threat both to human health and to the biosphere generally.1,2 PCDDs and PCDFs have been shown to be widespread environmental pollutants, occurring in most human and animal adipose samples, milk, sediment and numerous other matrices.3–8 2,3,7,8-Tetrachlorodibenzo-p-dioxin (TCDD), commonly reported by news media as dioxin, is one member (congener) of the polychlorinated dibenzo-p-dioxin family, of which there are 75 possible congeners whose structures vary according to the number and location of the chlorine atoms. TCDD is known as the most toxic congener. With a view to environmental protection, it has become a matter of high priority to address the issue of detection of these compounds. An important, non-trivial first step is to identify sites of pollution, and on-field monitoring, which requires a simple, economical and rapid test for the detection of the presence of these compounds in samples taken from industrial processing, soils, human and animal tissues and foodstuffs. Because the toxicity varies among the congeners, the analyses for PCDDs require the identification and quantification of each isomer and congener.The present methods for the congener specific analysis of PCDDs or PCDFs typically use high-resolution gas chromatography with ion capture or mass spectrometric detection systems9,10 Although these methods are accurate, there are also very expensive and time consuming because of their reliance on sophisticated analytical instrumentation and skilled operators. Depending on the amount of sample preparation needed, the analysis can take several days to complete. As a result, the screening of large numbers of samples has been limited and supplemental methods are required. Although the regulation of PCDDs and PCDFs differs from country to country, there is common analytical interest in determining the presence and amounts of PCDDs and PCDFs and of their toxic congeners in the environment, and in materials that are potential sources of PCDDs or PCDFs in the environment. Regardless of the laws and rules, the analytical needs are similar: reliable, practical, rapid, cost-effective, field-portable and high-sensitivity methods are needed that can determine PCDDs or PCDFs and their toxic congeners in a variety of matrices.
Immunoassay based analytical methods have demonstrated value for specific, high throughput screening and quantitative analyses of many environmental analytes.11 Moreover, immunoassay can be accomplished with minimal sample preparation and instrumentation. Existing immunoassays for PCDDs or PCDFs are radioimmunoassays (RIAs) and enzyme immunoassays (EIAs) that give varying specificity for the PCDDs and PCDFs.12,13 However, the reported RIAs were time consuming and utilized polyclonal antibodies (PAbs).12 Stanker et al. generated a monoclonal antibody (MAb) to dioxin and developed MAb-based enzyme-linked immunosorbent assay (ELISA) formats.14–17 The selectivity of the ELISA was very similar to that of the RIA. The optimized assay detected 2000 pg per well of 2,3,7,8-TCDD as the IC50 (the analyte concentration giving 50% inhibition).17 Langley et al.18 reported the development of PAb-based ELISAs that detected 1 ng per well of 2,3,7,8-TCDD as the IC50. Recently, Harrison and Carlson developed a tube test and a microplate test system and reported detection limits of 100 and 25 pg per well of 2,3,7,8-TCDD, respectively.19 Sugawara et al. reported an ELISA method for the detection of PCDDs based on polyclonal antibodies.20 Although these results led to increased sensitivity, further improvements are needed to approach the detection limits of GC-MS (⩽1 pg of 2,3,7,8-TCDD in a 1 g sample).
Biosensors are considered to be promising tools for monitoring pollution in the environment.21–23 Biosensors are rapid, cost-effective, field-portable and high-sensitivity instruments. Many biosensing devices including optical, electrochemical and wave acoustic sensors are being developed for the detection of triazine herbicides, represented by atrazine.24–29 The direct and indirect immunochemical system have been investigated to improve the biosensor properties. The indirect immunochemical system uses a variety of labeling approaches to quantity the extent of competitive immunoreaction.
Piezoelectric transducers offer the advantages of a solid-state construction, chemical inertness, durability and ultimately the possibility of low cost mass production. The piezoelectric based quartz crystal microbalance (QCM) is a high-sensitivity sensor for the mass deposited on its surface. In recent years, QCM methods have found wide application in immunoassay.30–32 QCM measures the immunochemical interaction without any chemical labels by monitoring the oscillation frequency change, which is proportional to the analyte concentration. The crystal surface is coated with an immunoadsorbent that selectively interacts with the analyte of interest and subsequent binding increases the mass of the coated crystal with a resulting shift of its fundamental frequency of oscillation. A plethora of methods for antibody immobilization on the crystal surface have been investigated, including physical adsorption of antibodies,33–35 cross-linking,28,36,37 covalent attachment to self-assembled monolayers,38–41 entrapment,28,42,43 and, more recently, the use of antibody–thiol complexes.44 This last technique has also had much success in the analysis of biotin,45 herbicides in drinking water,28 microbes, enzymes,37,43 viruses46,47 and human cells.48
In this paper, we report the development of a highly sensitive QCM biosensors for the detection of PCDDs based on a competitive immunoreaction by measuring the frequency change of a dioxin-like competitor coupled to the enzyme horseradish peroxidase that is introduced to compete for the available binding sites on the immobilized antibody. The principle piezoelectric immunosensor is illustrated in Scheme 1. The determination of polychlorinated dibenzo-p-dioxin (PCDD) at sub-nanomolar concentrations was attempted using such immunosensors. The optimized assay was then used to assess the cross-reactivity by congeners of halogenated dioxins and related structures.
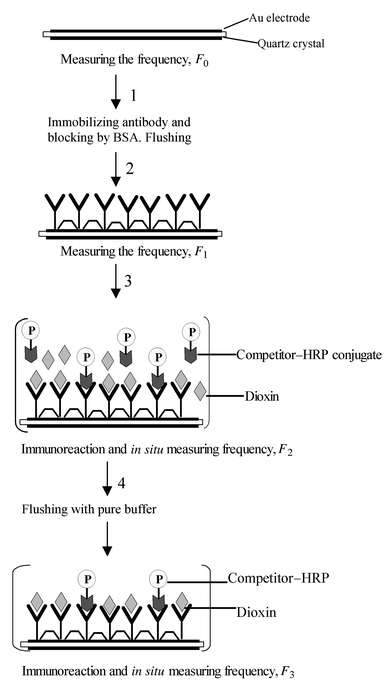 | ||
| Scheme 1 Schematic illustration of the immunosensor preparation and measurement. | ||
Experimental
Chemicals
The standards 2,3,7,8-tetrachlorodibenzo-p-dioxin (2,3,7,8-TCDD), 1,2,3,4-tetrachlorodibenzo-p-dioxin (1,2,3,4-TCDD), 1-chlorodibenzo-p-dioxin (1-CDD), 2,7-dichlorodibenzo-p-dioxin (diCDD), octachlorodibenzo-p-dioxin and 2,3,7-trichlorodibenzo-p-dioxin (2,3,7-triCDD) were purchased from Chem Service (West Chester, PA, USA) and 1,2,3,7,8-pentachlorodibenzo-p-dioxin (PentaCDD) and 1,2,4-trichlorodibenzo-p-dioxin (1,2,4-triCDD) from Cambridge Isotope Laboratories (Andover, MA, USA). Competitor compound (Scheme 2) was synthesized by Friedel–Crafts acylation of the appropriate chlorobenzene followed by isolation of the desired isomer. Horseradish peroxidase (HRP),37,49 bovine serum albumin and Tween 20 were purchased from Sigma Chemical (St. Louis, MO, USA). Dithiobis-N-succinimidyl propionate (DTSP), N-hydroxysuccinimide (NHS) and N-ethyl-N′-[3-(dimethyl)aminopropyl]carbodiimide hydrochloride (EDC) were purchased from Fluka (Buchs, Switzerland) and stored at 4 °C. Other chemicals and reagents were purchased from Fisher Scientific (Pittsburgh, PA, USA) or Aldrich Chemical (Milwaukee, WI, USA). Mouse monoclonal anti-dioxin antibody DD-3 was obtained from the American Type Culture Collection (ATCC) (Rockville, MD, USA).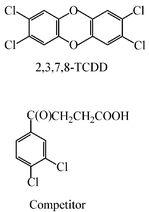 | ||
| Scheme 2 Structures of polychlorinated dibenzo-p-dioxins and competitor used in this study. | ||
Synthesis of HRP-conjugated competitor
Competitor was conjugated to HRP using a carbodiimide-mediated carboxyl activation procedure. A typical procedure for synthesis of the conjugated competitor is as follows. The competitor, calculated to be in a 100-fold molar excess over HRP, was dissolved in 400 μL of dimethylformamide and activated to form the N-hydroxysuccinimide (NHS) ester. The activation was carried out using a 1.4-fold molar excess (calculated over the competitor) of EDC and a twofold molar excess (calculated over the competitor) of NHS added dry to the competitor solution. The HRP protein was dissolved in borate buffer (0.1 M, pH 9.4) to a final concentration of 10 mg mL−1. The HRP solution was stirred overnight at 0–5 °C to ensure that all of the protein was dissolved. Dimethylformamide was added to a concentration of 5% v/v. The activated competitor solution was added to the HRP solution, 10 μL at a time, every 30–60 min, using a 10 μL pipetter. The conjugation mixtures were stirred overnight at room temperature after the competitor solution had been added. The reaction solutions were transferred to wetted cellulose dialysis tubing (Mr cut-off 1200–14000) and dialyzed vs. two changes of 0.5–1.0 L volumes of 10% v/v propan-2-ol in phosphate-buffered saline (PBS) (pH 7.4) over 2 d. The reaction solutions were then dialyzed vs. two changes of 0.5–1.0 L of PBS over 2 d to remove any trace of propan-2-ol. After dialysis, the conjugate solution was collected from the dialysis tubing. The conjugate stock solutions typically had a concentration of 5–10 mg mL−1 HRP, and they were stored at 4 °C.Instrumentation
The quartz crystals employed in this study were commercially available 10 MHz, AT-cut type (diameter 13.67 mm) with Au electrodes (5.1 mm diameter) on both sides, purchased from International Crystal Manufacturing (Oklahoma City, OK, USA). The electrodes from the crystal were connected to a TTL oscillating circuit based on IC 74LS04, similar to that described in the literature.50 The output frequency was measured using a universal counter (Thurlby-Thandar, Cambridge, UK, Model TF830) attached to a personal computer. PZTools (Universal Sensors, USA) was used for measurements, data storage and evaluation). The following equation has been established for an AT-cut shear mode QCM by Sauerbrey:51| Δf = −2 f02(ρqμ q)−1/2Δm/A | (1 ) |
For in situ detection of frequency change, the quartz crystal was fixed vertically between two blocks of Plexiglas of a detection cell in which only one side of the quartz crystal was allowed to contact the aqueous sample solution. The detection cell was set up in a water-bath at constant temperature (32 °C). The frequency response was stable within ±1.0 Hz when contacted with buffer solution.
Electrode conditioning
Gold-disk electrodes were polished with diamond paste down to 1 μm, followed by sonication in a water-bath. The cyclic voltammogram characteristic of a clean gold electrode was recorded at 100 mV s−1 and used to calculate the microscopic area. The electrode was subsequently rinsed with water and acetone and used immediately in the preparation and characterization of the dithiobis-N-succinimidyl propionate (DTSP) monolayer.Immobilization of antibody on quartz
The two sides of the Au electrodes of the QCM were washed with freshly prepared ‘piranha’ solution (3H2SO4·1H2O2) (Caution: this mixture reacts violently with organic materials, and it should not be stored in closed containers) in order to remove organic adsorbate impurities from the gold surfaces. The QCMs were rinsed water purified with a Milli-Q system several times and dried under a nitrogen atmosphere. The cleaned crystals were incubated with 4 mM DTSP in absolute DMSO for 12 h, thoroughly rinsed with absolute ethanol, and allowed to dry. The coupling of DD-3 antibody on the gold surface was then performed in 0.1 mg mL−1 DD-3 in PBS (20 mM, pH 7.4) containing 0.05% Tween 20 (PBST) for another 4 h. After rinsing with distilled water, 3% BSA in PBST was used to block any unreacted spots of DTSP on the gold surface. The crystal was then rinsed with pure buffer. Bare QCM and QCM immobilized without DD-3 antibody but only BSA in the same manner were used for control experiments.Quartz crystal microbalance (QCM) measurements
A PCDDs stock standard solution was prepared in DMSO. The stock standard solutions were serially diluted to concentrations in the range 0.001–10 ng mL−1. A 10 μl volume of the sample solution was mixed with 20 μl of the HRP-conjugated competitor in PBST buffer. QCM measurements were performed with one side of the quartz crystal in contact with 0.5 mL of PBST buffer solution. After stabilization of the fundamental resonance frequency of the quartz crystal, an aliquot of mixture was injected into the solution. The frequency changes in solution due to competitive adsorption of competitor on the surface of the crystal were monitored as a function of time.Buffer solution
PBST was used as the background solution for the sensor measurements.Determination of cross-reactivities
The cross-reactivities (CR) were calculated relative to the concentration producing 50% inhibition (IC50) by PCDDs. The data were obtained from calibration curves for the related compounds and calculated according to the equation| %CR = (IC50 of TCDD)/(IC50 of the cross-reacting compound) × 100 | (2) |
Safety considerations
Extreme caution was exercized to avoid exposure to PCDDs during the assays because the toxicity of the compounds utilized in this study is unknown. When dioxins and related compounds are handled, two pairs of protective gloves should be worn with some water between the two layers to avoid penetration of highly lipophilic compounds. Activated carbon can be used to eliminate PCDD-like substances from waste solutions. UV radiation has been reported to degrade PCDDs and some related compounds and may therefore be useful for cleanup.Results and discussion
Sensing interface preparation and characterization
The application of self-assembled monolayers (SAMs) for protein immobilization on gold surfaces has grown enormously in recent years because they offer a method of orientated, covalent attachment of antibodies to the gold surface that form a densely packed monolayer which should lead to tightly bound layers of protein. The most commonly used SAMs are thiols and sulfides bearing terminal carboxylic acid groups. For immobilization of protein, the formed SAM of thiol was activated with EDC and then NHS. The two-step immobilization method is time consuming and difficult to handle. DTSP is a water insoluble, homobifunctional NHS ester, known as Lomant’s reagent.52 DTSP also can form a self-assembly monolayer on gold surfaces,53 through the disulfide group, so that the terminal succinimidyl groups allow further covalent immobilization of amino-containing biomolecules through acylation of free primary or secondary aliphatic amino groups.54 In this work, we use DTSP for the immobilization of the antibody. The formation of the DTSP self-assembly monolayer was characterized. Fig. 1 shows the cyclic voltammetric characterization of the DTSP modified electrode by soaking of a gold electrode/crystal in a 4 mM solution of DTSP in DMSO. As can be seen in Fig. 1(a), there was a significant decrease in the capacitative current, as would be expected for an electrode covered with a low dielectric layer [Fig. 1(a), solid line]. However, no Faradaic processes were observed over the potential range from 0 to −0.4 V for either the bare or the DTSP modified gold electrode. This result indicates that an adsorbed layer in formed upon immersion of gold/crystal in DTSP solution, and this layer is stable to rinsing with buffer solution. A typical voltammogram shows a well-defined chemically irreversible wave with a peak potential value of –0.74 V [Fig. 1(b), solid line]. On subsequent scans, the peak was essentially absent [Fig. 1(b), dashed line]. This result is consistent with the reductive desorption of a 3-mercaptopropane monolayer from a gold electrode surface as reported by Imabayashi et al.55 The surface coverage calculated by integration of the charge under the voltammetric wave was established to be 1.4 × 10⁻¹⁰ mol cm−2, assuming that the process involves the transfer of two electrons per mole.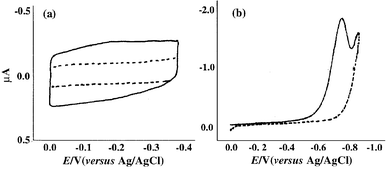 | ||
| Fig. 1 (a) Cyclic voltammogram at 50 mV s−1 of a bare gold electrode and a gold electrode modified with a DTSP monolayer over the potential range from 0.0 to −0.4 V. (b) Linear sweep voltammograms of a gold electrode modified with a DTSP monolayer in 0.1 M phosphate buffer (pH 7.0) over the potential range from 0.0 to −0.90 V. | ||
The immobilization of DD-3 antibody on DTSP modified gold surfaces takes place by nucleophilic attack of primary amino groups of the enzyme on the terminal N-succinimidyl esters in the monolayer. To study the immobilization of the antibody on a DTSP monolayer, a DTSP modified QCM Au crystal was installed in the detection cell with one side of the electrode contacting a thermostated solution (0.5 mL of 20 mM phosphate buffer, pH 7.4) and the frequency was monitored as a function of time. After the temperature and the frequency had stabilized, 5 μL of the antibody stock standard solution (1 μg μL−1) were added to the solution, so that the final antibody concentration was 0.01μg μL−1. After the frequency decrease had reached a steady state, the detection cell was flushed with pure buffer and 0.5 mL of pure buffer was added. A 10 μL volume of 0.05 mg mL−1 BSA solution in PBST was injected into the detection cell to block the non-specific binding sites. Fig. 2 shows the resulting frequency changes as a function of time. As can be seen, on addition of the antibody, the frequency decreased rapidly during the first 5 min and subsequently decreased more slowly until a steady state was reached within 20 min. The frequency change for anti-dioxin antibody adsorption is 128 Hz. Only a small frequency increase (7 Hz) was observed after flushing with buffer solution, indicating that the antibody was covalently bonded on the DTSP monolayer and the co-adsorption of antibody was negligible.
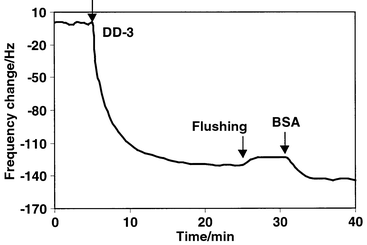 | ||
| Fig. 2 Time dependence of the frequency changes of a DTSP modified quartz crystal resonator in 5.0 mM phosphate buffer solution at 25 °C, on addition of anti-dioxin antibody. | ||
However, the in-solution frequency change (ΔFsol) of antibody immobilization on the DTSP modified Au/crystal cannot be directly transposed to mass change because in the liquid phase the QCM does not necessarily behave as predicted by the Sauerbrey equation51 owing to viscoelastic effects arising from the solvent and the adsorbed layers. In addition, water entrapped within the layers also contributed to the observed in-solution frequency changes. In order to study the immobilized amount of antibody, the antibody adsorption after rinsing with water and drying is recorded. The in-air frequency change (ΔFair) for the antibody immobilization after drying is 58 ± 5 Hz (average ± standard deviation for triplicate experiments). The factor of ∼2 difference between the ΔFsol and ΔFair values can be ascribed to water entrapped within the protein layers. Converting the ΔFair value to a mass using 0.902 ng Hz−1 for the QCM system56 yields 50 ± 5 ng for anti-dioxin antibody immobilized on the QCM. The immobilization procedure shows good reproducibility, the average frequency change due to the adsorption of antibody was 130 Hz and the relative standard deviation was 10%, as indicated in Table 1. After flushing with pure buffer again, the QCM sensor is ready for dioxin analysis.
| No. | Frequency change for antibody/Hz | Frequency change for BSA blocking/Hz |
|---|---|---|
| 1 | 132 | 15 |
| 2 | 119 | 27 |
| 3 | 120 | 20 |
| 4 | 145 | 31 |
| 5 | 122 | 19 |
| 6 | 140 | 22 |
| 7 | 113 | 30 |
| 8 | 142 | 32 |
| 9 | 125 | 21 |
| 10 | 146 | 18 |
| Average ± s | 130 ± 10 | 20 ± 5 |
Calibration graph for PCDD
The Sauerbrey theory is based on the idealized assumption that mass coating of the QCM shows ideal acoustic coupling to the crystal surface and the crystal is an infinite plane. Recent advances in solution sensing indicated that the QCM frequency responses are influenced by many factors, such as mass, effective viscosity, conductivity, dielectric constant, electrode morphology, density and temperature of the liquid and ionic status of a crystal–electrode interface with respect to water–buffer. This indicates the need to characterize the QCM biosensing system with the respective sensing environment. In order to minimize the effect of temperature change on the sensing system, the detection cell was set up in a water-bath at a constant temperature of 32 °C. To facilitate minimization of possible pH changes and viscosity changes due to the addition of sample to the detection cell, 0.02 M PBST buffer was used in all experimental detection procedures. Fig. 3 shows the response profiles of DD-3 antibody coated crystals on addition of pure enzyme HRP and competitor–HRP conjugate to the buffer solution. The frequency response on the addition of 20 μL of enzyme HRP sample (20 μg) to the detection buffer was very small (3–5 Hz) (curve a). This obviously implies that the frequency changes caused by the pH changes and viscosity changes due to the sample addition to the detection cell are negligible. (The volume of sample injected into the detection cell was less than 20 μL in all the experiments). The frequency change caused by the addition of HRP-conjugated competitor, which reached a plateau of 130 Hz, can be attributed to the affinity interaction of the competitor with the specific antibody immobilized on the crystal surface (Fig. 3, curve b).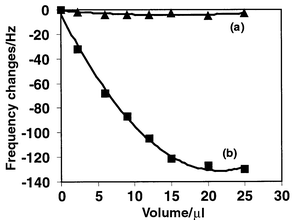 | ||
| Fig. 3 Typical response profiles of the antibody immobilized sensor in the detection cell with 0.5 mL of PBST buffer on addition of 10 mg mL−1 of pure HRP solution (a) and 10 mg mL−1 HRP conjugated competitor solution (b). | ||
The molecular weight of PCDDs is around 300–600, hence the expected frequency change due to the immunological adsorption of PCDDs on the immobilized antibody layer should be much smaller than that obtained for the antibody. In order to detect the dioxin at sub-nanomolar concentrations, a competitive immunoassay was carried out to enhance the frequency change due to the adsorption of larger molecules than the PCDDs. Fig. 4 shows the typical response of a DD-3 immobilized crystal to TCDD–competitor mixtures and the results of control experiments. The immunoreaction can be completed, as shown by a steady-state frequency response that was reached after 10 min. However, the frequency response for the direct detection of dioxin is very small and cannot permit reasonable detection (Fig. 4, curve a). In the competitive immunoreaction system, the frequency change measured is caused by the competitive immunological adsorption of both TCDD and competitor on the sensing interface. The amount of conjugated competitor bound by anti-dioxin antibody is inversely related to the amount of TCDD originally present in the sample. Hence, the observed frequency change is also inversely related to the TCDD concentration. As the HRP-conjugated competitor is a large biomolecule, the frequency response is enhanced (Fig. 4, curves b–d). In order to establish the background response for the biosensor, a series of control experiments were performed by interaction of uncoated crystal and DTSP–BSA coated crystal with the analyte and conjugated competitor, respectively. Fig. 4 (curves e–h) indicate that the non-specific adsorption of TCCD at 10 ng mL−1 to the control crystals is undetectable (<2 ± 2 Hz) and the non-specific adsorption of conjugated competitor on the control crystals is <14 Hz. The level of non-specific adsorption was found to be approximately 10% of the biosensor response. This result suggests that the non-specific adsorption of analytes and conjugated competitor has little effect on the frequency response of the developed immunosensor. Hence the frequency changes in Fig. 4 (curves b–d) testify to be the expected immunoreaction of the analyte and competitor with the immobilized anti-dioxin antibody.
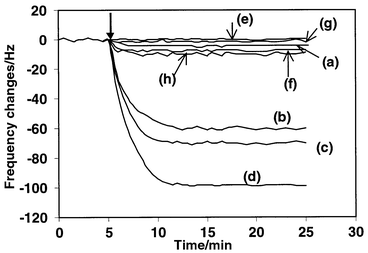 | ||
| Fig. 4 Typical response profiles of the anti-dioxin antibody modified sensor in the detection cell on reaction with (a) 5 μg mL−1 TCDD, (b) 2 μg mL−1 of competitor + 1 ng mL−1 TCDD, (c) 2 μg mL−1 competitor + 0.2 ng mL−1 TCDD and (d) 2 μg mL−1 competitor +0.02 ng mL−1 TCDD. Response of the control crystals: bare Au/crystal in reaction with 5 μg mL−1 TCDD (e) and 2 μg mL−1 of competitor (f); DTSP–BSA modified Au/crystal in reaction with 5 μg mL−1 of TCDD (g) and 2 μg mL−1 of competitor (h). All the concentrations are the final concentration of analyte in the detection cell. | ||
Fig. 5 shows a typical calibration curve for 2,3,7,8-TCDD generated by employing the anti-dioxin antibody modified crystal and HRP conjugated competitor. Each point represents the average value of the measurements of triplicate antibody modified crystals at one concentration. The calibration curve exhibited a typical sigmodial response and a long scale with a response range from 0.001 to 10 ng mL−1. The IC50 of 2,3,7,8-TCDD that produces 50% inhibition is calculated as 0.083 ng mL−1. The limit of detection (LOD) was calculated as 0.008 ng for 2,3,7,8-TCDD with the biosensing system. The definition of LOD used here is the concentration of the frequency shift equal to the frequency shift at zero concentration minus three times the standard deviation of the frequency shift at zero concentration. The quantitative working range of the fabricated biosensor was established between the concentrations producing 15 and 85% frequency shifts, i.e., 0.01–1.3 ng mL−1. The detection limit in this work was comparable to the EIA detection system reported by Harrison and Carlson.19 Compared with EIA techniques, the QCM biosensor is rapid, simple to use and more suitable for performing on-site field analysis.
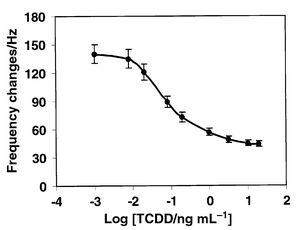 | ||
| Fig. 5 Calibration graph for TCDD. The data represent average values of three signal measurements. The standard deviation is indicated by error bars. | ||
The precision and accuracy for three individual samples at 0.0125, 0.082 and 1 ng of TCDD (mixed with competitor) were tested with 12 crystals modified with antibody (Table 2). The average relative standard deviation (RSD) for TCDD samples of 0.0125, 0.082 and 1 ng were 21, 11 and 8%, respectively. The precision for the spiked samples was improved as the concentration increased. The average recoveries were 78, 106 and 89% for TCDD samples of 0.0125, 0.082 and 1 ng, respectively. As expected, good recoveries were obtained (near 100%) for samples near the IC50. The frequency changes of the biosensor to 0.0125 and 1 ng samples correspond to 85 and 15% of the frequency shift of pure conjugated competitor, respectively. These inhibition levels are at the edge of the portion of the calibration curve used for quantification, and therefore these measurements were less accurate.
Cross-reactivity with various PCDDs
The cross-reactivity of the QCM biosensor was evaluated by using various PCDD congeners. The results of the cross-reactivity study are presented in Table 3. For determination of cross-reactivities, the IC50 of 2,3,7,8-TCDD was assigned a value of 100%, and the cross-reactivities for the other PCDD compounds are reported according to their IC50 relative to this value. The data indicated that PCDD compounds having structures with a 1,2,3,4-substitution pattern showed very low cross-reactivity. However, compounds with three, four or five chlorine atoms in a substitution pattern similar to that of 2,3,7,8-TCDD exhibited relatively high cross-reactivities, such as 1,2,3,7,8-PentCDD (106%) and 2,3,7-TriCDD (34%). Reduction from a congener with three chlorine atoms (2,3,7-TriCDD) to one with two chlorine atoms (2,7-DiCDD) results in a dramatic decrease in cross-reactivity (from 34 to 0.9%).| Compound | Cross-reactivity (%) |
|---|---|
| 2,3,7,8-Tetrachlorodibenzo-p-dioxin | 100 |
| 1,2,3,7,8-Pentachlorodibenzo-p-dioxin | 106 |
| 1,2,3,4-Tetrachlorodibenzo-p-dioxin | 0.5 |
| 1,2,4-Trichlorodibenzo-p-dioxin | 5 |
| 2,3,7-Trichlorodibenzo-p-dioxin | 34 |
| 2,7-Dichlorodibenzo-p-dioxin | 0.9 |
| 1-Chlorodibenzo-p-dioxin | 1 |
| 2-Chlorodibenzo-p-dioxin | 8 |
| Octachlorodibenzo-p-dioxin | 0.03 |
| Dibenzo-p-dioxin | 0.02 |
| Dibenzofuran | 0.01 |
| 2,8-Dichlorodibenzofuran | 6 |
| Dibenzofuran | 0.01 |
Regeneration of sensing interface
Regeneration of the modified sensor interface by dissociating the bound analyte from the antibody-coated sensor indicates the reusability of this biosensor. In this study, both 20 mM glycine–HCl buffer (pH 2.5) and 6 M urea were used to regenerate the QCM biosensor. Typical frequency responses with time for introductions of 1 ng mL−1 of 2,3,7,8-TCDD–competitor sample, glycine–HCl buffer and fresh PBST buffer to the anti-dioxin antibody modified crystal are shown in Fig. 6. The injection of the TCDD–competitor sample causes a frequency decrease of approximately 60 Hz, which is presumably caused by the immunocomplex formation and the effect of the viscosity changes of the buffer. When glycine–HCl buffer solution was introduced, it decreased the frequency further. The frequency decrease rather than increase (due to the dissociation of analyte and competitor from the immunocomplex) on introduction of glycine–HCl buffer solution can be explained by the effect of bulk density and viscosity changes. Effective removal of the bound analyte by glycine–HCl can be observed after PBST washing. After the frequency response had become stable, the regenerated crystal was used to perform another assay for the TCDD–competitor sample. The results indicate that the sensing interface still retained more than 86% activity after four regeneration cycles performed with glycine–HCl buffer (pH 2.5). The recovered activity using 6 M urea was 70% after four regeneration cycles, as shown in Table 4. Obviously, the glycine–HCl buffer (pH 2.5) would be more suitable for the regeneration treatment.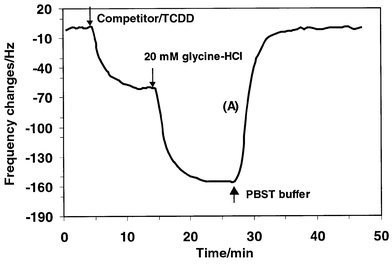 | ||
| Fig. 6 Frequency response of anti-dioxin antibody modified quartz crystal resonator to the presence of 0.02 M PBST buffer containing competitor + 1 ng mL−1 TCDD mixture, glycine–HCl buffer solution (pH 2.5) and 0.02 M PBST fresh buffer. | ||
| Regeneration No | Frequency changea ± s/Hz | Recovered activity (%) | Frequency changeb ± s/Hz | Recovered activity (%) |
|---|---|---|---|---|
| a Regeneration with glycine–HCl buffer (pH 2.5).b Regeneration with 6 M urea. The results are the average values of three measurements. | ||||
| 1 | 98 ± 5 | 100 | 98 ± 5 | 100 |
| 2 | 93 ± 5 | 94 | 90 ± 5 | 91 |
| 3 | 90 ± 4 | 91 | 86 ± 4 | 87 |
| 4 | 88 ± 5 | 89 | 78 ± 5 | 80 |
| 5 | 85 ± 4 | 86 | 69 ± 4 | 70 |
Conclusion
We constructed a QCM immunosensor based on a SAM of DTSP on a gold-plated quartz crystal. An immuno-competitive system was developed to detect quantitatively the PCDDs. The quantitative working range of the fabricated biosensor was between 0.01 and 1.3 ng mL−1 TCDD. The detection limit in this work was comparable to that for the EIA detection system reported by Harrison and Carlson.19 Compared with the EIA techniques, the QCM biosensor is rapid, simple to use and more suitable for performing on-site field analysis. The results of this study suggest that the micro-biosensor array can be used for large-scale sample screening in environmental monitoring.References
- S. Safe and O. Hutzinger, in Polychlorinated Dibenzo-p-dioxins and -furans (PCDDs/PCDFs): Sources and Environmental Imoact, Epidemiology, Mechanisms of Action, Health Risks, ed. S. Safe, O. Hutzinger and T. A. Hill, Environmental Toxin Series 3, Springer, New York, 1990, pp. 1–22. Search PubMed.
- T. Sakurai, J.-G. Kim, N. Suzuki and J. Nakanishi, Chemosphere, 1996, 33, 2007 CrossRef CAS.
- A. Poland and J. C. Knutson, Annu. Rev. Pharmacol. Toxicol., 982, 22, 517 Search PubMed.
- R. D. Kimbrough, H. Falk, P. Stehr and G. Fries, J. Toxicol. Environ. Health, 1984, 14, 47 CrossRef CAS.
- H. Muto and Y. Takizawa, Bull. Environ. Contam. Toxicol., 1992, 49, 701 CrossRef CAS.
- J. P. Giesy, J. P. Ludwig and D. E. Tillitt, Environ. Sci. Toxicol., 1994, 28, 128A Search PubMed.
- C. Rappe, Environ. Sci. Toxicol., 1984, 18, 78A Search PubMed.
- R. J. Kociba and B. Schwetz, Drug Metab. Rev., 1982, 13, 387 CAS.
- USEPA, Method 1613: Tetra Through Octa-Chlorinated Dioxins and Furans by Isotope Dilution HRGC/HPMS, Revision B, USEPA Office of Water Regulations and Standards, Washington, DC, 1994..
- R. E. Clement, Anal. Chem., 1991, 63, 1130A CAS.
- J. P. Sherry, CRC Crit. Rev. Anal. Chem., 1992, 64, 217 Search PubMed.
- P. W. Albro, M. I. Luster, K. Chae, S. K. Chaudhary, G. Clark, L. D. Lawson, J. T. Corbett and J. D. Mckinney, Toxicol. Appl. Pharmacol., 1979, 50, 137 CrossRef CAS.
- S. J. Kennel, C. Jason, P. W. Albro, G. Mason and S. H. Safe, Toxicol. Appl. Pharmacol., 1986, 82, 256 CrossRef CAS.
- L. Stanker, B. Watkins, M. Vanderlaan and W. L. Budde, Chemosphere, 1987, 16, 1635 CrossRef CAS.
- L. Stanker, B. Watkins, N. Rogers and M. Vanderlaan, Toxicology, 1987, 45, 229 CrossRef CAS.
- M. Vanderlaan, L. H. Stanker and B. Watkins, Environ. Toxicol. Chem., 1988, 7, 859 CAS.
- B. E. Watkins, L. H. Stanker and M. Vanderlaan, Chemosphere, 1989, 19, 267 CrossRef.
- M. N. Langley, R. K. Chopra, C. S. Creaser, R. J. K. Taylor, M. D. Rose, J. R. Starlin, H. A. Lee and M. R. A. Morgan, Food Agric. Immunol., 1992, 4, 143 CAS.
- R. O. Harrison and R. E. Carlson, Chemosphere, 1997, 34, 915 CrossRef CAS.
- Y. Sugawara, S. J. Gee, J. R. Sanborn, S. D. Gilman and B. D. Hammock, Anal. Chem., 1998, 70, 1092 CrossRef CAS.
- M. P. Marco, S. Gee and B. D. Hammock, Trends Anal. Chem., 1995, 14, 341 CAS.
- I. Karube, Y. Nomura and Y. Arikawa, Trends Anal. Chem., 1995, 14, 295 CAS.
- K. R. Rogers, Biosens. Bioelectron., 1995, 10, 533 CrossRef CAS.
- M. Minunnni and M. Mascini, Anal. Lett., 1993, 26, 1441.
- A. Brecht, J. Piehler, G. Lang and G. Gauglitz, Anal. Chim. Acta, 1995, 311, 289 CrossRef CAS.
- L. Engel and W. Baumann, Fresenius’ J. Anal. Chem., 1993, 346, 745 CrossRef CAS.
- M. Tommoy, R. L. Baer, D. Spirasolomon and T. P. Doherty, Anal. Chem., 1995, 67, 1510 CrossRef CAS.
- G. G. Guilbault, B. Hock and R. Schmid, Biosens. Bioelectron., 1992, 7, 411 CrossRef CAS.
- C. Steegborn and P. Skladal, Biosens. Bioelectron., 1997, 12, 19 CrossRef CAS.
- R. C. Ebersole and M. D. Ward, J. Am. Chem. Soc., 1988, 110, 8623 CrossRef CAS.
- E. Grabbe and R. Buck, J. Electroanal. Chem., 1987, 223, 67 CrossRef CAS.
- M. Thompson, C. Arthur and G. Dhaliwal, Anal. Chem., 1986, 58, 1206 CrossRef CAS.
- R. M. Carter, M. B. Jacobs, G. J. Lubrano and G. G. Guilbault, Anal. Lett., 1995, 28, 1379 CAS.
- M. Minunni, M. Mascini, R. M. Carter, M. B. Jacobs, G. J. Lubrano and G. G. Guilbault, Anal. Chim. Acta, 1996, 335, 169 CrossRef CAS.
- K. Yun, E. Kobatake, T. Haruyuma, M. Laukkaned, K. Keinanen and M. Aizawa, Anal. Chem., 1998, 70, 260 CrossRef CAS.
- A. Shons, F. Dorman and J. Najarian, J. Biomed. Mater. Res., 1972, 6, 565 CrossRef CAS.
- E. Prusak-Sochaczewski and J. H. Luong, Enzyme Microb. Technol., 1990, 12, 173 CrossRef CAS.
- J. Rickert and A. Brecht, Biosens. Bioelectron., 1997, 12, 567 CrossRef CAS.
- J. Horacek and P. Skladal, Anal. Chim. Acta, 1997, 347, 43 CrossRef CAS.
- S. Storri, T. Santorini, M. Minunni and M. Mascini, Biosens. Bioelectron., 1998, 13, 347 CrossRef CAS.
- R. Vaughan, C. K. O’Sullivan and G. G. Guilbault, Fresenius’ Z. Anal. Chem., 1999, 364, 54 CrossRef.
- C. R. Suri, P. K. Jain and G. C. Mishra, J. Biotechnol., 1995, 39, 27 CrossRef CAS.
- M. Plomer, G. G. Guilbault and B. Hock, Enzyme Microb. Technol., 1992, 14, 230 CrossRef CAS.
- I. S. Park and N. Kim, Biosens. Bioelectron., 1998, 13, 1091 CrossRef CAS.
- M. Másson, K. S. Yun, T. Haruyama, E. Kobatake and M. Aizawa, Anal. Chem., 1995, 67, 2212 CrossRef CAS.
- S. J. Vigmond, M. Jwakura, F. Mizutani and T. Katsura, Langmuir, 1994, 10, 2860 CrossRef CAS.
- F. Alberl, H. Wolf, C. Kösslinger, S. Drost, P. Woias and S. Koch, Sens. Actuators, B, 1994, 18, 271 CrossRef.
- B. König and M. Grätzel, Anal. Chim. Acta, 1995, 309, 19 CrossRef.
- J. R. Sanborn, S. D. Gilman, S. J. Gee, Y. Sugawara, A. D. Jones, J. M. Stotamire, M. S. Denison and B. D. Hammock, J. Agric. Food. Chem., 1998, 46, 2407 CrossRef CAS.
- T. Nomura, M. Watanabe and T. M. West, Anal. Chim. Acta, 1985, 175, 107 CrossRef CAS.
- G. Sauerbrey, Z. Phys., 1959, 155, 206 Search PubMed.
- A. J. Lomant and C. Fairbanks, J. Mol. Biol., 1976, 104, 243 CrossRef CAS.
- E. Katz, J. Electroanal. Chem., 1990, 218, 257 CrossRef.
- P. Wagner, M. Hegner, P. Kernen, F. Zaugg and G. Semenza, Biophys. J., 1996, 70, 2052 Search PubMed.
- S. Imabayasji, D. Hobara and T. Kakiuchi, Langmuir, 1997, 13, 4502 CrossRef.
- X. C. Zhou, S. J. O’Shea and S. F. Y. Li, Chem. Commun., 2000, 953 RSC.
| This journal is © The Royal Society of Chemistry 2001 |
