DOI:
10.1039/B006058P
(Paper)
Analyst, 2001,
126, 104-108
A new fluorimetric method for the determination of
formaldehyde in air based on the liquid droplet sampling technique
Received
26th July 2000
, Accepted 30th October 2000
First published on 19th December 2000
Abstract
A new, simple, sensitive, selective and in-field fluorimetric
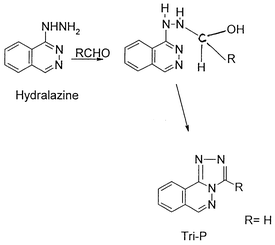
method for the determination of formaldehyde is proposed. The reaction of
formaldehyde with hydralazine in acidic medium, heating on a boiling
water-bath for 25 min, produces
s-triazolo[3,4-a]phthalazine (Tri-P). The fluorescence
intensity of the product formed (Tri-P) was determined at
λem = 389 nm with λex
= 236 nm. The fluorescence intensity is linear over a formaldehyde
concentration range of 1.2–33.0 μg l−1. The
proposed method was applied successfully to the determination of
formaldehyde sampled from the atmosphere using the liquid droplet
technique. Formaldehyde vapour in a wind tunnel was produced by a mean of
permeater. A linear curve was obtained between the concentration in the
wind tunnel and that in the droplet. The detection limit for formaldehyde
was 2.0 μg l−1 with RSDs varying from 3 to 12% in
ambient air, using a droplet correction solution (boric acid and
hydralazine). The effect of interfering substances on the determination
shows that most cations and anions did not interfere. The results obtained
were satisfactory compared with a reference method.
1 Introduction
Formaldehyde is used as a coating, resin and/or adhesive in many
building materials. There are several types of formaldehyde resin mixtures.
Urea–formaldehyde contributes the most to indoor air pollution,
because of its water solubility. Diverse health effects have been
attributed to formaldehyde (CH2O) exposure in residential and
occupational environments. The main indoor sources of CH2O are
wood products, such as medium density fibreboard (MDF) and particleboard.
MDF is used in the manufacture of furniture, cabinets and shelving. The
CH2O mixture used in building materials releases CH2O
vapour into the air. The rate at which the vapour is released depends on
the air temperature and relative humidity. An increase in temperature of
5–6 °C can double the concentration, and an increase in relative
humidity from 30 to 70% can cause a 40% rise in CH2O
concentration. If both the temperature and relative humidity are raised,
the concentration can increase to as much as five times its original level.
Formaldehyde is also known to be an irritant to the eyes, nose and
throat,1 and it has been declared a
suspected carcinogen.2 Therefore, because of
its toxicity and possible carcinogenic properties, many countries have
established an 8 h time average permissible exposure limit for
CH2O ranging from 0.6 to 2.5 mg L−1.3 Moreover, CH2O is now recognized as one
of the most important indoor air pollutants,4 and since people spend about 90% of their time
indoors,5 it is important to determine the
indoor concentration levels to obtain an estimate of personal exposure.
Hence it is of great concern to develop a rapid and sensitive method for
monitoring formaldehyde in indoor air.
Spectrophotometric methods are the most widely used approach.6–8 However, these methods suffer
from a number of interferences and the level of detection is insufficient
to monitor occupational exposure. Gas chromatographic techniques for the
determination of formaldehyde in water have been reported.9 Various devices have been developed for sampling
formaldehyde from ambient air.10–12 Most of these methods are not convenient in
field investigations and especially are not suitable for monitoring
personal exposure.
This paper describes the fluorimetric determination of low levels of
formaldehyde in indoor air using hydralazine as a fluorescent reagent. The
utilization of hydralazine in a spectrofluorimetric method for the
determination of formaldehyde has not been reported previously. The
sensitivity and the limit of detection were improved compared with other
methods.8,9 The droplet method is one
of the gas passive sampling monitoring procedures. A liquid droplet
containing trapping solution is formed at the end of a stainless steel
pipe. Formaldehyde vapour in ambient air diffuses to a growing droplet
solution and is dissolved in it. After a gas-trapping process, the gas
droplet is collected in a vial and analysed by spectrofluorimetry. This
paper describes the parameters such as diameter (od = 40 mm and id = 25
mm), size of the pipe, flow rate of the reagent solution and boiling time
that are needed for the reaction between formaldehyde and hydralazine. The
droplet method was applied to monitor formaldehyde in real indoor samples
with satisfactory results.
2 Experimental
2.1 Apparatus
An RF-1500 spectrofluorimeter (Shimadzu, Japan) was used for recording
the fluorescence intensity. A controlled water-bath was used to maintain
the temperature. A 1 × 1 cm quartz cell was used for recording
spectra and making fluorescence measurements.
2.2 Reagents
All chemicals were of analytical-reagent grade and de-ionized (DI) and
doubly distilled (DD) water was used throughout.
Formaldehyde stock standard solution (10.0 mM).
This was prepared in DI-DD water. Care must be taken while preparing
formaldehyde. Working standard solutions were prepared by further dilution
just before use.
2.3 Calibration
Into a series of boiling test-tubes, a known concentration of
formaldehyde standard solution was added, followed by 0.040 ml of
hydralazine solution. The test-tubes were then placed in a boiling
water-bath for 25 min for completion of the reaction. The test-tubes were
then cooled under tap water and transferred into a 10 ml calibrated flask
and diluted with DI-DD water. The fluorescence intensity was measured at
λex = 236 and λem =
389 nm. The fluorescence intensity was valid over a formaldehyde
concentration range of 1.2–33.0 μg l−1.
Standard concentrations of gaseous formaldehyde in dried and filtered
compressed air were generated by means of a permeater having a constant
rate of formaldehyde release. The sampling time was 60 min. The flow rate
of the formaldehyde gas was varied from 2.8 to 6.2 l min−1
to adjust the air formaldehyde concentrations. The air stream containing
the formaldehyde was equilibrated thermally with glass beads at ambient
laboratory temperature, as measured by thermometer. The gaseous
formaldehyde passed through the tube of the D-10, and the incubation gas
tank temperature was 35 °C. Formaldehyde gas was absorbed from the air
stream in 10–15 ml of (1) 0.080 M boric acid and (2) 0.080 M boric
acid + 0.100 mM hydralazine (1 + 1). The trapped solution was pumped by
means of a PC-5000 pump (Sanuki-koug you, Japan) for droplet making. The
formaldehyde gas stream flowed inside a wind tunnel made from an acrylic
cylinder. The tunnel was used to control and keep the formaldehyde gas
concentration produced by the permeater. The concentration of formaldehyde
generated by the permeater was calculated by the equation C =
KD
× 1000F−1, where C =
CH2O gas concentration (v/v), D = diffusion velocity
(0.38 μg min−1), F = calibrated flow rate of
diluted gas mass (l min−1) and K =
CH2O gas mass converted to gas volume (K = 0.816) . The
droplet device was placed inside the wind tunnel and the formaldehyde gas
was trapped by the trapping solution. The sampling device for making and
collecting formaldehyde is shown in Fig. 1.
Samples were analyzed immediately (within 30 min) to reduce the loss of
formaldehyde prior to the analysis procedure.
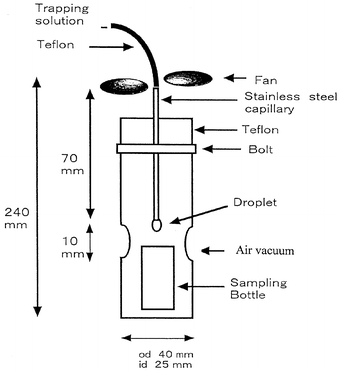 |
| | Fig. 1
Sampling device for the formation of the droplet and for collecting
formaldehyde.
| |
Samples of each of six air concentrations were collected in sets of
five. Each sample in each set was analysed in order to establish the
precision of the sample collected. The actual air concentration of
formaldehyde was calculated on the basis of the known permeation rate of
formaldehyde release.
2.4 Procedure for formaldehyde sampled from air by
the means of liquid droplet method
Two procedures were adopted for the absorption of formaldehyde from air.
Procedure (1): boric acid solution (0.080 M) is used as a trapping
solution; 15 ml were placed in a test-tube and pumped by a means of PC-5000
pump (Sanuki-koug you, Japan) with a flow rate controlled at 0.010 l
min−1. Boric acid was passed through a stainless steel
capillary and a droplet was formed at the tip of the capillary and
collected for analysis for formaldehyde absorbed from air. The formaldehyde
gas concentration in the wind tunnel was adjusted by a mean of permeater
(Castec PD-1B). The standard formaldehyde gas in the wind tunnel was
forcibly circulated with a fan to ensure an equal distribution of the
CH2O gas inside the wind tunnel (Fig.
2). The droplet formed was collected and then treated as described
in the procedure for the formaldehyde calibration curve. Procedure (2):
boric acid (0.080 M)–hydralazine (0.100 mM) was used. The same
procedures were followed as described for procedure (1). The mixed solution
of boric acid and hydralazine was used for droplet correction for the
absorption of CH2O from air.
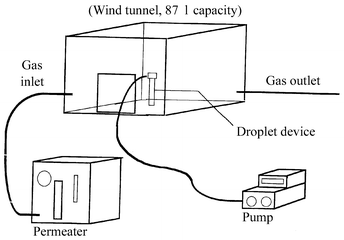 |
| | Fig. 2
Schematic diagram of the wind tunnel and the droplet device.
| |
3 Results and discussion
3.1 Optimization of fluorescence reaction
Analytical procedure.
A 0.1 ml volume of the collected droplet, which contained formaldehyde
(absorbed by both of the trapping solutions), was placed in a test-tube,
followed by the addition of 0.040 ml of hydralazine. The test-tube was
placed in a boiling water-bath for 25 min, cooled and transferred carefully
into a 5 ml calibrated flask and diluted to volume with water. The
concentration of formaldehyde in air collected by the droplet method was
calculated from the following equation:| |  |
(1)
|
where X = concentration of formaldehyde (ppb); F =
fluorescence intensity, C = intercept and B = slope of
the regression equation of the calibration curve, i.e., A =
10.1X + 12.4, and C′ and B′ are the
intercept and the slope of the regression equation obtained between the
concentration of formaldehyde in the wind tunnel and the droplet, i.e.,
A = 10.3X
−68.6.
Fluorescence spectra.
The formation of Tri-P under the optimum experimental conditions, gave a
highly fluorescent compound that exhibits an excitation wavelength at 236
nm and emission wavelength at 389 nm. The fluorescence spectra are shown in
Fig. 3.
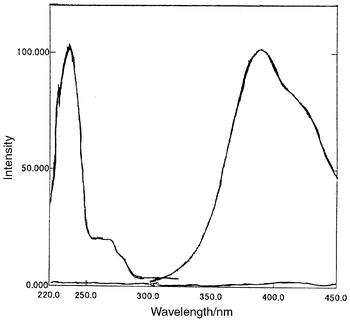 |
| | Fig. 3
Fluorescence intensity of the reaction product Tri-P. Hydralazine, 0.040
ml; formaldehyde, 6.0 μg ml−1;
λex = 236 nm and λem
= 389 nm.
| |
Effect of acid and hydralazine concentration on the
formation of Tri-P.
When hydralazine solution is dissolved in hydrochloric acid, a highly
fluorescent compound is produced. This shows that the formation of Tri-P
depends on the acid, hence 0.1 M HCl was used throughout the experiment.
Hydralazine concentrations in the range 0.0001–0.001 mM were
investigated. The fluorescence intensity was stable from 0.0003 to 0.0006
mM hydralazine. Therefore, 0.04 ml of 0.1 mM hydralazine was adopted.
Effect of temperature.
The effect of temperature on the fluorescence intensity was checked in
the range 50–100 °C. It was observed that 100 °C give the
highest fluorescence intensity and this was adopted in subsequent work.
Effect of reaction time.
The formation of Tri-P was completed within 25 min on a boiling
water-bath. The fluorescence intensity gradually increased with time and
remained constant after 25 min.
Calibration curve.
According to the proposed method, the fluorescence intensity was
proportional to formaldehyde concentration in the range 1.2–33 ppb.
The linear regression equation was A= 10.2X + 12.4, with
a correlation coefficient r2 = 0.9988. The standard
deviation of the calibration curves and the relative error of the intercept
and the slope were found to be 4.7, 3.8 and 0.57, respectively.
The accuracy of the proposed method was tested by the analysis of
standard formaldehyde solution over a period of 15 days (n = 5).
The RSD for formaldehyde concentrations of 5.0, 15 and 25 ppb were 0.65,
0.43 and 0.58%, respectively.
3.2 Optimization of liquid droplet
sampling
Effect of stainless steel valve diameter on droplet
formation.
Different outer diameters of the stainless steel valve were examined. It
was found that an od of 5.0 mm gave better results than with 1.6 and 4.0 mm
od. The results are summarized in Table
1. Moreover, as the stainless steel diameter increased and the
wind velocity increased, the collection of a higher concentration of
CH2O could be achieved. The outer diameter of the valve is an
important factor and the droplet volume is linearly related to the valve
diameter. This is in agreement with Tate’s law.17
Table 1
Effect of stainless steel pipe diameter on the droplet (n =
5)
| Stainless steel od/mm |
| Parameter |
1.6 |
4.0 |
5.0 |
| Trapping reagent volume/ml |
0.024 ± 0.003 (13%) |
0.039 ± 0.003 (8%) |
0.062 ± 0.002 (3%) |
| Trapping time/s |
162 ± 19.0 (12%) |
265 ± 27.0 (10%) |
448 ± 13.0 (3%) |
| CH2O concentration in droplet (ppb) |
60 ± 0.0 |
50 ± 5.0 |
70 ± 0.0 |
Effect of flow rate on absorption of CH2O gas
by the droplet.
The collection efficiency of CH2O using the liquid droplet
method was high. Owing to the higher collection efficiency of the gas phase
when using droplet method, the flow rate of the absorbent solution
(i.e., boric acid and hydralazine) was checked at 0.01, 0.02 and
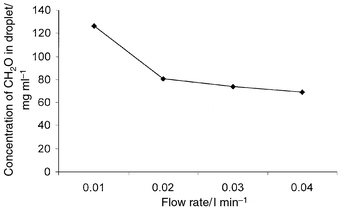
0.03 ml min−1. Fig. 4 shows
the effect of the sample flow rate on the collection of the droplet
containing CH2O. A decrease in CH2O concentration in
the droplet was observed, when the flow rate increased. A flow rate of 0.01
ml min−1 was adopted throughout the experiment, since it
gave the highest CH2O concentration in the droplet. A decrease
in CH2O concentration was observed when the flow rate increased.
This may be attributed to the fact that less CH2O was collected
and hence had an adverse effect on the efficiency of the chromogen and the
signal. Therefore, a change in the signal was observed when the flow rate
changed. A correlation was obtained between CH2O concentration
in the wind tunnel and the droplet.
 |
| | Fig. 4
Effect of flow rate on the concentration of formaldehyde in the droplet
collected from air.
| |
3.3 Determination of formaldehyde in air
Determination of formaldehyde gas sampled from the
atmosphere by the proposed method.
Indoor exposure experiments were performed on-site in a household and a
cupboard. In each case, triplicate sets of sampling devices for droplets
were exposed according to the recommended procedures. The results are
presented in Table 2 and show good
agreement between the droplet method and a reference method.8
Table 2
Concentration of formaldehyde (ppb) in indoor air determined by the
liquid droplet technique and reference method8
| House |
Cupboard |
| |
| Liquid droplet technique |
Reference method |
Liquid droplet technique |
Reference method |
| 8.5 |
9.6 |
100 |
103 |
| 4.9 |
4.8 |
125 |
127 |
| 11.8 |
15.0 |
69.5 |
72.8 |
| 21.0 |
24.4 |
85.5 |
87.3 |
Validation of formaldehyde collection from air.
Two methods for absorbing formaldehyde from air were adopted. The method
with boric acid lacks good linearity and has poor precision. The RSDs for
the formaldehyde absorbed from air by boric acid varied from 6 to 21%. The
regression relation and the correlation coefficient between the
concentration of formaldehyde in the wind tunnel and the concentration of
formaldehyde in droplet were A = 10.5X
− 211
(r2 = 0.797). Therefore, in order to improve the
collection efficiency of the trapping of formaldehyde from air by the
droplet method, boric acid was mixed with hydralazine were for droplet
correction. When boric acid and hydralazine used together, the efficiency
of the method for formaldehyde was enhanced and the precision and accuracy
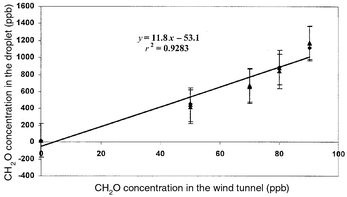
were improved. The RSD varied from 3 to 12%, with a 2 μg
ml−1 detection limit. The regression equation and the
correlation coefficient of linearity between the concentration of
formaldehyde in the wind tunnel and the concentration of formaldehyde in
droplet were A = 11.8X
−53.1
(r2 = 0.9283). The correlation curve is shown in
Fig. 5. The collection efficiency of
formaldehyde by the liquid droplet techniques is >90%.
 |
| | Fig. 5
Correlation between the concentration of formaldehyde in the wind tunnel
and in the liquid droplet.
| |
Conclusion
The liquid droplet method provides a reproducible and accurate collector
for gaseous analytes. The characteristics of the droplet may eliminate
interferences from suspected particles without a special design. The
droplet system is recyclable, renewable, consumes very little reagent and
proceeds in a proper fashion. The main advantage of using a droplet system
is that the measurement of the concentration of the compound in the droplet
and in the atmosphere with appropriate techniques seems to be much simpler
and easier. The droplet gradually increases in size when pumped at a flow
rate of 0.010 ml min−1. The formaldehyde gas was collected
in a bottle and analysed by the proposed method.
The present method is sensitive, selective, simple and consumes a small
amount of reagent, and the reagent itself is of low toxicity and its
properties are well known, which is seldom true for reagents. Most of the
interfering ions and species did not interfere in the determination. The
excellent precision, freedom from pH control and elimination of an
extraction process are major features of the developed method. Moreover,
the limit of detection is also a significant advantage over other methods.
In this study we have demonstrated the utility of the liquid droplet method
for determining formaldehyde gases in indoor samples. The droplet device
can be re-used. The droplet precision and accuracy were enhanced by using
mixed boric acid and hydralazine.
Acknowledgements
The authors are grateful to the Japan Society for the Promotion of
Science (JSPS) for a postdoctoral fellowship (P98448) awarded to Dr Helaleh
and for financial support. This work was partly supported by Grants-in-Aid
(10558085, 10650797) from the Ministry of Education, Science, Sports and
Culture, Japan.
References
-
J. F. Walker,
Formaldehyde, Reinhold, New
York, 3rd edn., 1975. Search PubMed.
- M. P. Munoz, F. J. M. de Villena Ruenda and L. M. P. Diez, Analyst, 1989, 114, 1469 RSC.
-
S. M. Hays,
R. V. Gobbell and
N. R. Gauick,
Indoor Air Quality: Solutions and Strategies,
McGraw-Hill, New York,
1995, pp. 55–70. Search PubMed.
-
Chemical Safety Data Sheets, Royal Society of
Chemistry, Cambridge, 1990,
Vol. 3, pp.
109–114. Search PubMed.
- J. J. Quackenboss, J. D. Spengler, M. S. Kanarek, R. Letz and C. P. Duffy, Environ. Sci. Technol., 1986, 20, 775 CAS.
- E. Sawicki, T. W. Stanley and J. Pfaff, Anal. Chim. Acta, 1963, 28, 156 CrossRef CAS.
- A. P. Altshulter, D. L. Miller and S. F. Slega, Anal. Chem., 1991, 33, 621.
- B. E. Hoogenboom, R. W. Hynes, C. M. Mann, M. Ekman, C. E. McJilton and J. B. Stevens, Am. Ind. Hyg. Assoc. J., 1987, 48, 420 CrossRef CAS.
- S. Velikonja, I. Jarc, L. Zupancic-Kralj and J. Marsel, J. Chromatogr., A, 1995, 704, 449 CrossRef CAS.
- J. D. Mulik, R. G. Lewis and W. A. McClenny, Anal. Chem., 1989, 61, 187 CrossRef CAS.
- R. Otson, P. Fellin, Q. Tran and R. Stoyanoff, Analyst, 1993, 118, 1253 RSC.
-
A. Kettrup,
Analyses of Hazardous Substances in Air,
VCH, New York, 1993,
vol. 2, pp. 111–119. Search PubMed.
- A. Noda, K. Matsuyama, S.-H. Yen, N. Otsuji, S. Iguchi and H. Noda, Chem. Pharm. Bull., 1979, 27, 1939 Search PubMed.
- A. Noda, K. Matsuyama, S.-H. Yen, K. Sogabe, Y. Aso, S. Iguchi and H. Noda, Chem. Pharm. Bull., 1979, 27, 2820 Search PubMed.
- H. Noda, M. Minemoto, A. Noda, K. Matsuyama, S. Iguchi and T. Kohinata, Chem. Pharm. Bull., 1980, 28, 2542 Search PubMed.
- H. Noda, M. Minemoto, A. Noda and T. Ushio, Chem. Pharm. Bull., 1986, 34, 3499 Search PubMed.
- T. Tate, Philos. Mag., 1864, 27, 176 Search PubMed.
|
| This journal is © The Royal Society of Chemistry 2001 |
Click here to see how this site uses Cookies. View our privacy policy here. 


