Vapour sensing using hybrid organic–inorganic nanostructured materials†
Stephen D. Evans*, Simon R. Johnson, Yaling L. Cheng and Tiehan Shen
Department of Physics and Astronomy, University of Leeds, Leeds, UK LS2 9JT, s.d.evans@leeds.ac.uk
First published on UnassignedUnassigned22nd December 1999
Abstract
Small aromatic organothiol derivatives, with the structure HS–C6H4–X, have been used to stabilise gold nanoparticles. The nature of the functional group, X, is important for controlling the relative strength of the particle–particle and particle–solvent interactions and hence in determining the physical properties of these systems (e.g. solubility). Particles were stabilised with different ligands for which X=OH, –COOH, –NH2, and –CH3 and thin films of the particles were formed, by solution evaporation, on microelectrode patterned surfaces. The electronic behaviour indicates that conduction can be understood in terms of an activated electron tunnelling model. Finally, preliminary studies were carried out on the effect of exposure to different chemical vapours on the electronic transport properties.
Introduction
In recent years research into the development of new sensor devices has increased significantly and the diversity of sensor types is now large.1,2 The development of materials for the purpose of chemical vapour sensing has followed two distinct paths based on the use of inorganic or organic materials. The inorganic approaches led to notable successes in the early 1970's, with the development of commercial sensors, based on chemically doped SnO2.3 Whilst still a major competitor in the sensor market the SnO2 approach has several undesirable features. Firstly, these devices usually have high power consumption due to their high temperature operation. In addition inorganic devices tend to have poor chemical specificity.1,2The principal advantage offered by organic materials is the promise for better chemical specificity (and lower power consumption). Early work in this area focused on the development of the highly conjugated phthalocyanine derivatives that showed high sensitivity (ppb) to small amounts of electron donating and accepting species.4 However, poor reproducibility of film formation, water sensitivity and slow response times have led to only limited application of these materials. The advent of conducting polymers (e.g. polypyrroles, polythiophenes) has in contrast led to the development of a number of commercial devices (Aromascan, Bloodhound, Neotronics, Alpha-MOS) based on olfactory mimics.5 These devices rely on processing of information obtained from a number of sensor elements, each of a slightly different chemical composition, which give differing responses to a given analyte. These systems appear to hold much promise but do suffer reproducibility problems due to the effects of water vapour and lack specificity.
In this paper we explore the feasibility of using organo-functionalised metallic nanoparticles for vapour sensing. Such hybrid systems combine organic and inorganic materials and offer a novel approach to vapour sensing. Our interest in these systems arises because of recent developments in the synthesis of surfactant stabilised metallic nanoparticles.6 Our synthetic route for the preparation of the nanoparticles is a modification of that reported by Brust et al. and subsequently Leff et al., and is based on the reduction of AuCl4− to Aun in the presence of an alkylthiol derivative.6,7 The role of the thiol is purportedly to provide a thermodynamic control over the size of nanoparticles, achieved by controlling the ratio of thiol to AuCl4− present at the start of the reduction.
The particle clusters produced are typically between 1.5 and 3 nm in diameter and contain between 103 and 832 Au atoms in the core and 33 to 132 alkylthiols in the ligand shell, respectively. The strong nature of the thiol–Au interaction allows one to modify the ω-functional group of alkylthiols or in our case the para-position of the phenyl ring (Fig. 1). Studies carried out to date have focused on using alkyl derivatives with –CH3 functional groups; this relatively inert moiety reduces particle–particle interaction and leads to the production of stabilised particles which do not aggregate (or agglomerate) and which are soluble in organic solvents. We have recently shown that one is not restricted to using such essentially passive stabilising layers, but that one can introduce different chemical groups, for example azobenzene units, which when taken in conjunction with the properties of the gold nanoparticles will provide materials with interesting new properties.8
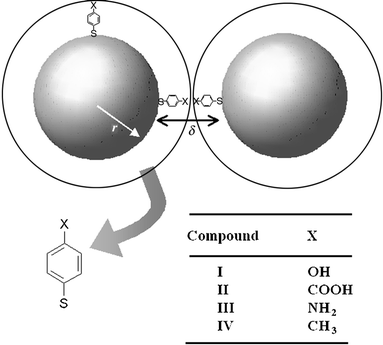 | ||
| Fig. 1 Schematic representation of two surfactant stabilised nanoparticles each of radius r, separated by a dielectric of relative permittivity εr and thickness δ (twice the ligand length). Four different functional ligands were used to stabilise the particles (I–IV). | ||
Electronic conductivity in nanoparticle media
The electronic conductivity in metallic nanoparticle films is affected by the core size, r (radius), the core–core separation, δ, and the relative permittivity, εr, of the dielectric medium between the cores (Fig. 1). The simplest approach for understanding the behaviour in these systems is the classic model suggested by Neugebauer and Webb that contains two contributions to the overall conductivity.9 The first is a tunnelling term associated with electron tunnelling between two metallic cores separated by a dielectric, and the second is an activation energy term which is required for the generation of a positive and a negative charged core from two initially neutral cores. Thus the conductivity can be represented by eqn. (1). | (1) |
The important points to be noted regarding eqn. (1) are:
i) Since β is typically of the order of 1 Å−1 the first term demonstrates that the conductivity is extremely sensitive to the separation of the metallic cores, giving nearly an order of magnitude decrease per Å increase in separation.
ii) The activation energy, Ec, is essentially the Coulomb energy associated with charging two neutral particles and is thus inversely proportional to the relative permittivity of the dielectric media separating the cores and the radius of the cores (with a small correction for the core–core separation).
It is apparent from eqn. (1) that any process that changes either the core–core separation or the permittivity of the medium between the cores will be readily detectable by following changes in the conductivity. In the study presented here we show that this effect can be utilised, using ligand-stabilised nanoparticles, for chemical vapour sensing. The stabilising ligands used here were chosen for two reasons: firstly, they are short and hence should give reasonable conductivities, and secondly, we have control over the nature of the functional group (Fig. 1).
Experimental
Synthesis of organothiol stabilised gold nanoparticles
The gold nanoparticles (samples I–III) were synthesised using a route similar to that proposed by Brust et al.10 in which 20 ml of a clear, colourless, thiol solution (methanol) were added to 20 ml of bright yellow hydrogen tetrachloroaurate solution (99.999%) [HAuCl4·3H2O], at 20![[thin space (1/6-em)]](https://www.rsc.org/images/entities/char_2009.gif) °C. 10 ml of acetic acid were added to this bright yellow solution. Upon addition of 10 ml of a NaBH4 solution (0.891 M) there was an immediate colour change from yellow to black; the mixture was stirred vigorously during the addition. The solution was then left, for three hours at 20
°C. 10 ml of acetic acid were added to this bright yellow solution. Upon addition of 10 ml of a NaBH4 solution (0.891 M) there was an immediate colour change from yellow to black; the mixture was stirred vigorously during the addition. The solution was then left, for three hours at 20![[thin space (1/6-em)]](https://www.rsc.org/images/entities/char_2009.gif) °C, while being continually stirred. Finally, the solvent was evaporated off under a steady stream of N2 and the product was washed three times with diethyl ether and water before being dried under a stream of N2 and on a vacuum line.
°C, while being continually stirred. Finally, the solvent was evaporated off under a steady stream of N2 and the product was washed three times with diethyl ether and water before being dried under a stream of N2 and on a vacuum line.Sample type IV was synthesised using a route described previously.11
Compounds I (HS–C6H4–OH), III (HS–C6H4–NH2), and IV (HS–C6H4–CH3) were obtained from Aldrich and compound II (HS–C6H4–COOH) from Toronto Research Chemicals.
The initial solutions from which the nanoparticles were formed contained gold∶sulfur ratios of 0.55∶1, 0.74∶1, 0.73∶1 and 0.85∶1 for samples I–IV respectively. The nanoparticles formed were soluble in a variety of solvents dependent on the nature of the functional group.
Structural and chemical characterisation
Bright field transmission electron microscopy (TEM) images were obtained using a Philips CM20 TEM operating at 200 kV. Samples were prepared by placing dilute solutions of nanoparticles on 400 mesh carbon coated copper grids and allowing the solvent to evaporate. The images were analysed using a Kontron Electronik Image Analyser (with IBAS software).The composition of the nanoparticles was established using the Scienta ESCA 300 instrument at Daresbury Laboratories, Warrington, UK. A monochromated Al Kα X-ray source, at a power level of 2.8 kW, was used and C 1s, O 1s, Au 4f and S 2p levels were recorded, at an electron take-off angle of 90°. The base pressure in the sample chamber was <10−9 mbar. The analyser slit width and pass energy were 1.9 mm and 150 eV respectively and the system was calibrated with respect to the Ag 3d peak from a standard sample.
Thin film formation and electrical characterisation
Conductivity measurements were made on nanoparticle films, formed via solvent evaporation, on an interdigitated electrode arrangement. The electrode structures were fabricated using photolithographic techniques and consisted of 20 finger pairs, each finger being 120 μm wide by 3600 μm long and separated by 120 μm. Continuous nanoparticle films with thicknesses greater than the electrode depth, but less than the electrode separation, were formed via deposition from solution. The thicknesses of the films were evaluated using atomic force microscopy (Topometrix Explorer) by obtaining thickness profiles, at the edge of the cast films. Film uniformity was obtained from large area scans. The current–voltage (I–V) characteristics, for each film type, were obtained as a function of temperature between 100 and 250 K. The temperature was set using an Oxford Instruments ITC503 controller in conjunction with a cryostat and the samples were allowed to stabilise for five minutes at each temperature prior to any measurements being made.Chemical vapour sensing
The electrical response upon exposure to vapour was monitored using the dynamic flow arrangement shown schematically in Fig. 2.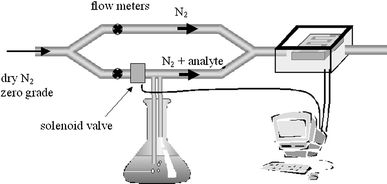 | ||
| Fig. 2 Experimental set-up for measuring the electrical response of films upon exposure to analytes in a carrier gas. The flow meters were used to control the flow rate in each of the arms. | ||
Zero grade nitrogen (BOC) was used as a ‘carrier' gas and the flow was divided and sent through two arms of the apparatus. The flow rate in each arm was independently set, between 0.1–1.2 L min−1, using adjustable flow meters (RS supplies). In one arm the N2 was bubbled through the solvent under investigation. This arm contained a solenoid valve, which could be opened or closed to allow control of analyte flow to the sample compartment. All measurements were carried out at room temperature (22 ± 0.1![[thin space (1/6-em)]](https://www.rsc.org/images/entities/char_2009.gif) °C) and the samples were allowed to equilibrate under an atmosphere of dry nitrogen for 900 s before any readings were taken. The d.c. sample response was obtained by measuring the current, at a fixed voltage, during an exposure–recovery cycle. The current measurement and control over the solenoid valves were performed using a computer-interfaced electrometer and an IEEE card.
°C) and the samples were allowed to equilibrate under an atmosphere of dry nitrogen for 900 s before any readings were taken. The d.c. sample response was obtained by measuring the current, at a fixed voltage, during an exposure–recovery cycle. The current measurement and control over the solenoid valves were performed using a computer-interfaced electrometer and an IEEE card.
The typical protocol followed for determining the response to the analytes was as follows: current readings were collected for 900 s, with ‘dry' nitrogen flowing (0.6 L min−1) through the sample chamber, to serve as a baseline. This was followed by a 600 s exposure to analyte, at a controlled flow rate. Following the cessation of analyte flow (by closing the solenoid valve) current readings were then taken for a further 900 s to monitor the recovery of the sample. During this time ‘dry' nitrogen was passed through the compartment.
Ellipsometry
A single wavelength (632.8 nm) Beaglehole picometer ellipsometer was used to follow changes in the optical parameters of the films, as a function of the partial pressure of the analyte vapour. The partial pressure was determined using a capacitance manometer and the initial background pressure prior to the introduction of analyte was ∼10−6 mbar.Results and discussion
Nanoparticle structure
Surfactant stabilised nanoparticles were produced in accordance with the scheme provided in the experimental details. The structural properties of these particles have been studied in detail and show that particles of relatively low dispersity were formed.12 However, although the ratio of gold to thiol groups used in the synthesis was similar in all cases, the amine functionalised particles (diameter ∼6 nm) were approximately twice as large as the other particles (∼3 nm), Table 1. Particles stabilised with compounds I, II and IV displayed good solubility in a range of solvents, either polar or non-polar, dependent on the nature of the functional group. These particles could be dried and re-solubilised and displayed no tendency to precipitate from solution.13 The amine functionalised particles (III) displayed a pronounced tendency to aggregate and precipitate and could only be solvated for short periods of time by ultrasonication. Adjusting the pH of solution containing the amine derivatives did not help solvation. Fig. 3 shows the XPS of the sulfur 2p region for samples I–IV. It is apparent that for samples I, II and IV the sulfur is bound in the form of a thiolate with the 2p3/2 and 2p1/2 peaks occurring close to 163 and 164 eV respectively. We note, however, there is some surface charging in these systems resulting in small shifts in the peak positions. The spectrum from sample III, however, shows evidence of oxidation of the thiol with peaks occurring as a doublet at ∼168 and 169 eV. It has been postulated that the amine group might compete with the thiol group for binding to the gold surface.14–17 If this was to occur then it would mean that a free thiol group would be available at the SAM/ambient interface which could lead to pronounced aggregation through the formation of disulfide bonds. This would be consistent with the XPS data shown and also explain the propensity for irreversible aggregation. FTIR studies of the ligand would also be consistent with this picture.12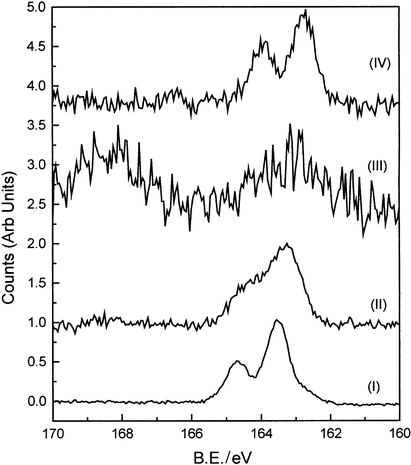 | ||
| Fig. 3 X-ray photoelectron spectra of the sulfur 2p region for samples I–IV. | ||
| Abbreviated name | Functional group | Particle sizea/nm | σ/Ω−1 cm−1 | Activation energy (Ec)/kJ mol−1 |
|---|---|---|---|---|
| aMetal core diameter determined using transmission electron microscopy (TEM). | ||||
| I | OH | 3.2 | 7.8 × 10⁻⁷ | 5.5 |
| II | COOH | 2.9 | 2.5 × 10⁻⁶ | 6.7 |
| III | NH2 | 6.0 | 7.8 × 10⁻² | 2.6 |
| IV | CH3 | 3.6 | 6.1 × 10⁻⁴ | 8.3 |
In-plane d.c. conductivity in nanoparticle films
Films of nanoparticles were formed on interdigitated electrode structures by casting from solution and allowing the solvent to evaporate. Tapping mode AFM was used to establish the film uniformity and thickness. These show that the film thicknesses were comparable to the thickness of the gold electrodes and that they are much smaller than the separation of the electrodes. In this regime the electric field is constant throughout the film and is proportional to V w−1, where V is the applied potential and w is the electrode separation.5The current–voltage (I–V) characteristics were obtained for all films at room temperature and as a function of temperature between 100 and 250 K. All films displayed ohmic behaviour and the room temperature conductivities (Table 1) were found to vary between ∼10−6 and 10−2 Ω−1 cm−1. These values are between 7 and 11 orders of magnitude lower than the conductivity of bulk gold, 4 × 10⁵ Ω−1 cm−1, and indicate that the stabilising ligands, surrounding the metallic cores, serve to insulate the cores. This is in contrast to the studies by Musick et al. who reported significant fusion of particles leading to the formation of percolating pathways and resulting in conductivities of the order of 103 Ω−1 cm−1.18 However, our results are in agreement with the work of Terrill et al. who, using long chain alkanethiols to stabilise their particles, found conductivities decreased from 10−5 to 10−9 Ω−1 cm−1 upon increasing the alkyl chain length of the stabilising ligand from eight to sixteen carbon units, C8 (HS(CH2)7CH3) and C16 (HS(CH2)15CH3), on 4 nm diameter particles.19 For sample IV, which is most comparable in size (3.6 nm) to Terrill's particles we expect the smaller thickness of our ligand (∼6 Å) to lead to a core separation of ∼12 Å compared to a core separation of ∼18 Å in their case. Using these values in eqn. (1) we would expect our sample IV to display a conductivity ∼2 orders of magnitude higher than theirs. From experiment we only find our systems to have a conductivity ca. one order of magnitude larger. This could arise for several reasons: a) our average core size is smaller, and b) it is possible that in the alkane systems one might have interpenetration between the alkane chains on neighbouring particles, thus leading to a reduced core–core separation.
Samples I and II gave similar conductivity values ∼10−6 Ω−1 cm−1 while the larger particles (III) gave rise to a much greater conductivity ∼10−2 Ω−1 cm−1 and particles of IV displayed conductivities between these extremes. This trend of increasing conductivity with increasing particle size is qualitatively as one would expect from eqn. (1), however the data are not sufficient to allow quantitative interpretation and ignore differences in the permittivity of the stabilising ligands.
Fig. 4 shows the variation of the conductivity as a function of temperature. All systems I–IV displayed a linear behaviour when plotted as ln σ vs. 1/T indicating that the classic model of activated tunnelling proposed by Neugebauer and Webb is applicable to these systems.
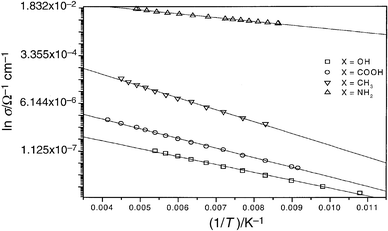 | ||
| Fig. 4 Conductivity versus reciprocal temperature (Kelvin). Lines are fits to the data, the goodness of fit was better than 0.99 in all cases. | ||
The activation energies, Ec, obtained from the slopes in Fig. 4 are given in Table 1. For samples I, II and IV, which have similar particle sizes, the values of Ec range between 5.5 and 8.3 kJ mol−1. This is similar to the value of 9.5 kJ mol−1 reported by Terrill et al. for C8 stabilised particles. Sample III has an activation energy approximately a factor of two less than the other samples, this is as expected since Ec has a 1/r dependence.
Response to analytes
Changes in the conductivity, upon exposure to analyte, were monitored by measuring changes in the current, at a fixed applied voltage. Preliminary studies of the response to a range of polar and non-polar analytes were made.Exposure to polar solvents
Fig. 5 shows the response of samples I–IV upon exposure to a relatively high concentration of methanol (91 ppth) for 600 s followed by a 900 s recovery period. Samples II and III display decreases in conductivity while samples I and IV show increases in conductivity. It is also evident that for samples I and IV the final conductivities, following subsequent exposure to dry nitrogen, are lower than their initial ones, possibly indicating that irreversible structural changes occur during the experiment. These data, when considered in conjunction with the fact that the recovery time constants, Table 2, are longer for samples II and III than for samples I and IV, suggest that H-bonding may be playing a role in determining the response of these materials.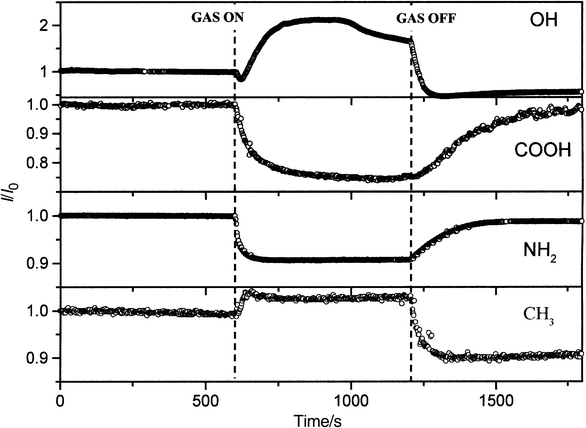 | ||
| Fig. 5 Response of samples I–IV upon exposure to methanol in N2 (91 ppth). | ||
| Sample | τinitial/s | τrecovery/s |
|---|---|---|
| τ is the time taken to (rise or) decay to e−2 of its initial value. | ||
| I | 73 | 29 |
| II | 61 | 219 |
| III | 20 | 110 |
| IV | 27 | 31 |
Samples II and III displayed good repeatability; Fig. 6 shows the response to repeated exposure–recovery cycles for sample II.
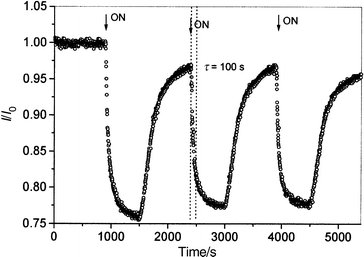 | ||
| Fig. 6 Response of sample II, in repeated exposure–recovery cycle, to methanol in N2 (91 ppth). | ||
Ellipsometric studies were carried out on two of these systems (II and IV) and the optical response monitored as a function of partial pressure of the analyte. Unfortunately these studies are problematic since the optical thickness is dependent on both the relative permittivity as well as the actual thickness, either of which may change during the experiment. Fig. 7 shows changes in the film thickness, calculated on the assumption that the relative permittivity of the films remains constant.20 It shows that the film thickness decreases for sample IV (CH3) and increases for sample II (COOH). Such changes are consistent with the changes observed in the conductivity, i.e. indicating that decreases in conductivity are associated with film swelling (increased particle separation) while increasing conductivity is associated with decreases in particle separation (or, alternatively with an increase in the relative permittivity of the film).
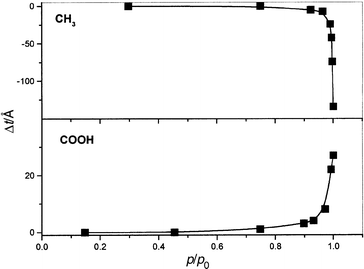 | ||
| Fig. 7 Ellipsometric response of samples II and IV upon exposure to methanol, as a function of partial pressure (p/po). The changes in film thickness were estimated by assuming that the relative permittivity of the film (n = 2.63, k = 1.55) remained constant during exposure. | ||
Other polar analytes such as ethanol and propan-1-ol showed qualitatively similar behaviour to methanol.
Exposure to non-polar solvents
The response to non-polar organic analytes tended to be less reproducible and displayed a variety of time dependent behaviour, which is not currently understood. For exposure to pentane and hexane the CH3 functionalised sample (IV) displayed the greatest change, decrease, in conductivity while the polar functionalised particles (I, II and III) showed only small changes. Fig. 8 presents a summary of the magnitude in the change in current observed for the different samples in response to a range of analytes. It is evident that qualitative differences in response of the different functionalised particles to different analytes do occur. In general the CH3 functionalised particles show a greater sensitivity to non-polar analytes while the polar functionalised particles are more sensitive to polar analytes. These trends could be understood in terms of the mutual solubility of the analytes and the stabilising ligand.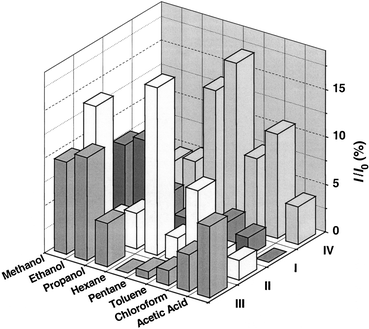 | ||
| Fig. 8 The magnitude of the response (I/Io), for particles I–IV, upon exposure to a range of analytes. | ||
Conclusions
Gold nanoparticles with well-defined size distributions and stabilised with short ω-functionalised ligands were produced. The conductivity of these samples can be readily explained in terms of an activated tunnelling model and the activation energies are similar to those reported by Terrill et al. for alkanethiol functionalised nanoparticles. Preliminary studies show that the particles are sensitive to different analytes, in the vapour phase, and display different conductometric and ellipsometric responses dependent upon the nature of the ω-functional group. Detailed ellipsometric and electrical studies are currently underway to establish a more quantitative understanding of the behaviour of these systems.Acknowledgements
We thank Simon Ogier for producing the electrode structures. S.R.J. would like to thank the Department of Physics and Astronomy for the provision of a Departmental Scholarship.References
- Sensors: A Comprehensive Survey, ed. W. Gopel, J. Hesse and J. N. Zemel, VCH, Weinheim, 1991, vol. 2, Part I. Search PubMed.
- J. W. Gardner, Microsensors; Principles and Applications, J. Wiley, New York, 1994 Search PubMed; J. Janata, Principles of Chemical Sensors, Plenum Press, New York, 1989. Search PubMed.
- Characteristics of SnO2 sensors; Figaro Engineering; Technical Reference Manuals 1990 & 1992; K. Takahata, Chem. Sens. Technol., 1988, 1 Search PubMed.
- A. K. Ray, M. J. Cook, S. C. Thorpe and S. Mukhopadyay, Phys. Status Solidi A, 1993, 140, K85 CAS; T. Richardson, V. C. Smith, A. Topacli, J. Jiang and C. H. Huang, Supramol. Sci., 1997, 4, 465 CrossRef CAS.
- P. N. Bartlett and S. K. Ling-Chung, Sens. Actuators, 1989, 19, 141 CrossRef CAS; J. W. Gardner, P. N. Bartlett and K. F. E. Pratt, IEE Proc. Circuits Devices Syst., 1995, 142, 321 CrossRef.
- M. Brust, D. Bethel, D. Shiffrin and C. Kiely, Adv. Mater., 1995, 7, 795 CAS.
- D. V. Leff, P. C. Ohara, J. R. Heath and W. M. Gelbart, J. Phys. Chem., 1995, 99, 7036 CrossRef CAS.
- S. D. Evans, S. R. Johnson, H. Ringsdorf, L. M. Williams and H. Wolf, Langmuir, 1998, 14, 6436 CrossRef CAS.
- C. A. Neugebauer and M. B. Webb, J. Appl. Phys., 1962, 33, 74 CAS.
- M. Brust, J. Fink, D. Bethell, D. J. Schiffrin and C. J. Kiely, J. Chem. Soc., Chem. Commun., 1995, 1655 RSC.
- S. R. Johnson, S. D. Evans, S. W. Mahon and A. Ulman, Langmuir, 1997, 13, 51 CrossRef CAS.
- S. R. Johnson, S. D. Evans and R. Brydson, Langmuir, 1998, 14, 6639 CrossRef CAS.
- The COOH particles did form agglomerates in solution due to inter-particle H-bond formation, however, this could be prevented by controlling the pH of the solution..
- D. V. Leff, L. Brandt and J. R. Heath, Langmuir, 1996, 12, 4723 CrossRef CAS.
- L. M. Liz-Marzan, M. Giersig and P. Mulvaney, Langmuir, 1996, 12, 4329 CrossRef CAS.
- C. Xu, L. Sun, L. J. Kepley and R. M. Crooks, Anal. Chem., 1993, 65, 2102 CrossRef CAS.
- N. Mohri, M. Inoue, Y. Arai and K. Yoshikawa, Langmuir, 1995, 11, 1612 CrossRef CAS.
- M. D. Musick, C. D. Keating, M. H. Keefe and M. J. Natan, Chem. Mater., 1997, 9, 1499 CrossRef CAS.
- R. H. Terrill, T. A. Postlethwaite, C. Chen, C. Poon, A. Terzis, A. Chen, J. E. Hutchison, M. R. Clark, G. Wignall, J. D. Londono, R. Superfine, M. Falvo, C. S. Johnson, E. T. Samulski and R. W. Murray, J. Am. Chem. Soc., 1995, 117, 12537 CrossRef CAS.
- Values for the refractive indices of these films were calculated from measurements made on thick films and calculations based on a two layer model in which the film is assumed to be semi-infinitely thick..
Footnote |
| † Originally prepared for a presentation at Materials Chemistry Discussion No. 2, 13–15 September 1999, University of Nottingham, UK. |
| This journal is © The Royal Society of Chemistry 2000 |
