Optical transduction of chemical sensing by thin films of colour reagents and molecular receptors using piezo-optical and surface plasmon resonance methods†
John D. Wright*a, Christoph. von Bültzingslöwenab, Timothy J. N. Carterb, Florence Colinab, Paul D. Shepherdb, Jennifer V. Olivera, Simon J. Holderac and Roeland J. M. Noltec
aCentre for Materials Research, School of Physical Sciences, University of Kent, Canterbury, Kent, UK CT2 7NR, E-mail: j.d.wright@ukc.ac.uk
bPiezOptic Ltd., Viking House, Ellingham Way, Ashford, Kent, UK TN23 6NF
cDepartment of Organic Chemistry, University of Nijmegen, Toernooiveld 1, 6525ED, Nijmegen, The Netherlands
First published on UnassignedUnassigned22nd December 1999
Abstract
Two novel chemical sensing systems using thin organic films have been elaborated and compared, one involving well established colour reagents used with a novel piezo-optical transduction system and the other using alkylviologen films for molecular recognition of phenols, with transduction via surface plasmon resonance (SPR) techniques. In the piezo-optical technique, chopped light absorbed by the thin sensing film deposited on piezoelectric polyvinylidene fluoride (PVDF) is converted into heat by non-radiative decay. This expands the film, stressing the PVDF and generating an electric charge which is measured using a lock-in amplifier. The signal dependence on optical absorption length, thermal diffusion length, film uniformity and porosity, chopper frequency and amplifier phase synchronisation are reviewed. The design and selection of molecular receptors for phenols, and the fabrication of thin films suitable for SPR, are described together with results demonstrating response patterns to different phenols and products of atmospheric aging of phenol solutions. The relative advantages of these two very different generic transduction techniques for organic thin film sensing layers are discussed with reference to the data presented on the selected sensing systems.
There are already many applications of thin organic and biological films in chemical sensing. In electrochemical sensing, macrocyclic complexing agents such as crown ethers and valinomycin incorporated into polymer membranes provide a range of ion-selective electrodes.1 Similar reagents have been incorporated into the gates of Field Effect Transistors to produce CHEM-FETs or IS-FETs (ion-sensitive field effect transistors).1 Organic semiconductors, especially phthalocyanine films, have been very extensively studied for detection of strong electron acceptors such as nitrogen dioxide via the large conductivity enhancement produced as a consequence of charge-transfer chemisorption of such gases.2–4 A wide range of organic coatings (including polymers, simple molecular species such as organic amines and acids, and molecular recognition agents such as cyclodextrins) have been used for sensing with quartz crystal microbalance (QCM) or surface acoustic wave (SAW) devices.1,5 However, all these transduction methods suffer disadvantages. Thus, electrochemical and FET devices require redox-active or charged species, while organic semiconductors detect only a small range of electroactive gases. In contrast, QCM and SAW devices primarily detect mass changes and are thus totally dependent on the organic coating layer for their selectivity.
Optical transduction of chemical sensing offers the dual advantages of wide applicability and chemical selectivity via the analysis of spectroscopic changes. Colour changes form the basis of many of the most common ways of identifying chemical change. Recently, older colorimetric analytical reagents have received a new lease of life from the advent of entrapment in porous polymer or sol–gel glass matrices combined with use of cheap optical fibres, laser diodes and light-emitting diodes (LEDs). Thus, immobilised reagents may be coated onto the tips or claddings of optical fibres to produce versatile reusable devices for chemical sensing via measurement of optical absorbance changes.6,7 Recently it has been recognised that the thermodynamics of reactions of colour reagents are modified by the local environment within such porous matrices. Thus changes in solvent structure and effects of restricted entropy in confined pores can produce significant changes in selectivity of ligands for colorimetric complexing of metal ions.8 Furthermore, these changes can be manipulated via control of pore size and pore wall chemistry. In a similar way, fluorescent reagents can be entrapped in porous matrices and their performance may be enhanced by appropriate modification of the matrix material. For example, ruthenium(II) tris(bipyridyl) complexes have been widely used to determine oxygen concentrations via the fluorescence quenching induced by oxygen, and it has been shown that the sensitivity for detection of dissolved oxygen in water is enhanced by entrapment in sol–gel matrices with hydrophobic pore walls.9 Exclusion of water from the pores which contain the entrapped reagent leads to favourable partitioning of oxygen from the aqueous phase to the gas phase. However, both direct absorption and fluorescence measurements suffer limitations: absorption measurements are more complex in systems which also scatter light, and fluorescence measurements are restricted to a small sub-set of reagents which show measurable fluorescence changes in response to chemical change.
In this paper we describe new chemical sensing results for thin films of organic sensing materials used with two relatively new transduction methods. In the first, chopped light absorbed by the thin sensing film deposited on piezoelectric polyvinylidene fluoride (PVDF) is converted into heat by non-radiative decay. This expands the film, stressing the PVDF and generating an electric charge which is measured using a lock-in amplifier. This piezo-optical method10 is thus parallel to photoacoustic spectroscopy, probing absorption directly by measuring its thermal consequences, and hence is also influenced by thermal conductivity, chopping frequency, sample thickness and uniformity or non-uniformity of reaction within the sample.11 The second method is surface plasmon resonance, which measures changes in the real and imaginary components of the relative permittivity of a sensing layer and thus can probe systems which do not exhibit visible absorption changes. This opens a way to utilise the large and rapidly growing number of synthetic molecular receptor molecules designed via supramolecular chemistry. In view of the relative novelty of these transduction methods, their key features and current status will first be briefly reviewed.
The piezo-optical monitoring system
The piezo-optical principle described above has been implemented for measurement of time-weighted average exposures to various chemicals, using the ‘badge' shown in Fig. 1.12,13 This is based on an indium–tin oxide (ITO) coated PVDF structure consisting of two laminated sheets of the polymer with opposite poling directions, providing compensation for any microphonic effects and temperature fluctuations not due to the absorption of light by the colour reagent spots. The latter may be thin films of the organic reagents deposited directly onto one side of the PVDF, but frequently it is difficult to obtain uniform films of this type from simple evaporation of small volumes of solutions of the reagent, and the resulting films often show poor adhesion to the flexible PVDF substrate, poor resistance to abrasion and limited dynamic range of response due to the limited amount of reagent present. Thus in practice thin organic composite films are most often used, with the reagent dispersed in a porous polymer matrix.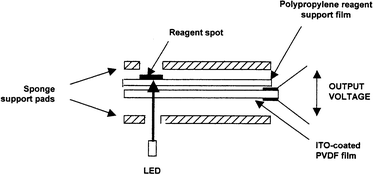 | ||
| Fig. 1 Exploded schematic view of the PiezOptic monitoring badge. The complete badge consists of five reagent spots on a single PVDF strip, the components shown being compressed together in a moulded plastic housing. After use this is measured in a reader with five LEDs. | ||
Entrapping the reagent in a porous matrix confers a number of advantage: (i) The polymer matrix is flexible, minimising damage due to substrate flexing. (ii) Many polymers adhere well to PVDF. (iii) The reagent concentration in the matrix may be varied to optimise dynamic range and calibration characteristics (as will be discussed later). (iv) By using different polymers or varying ratios of polymer:reagent it is possible to vary the rate of analyte diffusion to the reagent, and in some cases to improve selectivity. A similar effect may be achieved by use of a separate membrane filter placed above the reagent spots. (v) The reactions of colour reagents are often affected by humidity. For example, the sensitivity of o-tolidine (3,3′-dimethylbenzidine) reagent towards nitrogen dioxide increases as humidity increases,13 whereas the sensitivity of Rose Bengal indicator towards ammonia decreases as humidity increases.12 In such cases, the control of hydrophilic/hydrophobic character of the matrix may be used to optimise sensitivity. For example, entrapping the o-tolidine in a sol–gel silica matrix with hydrophilic pores provides an aqueous local environment for the reagent so that effects of external humidity changes are buffered, sensitivity varying by a factor of 2.3 between relative humidities of 20 and 60%.13
The PVDF film with reagent spots is mounted in a plastic badge housing between sheets of polyethylene foam sponge to minimise noise signals from mechanical stresses. The whole assembly provides for five reagent spots, which may either be all identical (providing 5 independent measurements for improved statistical accuracy) or include two or more different reagents to provide compensation for effects of temperature, humidity and other interferent species. To quantify the colour change of the reagent, the spots are consecutively illuminated by flashing LEDs with emission wavelength selected to match the optical absorption spectrum of the reagent system. The resulting thermally induced stress changes generate an oscillating charge which is amplified using a lock-in amplifier and converted into a time-weighted average concentration using stored calibration data. To compensate for variations in the outputs of individual LEDs (which we have measured to be in the range ±25% for random samples of the same type of LED) all amplifier output readings are normalised with reference to a standard black badge based on a strip of PVDF screen-printed on one side with a uniform black layer. Although thermal drift may lead to changes in LED output and amplifier gain between initial measurement of this standard badge and the sample, repeat measurements of the standard badge could be normalised to within ±2%. Further errors arise from variations in size and reactivity of individual reagent spots, accuracy of the calibration system, and interferences such as humidity, temperature variations and effects of other related chemicals on the reagent spots. Effects of variations between different reagent spots are minimised by averaging the normalised readings from five spots deposited on a single PVDF strip. Typically readings of each spot are taken during 16 flashes of the LEDs, the first two being discarded as atypical due to effects of the LEDs and circuitry equilibrating after the initialisation of the measurement cycle. The remainder are normalised, the highest and lowest readings are ignored and the remaining 12 readings averaged. The total error for a typical reagent system such as that for nitrogen dioxide has been estimated13 as ± 10% provided carefully designed calibration rigs14 are used.
As with photoacoustic spectroscopy, the detailed evolution of the piezo-optical signal depends on the optical absorption depth and the thermal diffusion length in the sample (in this case, the reagent spot). Thus, strong absorption of light reaching the reagent spot via the underlying PVDF film generates heat close to the PVDF surface and hence leads rapidly to thermal expansion and charge generation. In this case the piezo-optical signal will suffer almost no phase lag with respect to the incident light. However, light absorbed deeper in the spot generates heat which must first either diffuse to the PVDF surface or generate expansion which causes stress which is transmitted through the underlying layer of the reagent spot before reaching the PVDF and causing piezoelectric charge generation. In either case a phase lag occurs relative to the incident light pulse. Although the additional processes of thermal expansion of the solid material, generation of stress and consequent piezoelectric charge generation complicate the detailed interpretation, the overall picture is very similar to that of photoacoustic spectroscopy. A detailed study of the development of signal intensity and phase lag as the reagent spot develops its colour in response to chemical exposure can therefore provide information on the progress of the reaction. Studies have been reported using model systems to simulate the two extreme cases of gradual uniform increase of colour in a porous reagent, and non-uniform colouration with outer layers of the reagent spot developing colour which gradually spreads towards the lower surface as dosage increases.11 For non-uniform colouration, as the coloured region approaches the PVDF surface the phase lag decreases and the signal amplitude increases. In contrast, for uniform colouration the phase lag is negligible and the signal amplitude increases with colouration. However, the variation of signal with illumination frequency is complex as a result of at least three factors operating simultaneously. First, thermal diffusion length depends inversely on illumination frequency (which limits the range within which heat must be produced if it is to diffuse to the PVDF surface). Secondly, the stress experienced by the PVDF film depends on the rate of thermal expansion, and hence increases with illumination frequency, tending to zero as illumination frequency tends to zero. Finally, for very strongly absorbing layers, thermal expansion and stress from the very thin heated layer may be damped by the effect of the cooler remainder of the bulk of the spot, leading to a smaller response than expected. The overall effect of these factors is that the piezo-optical response passes through a maximum value at some optimum chopping frequency of the light, typically in the range 30–70 Hz. However, this optimum frequency will vary as the reagent spot develops colour (or loses colour in the case of reagents which operate via bleaching mechanisms). These considerations have two important implications. First, reproducible optimised analytical performance requires careful choice of phase-locking and chopper frequency. Inappropriate choices may lead to non-linear calibration curves and/or reduced sensitivity. Secondly, measurement of signal phase lag and amplitude as a function of chopper frequency can give information on the degree of uniformity of colour development in the reagent spot. This can be used to optimise parameters such as spot porosity, thickness and geometry, and reagent concentration. Such studies are difficult in practice due to the very small currents generated by the piezoelectric process, but work of this type is currently in progress to improve the performance of several reagents in this monitoring system.
Surface plasmon resonance (SPR)
Surface plasmons are collective motions of the free electrons in a metal which propagate as a quantised charge-density oscillation at the interface between a thin metal film and a dielectric. The evanescent electromagnetic fields associated with these plasmons extend into both the metal and the dielectric medium, so that the propagation of surface plasmons depends sensitively on the complex relative permittivities of these media. When the momentum of p-polarised light in the plane of such a metal film exactly matches the energy required to excite the surface plasmons to a higher quantised state, the incident light is absorbed by the metal film rather than reflected. This leads to a sharp dip in reflectivity over a small angular range, typically 2–3°. This momentum matching can only be achieved if the light is incident on the metal film via a prism or diffraction grating. The position, depth and width of the resonance reflectivity minimum can be accurately modelled in terms of the thickness and real and imaginary components of refractive index of the metal film and neighbouring dielectric layers.SPR has been widely used to characterise thin organic films and their chemical sensing properties. For example, the thickness and relative permittivities of copper tetra(21-crown-7)phthalocyanine films spin-coated on gold from chloroform solution have been determined by computer modelling of experimental SPR data.15 Sambles and co-workers16 measured SPR as a function of exciting wavelength for spun films of metal-free tetra(18-crown-6)phthalocyanine in air and after exposure to nitrogen dioxide. By modelling the data they were able to show that the derived changes in real and imaginary refractive indices as a function of wavelength were in good agreement with data from directly measured spectroscopic changes due to the interaction of nitrogen dioxide. Studies of the effects of a wider range of nitrogen dioxide concentrations on the SPR of similar phthalocyanine films showed that this technique can detect NO2 concentrations down to 1 ppm, and that the response consists of a rapid increase in the depth of the SPR resonance (associated with surface charge-transfer interactions) followed by a slower shift in the position of the resonance (associated with diffusion of nitrogen dioxide into the bulk of the film).17 Although these responses were slower and less readily reversible than the corresponding semiconductivity changes for the same films, they were less affected by humidity variations. More recently, a new SPR device based on a gold-coated silicon diffraction grating has been used to study the detection of NO2 by crown ether substituted phthalocyanine films.18 At the resonance angle, light is absorbed by the gold film and generates a photovoltage at the Schottky barrier between the gold and silicon, which may be used to detect the resonance. The reflected beam is thus not required for SPR measurement, and is available for other purposes. We have shown that the gold film on the grating has a surface structure of grains with dimensions approximately 50 nm, and that this rough surface can be used for surface enhanced Raman spectroscopy studies of the phthalocyanine film and its interactions with nitrogen dioxide.
Recently a number of new configurations for SPR measurements have been reported, which offer improved convenience and sensitivity. Jorgensen and Yee19 have reported SPR systems based on gold-coated optical fibres. Linear charge-coupled device (CCD) and photodiode arrays have been used with convergent-beam SPR devices to provide rapid measurement of complete SPR curves.20 Greatly improved sensitivity has been reported via use of the optical phase change which accompanies the SPR resonance in interferometric and phase polarisation contrast methods.21–23
As a technique for probing the dielectric and chemical sensing properties of thin organic films, SPR offers several advantages. In chemical sensing it is capable of detecting binding of analytes by molecular receptors even where no change in optical absorption occurs on binding. Thus wide areas of supramolecular chemistry/molecular recognition chemistry become applicable to chemical sensing via this transduction method. Furthermore, the use of gold films provides a platform for formation of self-assembled monolayers via gold–sulfur interactions. Such monolayers do not, however, use the full potential of the method since they are much thinner than the extent of the evanescent field available to probe the interactions between the sensing layer and the analyte (which is comparable to the wavelength of the light used and typically ≈500 nm). Via the use of modelling to derive film thicknesses and real and imaginary components of refractive index, together with the use of a range of exciting wavelengths, SPR provides considerably more detailed characterisation of the nature of the sensing interactions than is available from other techniques. It is also non-invasive, involving only illumination of the metal film, generally from the opposite side to that of the sensing layer.
A piezo-optical system for monitoring ozone
Colour reagent
The choice of colour reagent is vitally important to the success of the system. The reagent must be stable to give a long shelf-life. The colour change must be irreversible and match the emission spectrum of the LEDs used to interrogate the spot. The reaction itself should be fast enough to appreciate transient high exposure concentrations, it should be specific to the target analyte and finally be unaffected by changes in temperature and humidity during exposure. An extensive study of all the likely colorimetric reactions for ozone was undertaken and revealed that the best reagent was indigo-5,5′-disulfonate (‘Indigocarmine', IDS).24,25 The reagent undergoes rapid and stoichiometric bleaching in a buffered solution.26 Using the reagent, ozone concentrations can be measured with a detection limit of 4 ppb by the change in absorbance at 610 nm, using a spectrophotometer.30 mg Indigocarmine C.I. 73015 (Acid Blue 74) supplied by Aldrich Chemical Co., Gillingham, Dorset, UK were dissolved in 10 ml deionised water, wrapped to exclude light and stirred for 24 h with 1 g ‘Davisil' chromatographic silica powder (grade 644, 100–200 mesh, 150 Å pore size, 99+% pure, Aldrich) at room temperature. The product was filtered off, dried in a desiccator in the dark and ground for 5 min to remove any inhomogeneity. 25 mg of the product were mixed with 0.7 ml of a solution of 4.5 g poly(ethylene glycol) (PEG, Mn 2000) in 100 ml toluene, and 5 µl spots were deposited and allowed to set on the surface of the PVDF film. The use of hydrophilic PEG rather than alternative more hydrophobic polymers is important since water is essential for reaction of the initially produced ozonide to form the cleavage products. When these spots were exposed to low concentrations of ozone (i.e. below 10 ppb) over a period of 8 h no change was visible to the human eye, but the analyser system was sufficiently sensitive to show a significant change in response from the PVDF film.
Calibration
To produce a test atmosphere a UV ozone generator, consisting of a deuterium lamp sealed in a brass can fitted with inlet and outlet pipes, was used to obtain a continuous output of approximately 1 ppm of ozone, which was further diluted with air cleaned by passage through a charcoal air scrubber. The use of a 3-way valve ensured a continuous flow of ozone, redirecting unwanted ozonised air to waste through the third outlet of the valve. The generator ran continuously for the duration of the study (over one month) and was calibrated using the method of Bergshoeff et al.,27 passing known volumes of the test gas through a standard aqueous solution of indigo (23.40 mg of IDS in 1000 ml of deionised water buffered using KH2PO4, 6.80 g and Na2HPO4, 7.10 g) and measuring the change in absorbance due to bleaching. For this purpose, the absorption coefficient of indigo was determined experimentally, the value of 19![[thin space (1/6-em)]](https://www.rsc.org/images/entities/char_2009.gif) 501 l mol−1 cm−1 comparing favourably with the literature value27 of 19
501 l mol−1 cm−1 comparing favourably with the literature value27 of 19![[thin space (1/6-em)]](https://www.rsc.org/images/entities/char_2009.gif) 430 l mol−1 cm−1.
430 l mol−1 cm−1.Results
Fig. 2 shows the badge reader output as a function of ozone concentration, while Fig. 3 shows the concentration derived from the calibrated badge reader using these ozone badges compared to the values obtained by direct solution calibration using the Bergshoeff method. It can be seen that the badge gives comparable accuracy to the solution method, but considerably greater ease of use. The dynamic range of the calibrated badge is determined by the quantity of reagent present and the accessibility of the reagent in the spot. Use of less porous matrices or a diffusion barrier filter layer leads to reduced sensitivity and applicability to higher concentrations. All of the results were obtained using illumination of the spots with a high-intensity red LED. The emission maximum for this LED is at 660 nm, significantly higher than the wavelength of the absorption maximum for the adsorbed and PEG-entrapped indigo (595 nm), so higher sensitivity might be obtained if high-intensity LEDs with a better spectral match to the reagent could be obtained. If the ozone badge is to be commercially viable it must have a reasonable storage life and be resilient to extremes of temperature. Studies at room temperature and at an elevated temperature of 35![[thin space (1/6-em)]](https://www.rsc.org/images/entities/char_2009.gif) °C of badges sealed in a nitrogen atmosphere in foil bags have shown a shelf-life of at least 6 and 1 month respectively. Badges exposed to a controlled level of ozone in the gas-rig system and then removed and sealed in an air-tight container show no significant change over a period much greater than the original exposure period, whereas badges left in the open after exposure continue to change due to the presence of ambient ozone and should therefore be measured as soon as possible after use. The ozone reagent has been exposed to PAN (peroxyacetyl nitrate), NO2 and formaldehyde, as these contaminants are likely to be found at low levels during episodes of high ozone concentration. The results25 illustrate that at equivalent levels PAN, NO2 and formaldehyde give responses of 16, 15 and 4% of those to ozone, respectively. As PAN is found at lower levels than ozone both indoors and outdoors the real effect of this contaminant is likely to be negligible, and the effect of formaldehyde is small. The interference by NO2 is significant, although in practice probably desirable as its health effects as an oxidising gas are related to those of ozone.
°C of badges sealed in a nitrogen atmosphere in foil bags have shown a shelf-life of at least 6 and 1 month respectively. Badges exposed to a controlled level of ozone in the gas-rig system and then removed and sealed in an air-tight container show no significant change over a period much greater than the original exposure period, whereas badges left in the open after exposure continue to change due to the presence of ambient ozone and should therefore be measured as soon as possible after use. The ozone reagent has been exposed to PAN (peroxyacetyl nitrate), NO2 and formaldehyde, as these contaminants are likely to be found at low levels during episodes of high ozone concentration. The results25 illustrate that at equivalent levels PAN, NO2 and formaldehyde give responses of 16, 15 and 4% of those to ozone, respectively. As PAN is found at lower levels than ozone both indoors and outdoors the real effect of this contaminant is likely to be negligible, and the effect of formaldehyde is small. The interference by NO2 is significant, although in practice probably desirable as its health effects as an oxidising gas are related to those of ozone.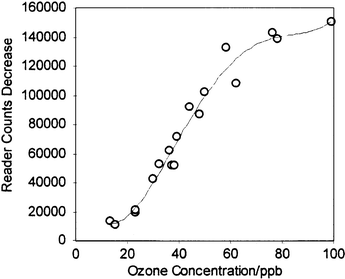 | ||
| Fig. 2 Calibration curve for the ozone monitoring badge. The recorded reader counts changes are for 8 h exposures to the indicated ozone concentrations in undried laboratory air. | ||
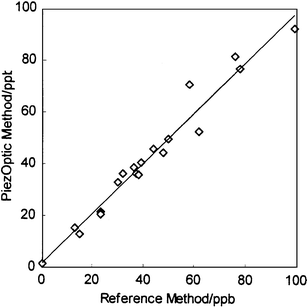 | ||
| Fig. 3 Comparison of ozone concentrations derived from the calibrated badge system and determined simultaneously by the standard method of ref. 27. | ||
This system has not been optimised with respect to reagent concentration, spot matrix porosity, spot geometry or measurement conditions, nor have the effects of humidity and temperature variations been quantified. Work on all these areas is in progress so that the badge may be used for atmospheric monitoring in addition to its present uses under controlled conditions (for example, monitoring ozone concentrations in enclosed air-conditioned office or domestic premises).
Surface plasmon resonance in detection of phenols in water
Phenols were selected as prototype analytes for detection using layers of specific molecular receptors on SPR devices for three reasons. Several incidents involving industrial phenol pollution of water supplies have occurred recently, the most serious of which (in the city of Ufa in the Bashkiria region of Russia) led to phenol poisoning symptoms in many thousands of the inhabitants. Phenols are also released from decaying wood in contact with water, and on aging in air undergo oxidative coupling to form polyphenols which may be chlorinated in drinking water treatment plants, generating toxic polychlorinated biphenols (PCBs). Finally, phenols are endocrine disruptors and models for a number of other aromatic water pollutants including several drugs, herbicides and pesticides.Two classes of molecular receptor were evaluated in the present study. The first class consisted of synthetic molecular ‘clips' (Fig. 4).28 These are cleft-shaped molecules with a central diarylglycouril unit connected to two aromatic ‘walls'. Two carbonyl groups in the cleft can hydrogen bond to phenol OH groups, while the aromatic side walls give π–π interactions.29 Although self-assembled monolayers of such receptors could have been fabricated on gold films by functionalising the aryl groups of the glycouril moiety with thiols, it was felt that these very thin layers would not provide the optimum sensitivity as they do not utilise the full extent of the evanescent field, as pointed out above. Thus attempts were made to entrap several receptors of this class in porous matrices spun-coated onto the gold or silver films. However, poor solubility of the receptors in the precursors for silica sol–gel materials led to very poor incorporation of the receptors into the porous layers, while entrapment in poly(methyl methacrylate), although more successful in incorporating larger amounts of the receptor, led to poor quality spun films. Modification of the receptor with crown-ether-type ‘handles' (Fig. 4) led to improved solubility in sol–gel precursors and some sensitivity to phenols, but also sensitivity to metal ions as previously reported by Nolte and co-workers.30 Since natural waters are likely to contain a range of metal ions such as calcium and sodium, this sensitivity to metal ions would be likely to mask effects due to phenols, so further work on these receptors was abandoned.
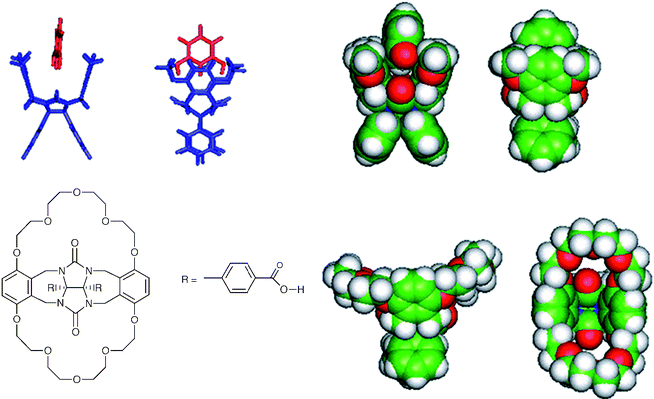 | ||
| Fig. 4 Examples of ‘molecular clip' receptors based on a central diarylglycouril unit connected to two aromatic ‘walls'. | ||
The second class of receptors consisted of polyoctylviologen (POV) and cyclobis(paraquat-p-phenylene) (CPP) (Fig. 5) as complexes with polystyrenesulfonate (PSS). POV ditosylate was synthesized by the condensation polymerisation of equimolar quantities of 4,4′-bipyridine with 1,10-ditosyldecane in dry acetonitrile at room temperature.31,32 The resultant water-soluble polymer was filtered off, dried and characterised by 1H and 13C NMR spectroscopy.
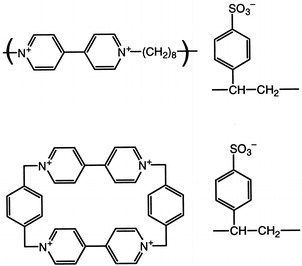 | ||
| Fig. 5 Poly(alkylviologen) (POV) and ‘viologen box' (CPP) receptors with polymeric counter anions (PSS). | ||
CPP tetrabromide was prepared according to the procedure of Odell et al.33 by condensation of the p-xylene bis(pyridinium hexafluorophosphate) salt with 1,4-bis(bromomethyl)benzene in dry acetonitrile at reflux for 24 h. The resulting yellow precipitate was filtered off and purified by column chromatography [silica gel; CH3OH–water–saturated aqueous NH4Cl (6:4:1)] followed by recrystallisation from methanol. The compound, in the form of the chloride salt, was dissolved in acetonitrile and precipitated by the addition of aqueous NH4PF6. The CPP tetrakis(hexafluorophosphate) salt was characterised by 1H and 13C NMR spectroscopy. The water-soluble CPP tetrabromide was obtained via anion exchange by adding an acetonitrile solution of tetraethylammonium bromide to an acetonitrile solution of the tetrakis(hexafluorophosphate) salt and isolating the resulting precipitate.
Both the polymer and cyclophane were complexed with sodium PSS by the addition of an aqueous solution of the relevant salt (the tosylate of POV and bromide of CPP) to a stirred aqueous solution of NaPSS.31 The resulting precipitate aggregated and settled to the base of the reaction vessel whereupon the supernatant liquid was decanted and the precipitate repeatedly washed with water. Solutions of the POV–PSS complex were prepared by sonication of the material at 50°C in 1,4-dioxane–concentrated HCl-water (10:9:1). Solutions of the CPP–PSS complex were prepared by sonication of the material at 50![[thin space (1/6-em)]](https://www.rsc.org/images/entities/char_2009.gif) °C in 1,4-dioxane–concentrated HCl (1:4).
°C in 1,4-dioxane–concentrated HCl (1:4).
These receptors bind phenols via charge transfer interactions between the donor phenols and the viologen dication acceptor, with additional contributions from hydrogen bonding between OH groups of the phenol and the cationic centres and from π–π interactions. As the receptor is a dicationic viologen, it is possible to use a polymeric counter anion and hence form a porous film of the pure receptor with no need for a separate porous matrix. For SPR studies, films were deposited by dropping 40 μl of a solution containing 20 mg ml−1 of the receptor (prepared as described above) onto the centre of circular 48 nm silver films on glass slides and then spinning at 4000 rpm. Silver films are significantly better than gold for SPR studies of species in solution, since water in contact with the metal film causes broadening and shifting of the resonance to higher angles of incidence. The sharper resonance at lower angles of incidence for silver34 counteracts these effects. The coated slides were mounted on a semicircular glass prism (refractive index 1.5151) using index-matching fluid, and clamped onto an O-ring seal in contact with a small chamber connected to a peristaltic pump and waste reservoir so that thermostatted pure water or test solutions could be passed over the sensing film. The whole assembly was mounted on a θ–2θ goniometer driven by a computer-controlled stepper motor, with the axis of rotation passing through the interface between the receptor and silver films. A p-polarised He/Ne laser beam chopped at 260 Hz passed via a beam-splitter to a reference photodiode, and via a pinhole and collimator to the prism assembly and the signal photodiode. Signal and reference photodiode outputs were pre-amplified to approximately the same amplitude, amplified by lock-in amplifiers and the signal ratio was recorded as a function of angle, or as a function of time at a fixed angle. Phenols and biphenols were used as supplied by Aldrich Ltd. (or Fluka in the case of catechol and hydroquinone), either as freshly prepared aqueous solutions or after storing the solutions in contact with air in the dark for varying periods. Initial studies35 using the polyviologen (POV–PSS) receptor in Fig. 5 showed that the SPR resonance at an angle of incidence of 73° became shallower and shifted slightly to higher angle on exposure to aqueous phenol solutions. The sensitivity and rate of the change varied significantly for different phenols, and for a given phenol the rate of change in reflectivity at a fixed angle increased with the phenol concentration. The responses indicated that 0.1 mM concentrations of phenols in water (approximately 10 ppm) could be detected in this way, and that the responses, although fairly slow (typically with t90 between 10 and 30 min) were reversible in clean water. Similar results have been obtained with the viologen ‘box' receptor (CPP–PSS) of Fig. 5. More detailed studies using CPP–PSS films in the present work have shown that these effects change as the phenol solution ages in air, as shown in Fig. 6 and 7. To identify the chemical origin of these effects, a diethyl ether extract of an aged 1 mM aqueous solution of catechol was analysed by GC–MS, giving the results shown in Fig. 8. An AMS Model 93 gas chromatograph fitted with a 30 m × 0.32 mm column coated with 0.25 µm Supelco Simplicity % coating was used in conjunction with a Finnegan MAT Ion Trap mass spectrometer. Three of the GC peaks give mass spectra which clearly show higher molecular weight components consistent with biphenol formation by oxidative coupling in solution. To check whether the enhanced SPR responses of aged phenol solutions could indeed arise from the presence of biphenols, SPR responses were recorded for 1 and 0.1 mM aqueous solutions of 2,2′-biphenol, as shown in Fig. 9. These responses are large, with the 0.1 mM solution giving a response close to that observed for a fresh ten times stronger solution of catechol. Since biphenols are very similar in size and shape to the viologen electron acceptor groups of the receptor, this large response is to be expected.
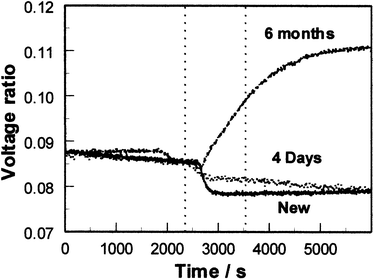 | ||
Fig. 6 Fixed-angle SPR responses of a CPP–PSS film to 1 mM aqueous hydroquinone solutions recorded at various times after initial preparation of the solutions. Solutions were stored at 22![[thin space (1/6-em)]](https://www.rsc.org/images/entities/char_2009.gif) °C in contact with air in artificial light between measurements. (Pump input switched from distilled water to sample between the two dotted lines. The time delay before onset of the change is that for the sample to travel from the pump to the SPR cell.) °C in contact with air in artificial light between measurements. (Pump input switched from distilled water to sample between the two dotted lines. The time delay before onset of the change is that for the sample to travel from the pump to the SPR cell.) | ||
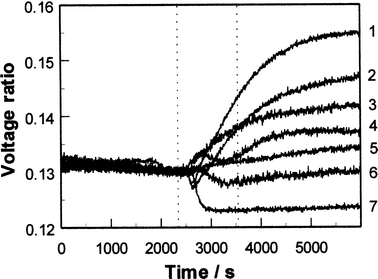 | ||
Fig. 7 Comparison of fixed-angle SPR responses of a CPP–PSS film to 1 mM aqueous solutions of hydroquinone, resorcinol and catechol freshly-prepared (7, 6 and 4 respectively) and after 6 weeks of aging stored at 22![[thin space (1/6-em)]](https://www.rsc.org/images/entities/char_2009.gif) °C in contact with air in artificial light (1, 3 and 2 respectively). The response to a fresh 1 mM solution of phenol is also shown (5). (Vertical dotted lines as for Fig. 6.) °C in contact with air in artificial light (1, 3 and 2 respectively). The response to a fresh 1 mM solution of phenol is also shown (5). (Vertical dotted lines as for Fig. 6.) | ||
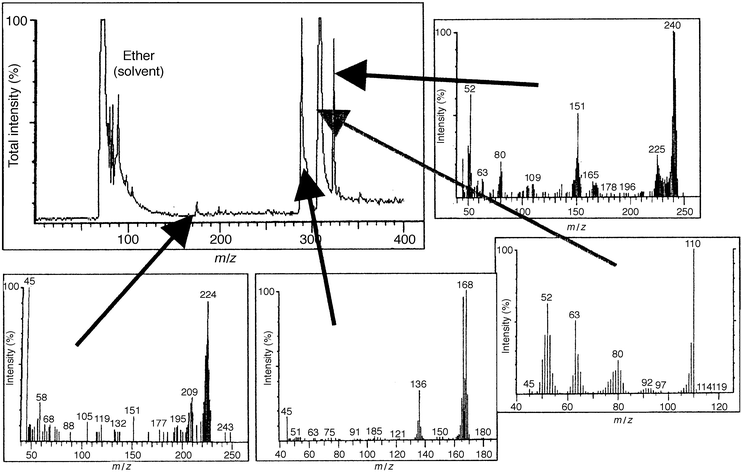 | ||
| Fig. 8 GC-MS data for a diethyl ether extract from an aged 1 mM aqueous solution of catechol. The mass spectrum for the main GC peak is that of catechol, but the mass spectra of the three other principal components all show higher molecular weight biphenol components. | ||
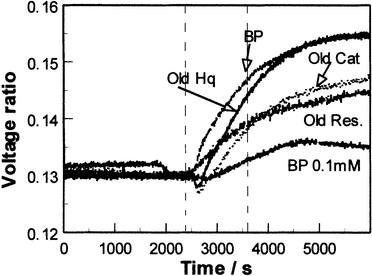 | ||
| Fig. 9 Fixed-angle SPR responses of a CPP–PSS film to freshly prepared 1 and 0.1 mM aqueous 2,2′-biphenol (BP) compared to those for aged 1 mM aqueous solutions of hydroquinone (HQ), catechol (Cat) and resorcinol (Res). (Vertical dotted lines as in Fig. 6.) | ||
These results show that SPR devices coated with viologen receptors can detect 0.1 mM concentrations of phenols in water. In view of the different response magnitudes for different phenols there is promise that, if modified receptors with different response patterns can be synthesized, the use of an array of several SPR devices with different receptors could be used with pattern recognition techniques to identify mixtures of different phenols and related compounds. The synthesis and screening of such modified receptors is in progress. Furthermore, the enhanced responses from the biphenol products of aging suggest that such an array might also be capable of indicating the age of phenol pollutants from the extent of biphenol formation. All these results have been obtained for fixed-angle SPR data at a single laser wavelength. Since the balance of charge-transfer, hydrogen-bonding and π–π interactions is likely to vary across a range of different phenols interacting with viologen receptors, detailed examination of the SPR curves as a function of wavelength, with associated modelling in terms of changes in real and imaginary components of relative permittivity, is likely to provide additional data on the binding interactions. In this way it will be possible to exploit the spectroscopic sensitivity of SPR to optimise the measurement conditions to provide maximum discrimination between different phenols. Further studies of this nature are in progress using a convergent-beam SPR system with CCD array detection.
Comparison of the piezo-optical and SPR methods
These two methods for transducing chemical recognition by thin organic films are both of wide applicability. They are both based on non-invasive optical interrogation of the films, and as such are capable of providing spectroscopic selectivity, although the SPR method does not demand the change in optical absorption which is essential for the piezo-optical method. In this respect it is a very important transduction method for use with the large number of new molecular recognition systems (many of which give no significant colour change when they bind analytes) now being designed and synthesized by organic chemists. Both methods are in principle sensitive to the spatial distribution of molecular recognition through the thickness of the film. Model systems to show these effects have been explored for the piezo-optical system, but no experimental or theoretical work has yet been reported on SPR responses from thin films with a concentration gradient of reacted species across their thickness (although the theoretical basis for modelling such effects is already available). Similarly, few studies of the effects of the physical quality and chemical purity of the sensing films on the SPR and piezo-optical sensing properties have been reported. However, as with any sensing films, the strength and uniformity of receptor–analyte interactions and the relative probabilities of surface and bulk effects are likely to depend significantly on film quality and purity, and this is an area where further study is likely to yield significant improvements in device performance. The piezo-optical method depends on fast irreversible chemical reactions for its ability to provide time-weighted average chemical exposure data. SPR can also be used in this way (e.g. for monitoring the largely irreversible binding between antibodies and antigens in immunoassay methods), but is more commonly used for continuous monitoring of reversible interactions between the sensing layer and analytes. For both methods, however, the sensing interaction takes place at room temperature. Although this factor favours long-term stability of the sensing film, it imposes the additional requirement that the sensing reaction should be rapid and, in the case of SPR, generally reversible at room temperature. Finally, both methods use optical components which are now available cheaply, and thus offer considerable potential for the development of versatile generic environmental and occupational monitoring systems with common transduction and instrumentation platforms. Such systems, together with the wide range of new organic receptors easily fabricated as thin films, are attractive for development of instruments which harmonise measurement protocols for a wide range of target analytes.Acknowledgements
This work was supported by the European Community (INCO-Copernicus, INTAS, Erasmus and ECTS programmes) and by the UK Department of Trade and Industry via a Teaching Company grant.References
- W. Göpel, J. Hesse and J. N. Zemel (Editors), Sensors—A Comprehensive Survey, VCH, Weinheim, 1991, vols. 2 and 3. Search PubMed.
- J. D. Wright, Prog. Surf. Sci., 1989, 31, 1 CrossRef CAS.
- P. Roisin, J. D. Wright, R. J. M. Nolte, O. E. Sielcken and S. C. Thorpe, J. Mater. Chem., 1992, 2, 131 RSC.
- A. Wilson, G. P. Rigby, J. D. Wright, T. Terui and Y. Maruyama, J. Mater. Chem., 1992, 2, 303 RSC.
- R. W. Murray, R. E. Dessy, W. R. Heineman, J. R. Janata and W. R. Seitz, ACS Symp. Ser., 1989, 403, Search PubMed.
- D. Avnir, Acc. Chem. Res., 1995, 28, 330.
- A. L. Harmer and R. Narayanaswami, in Chemical Sensors, ed. T. E. Edmonds, Blackie, London, 1988, ch. 13. Search PubMed.
- N. A. J. M. Sommerdijk, A. Poppe, C. A. Gibson and J. D. Wright, J. Mater. Chem., 1998, 8, 565 RSC.
- B. D. MacGraith, G. O'Keefe, C. M. McDonagh, B. O'Kelly and J. F. McGilp, in Sensors VI: Technology, Systems and Applications, IOP, Bristol, 1993, p. 75. Search PubMed.
- D. J. Clarke and F. Zamani-Farahani, Int. Pat., WO 90/1301, 1st November, 1990. Search PubMed.
- C. A. Gibson, T. J. N. Carter, P. D. Shepherd and J. D. Wright, Sens. Actuators B, 1998, 51, 238 CrossRef.
- J. D. Wright, F. Colin, R. M. Stöckle, P. D. Shepherd, T. Labayen and T. J. N. Carter, Sens. Actuators B, 1998, 51, 121 CrossRef.
- F. Colin, P. D. Shepherd, T. J. N. Carter and J. D. Wright, Sens. Actuators B, 1998, 51, 244 CrossRef.
- P. B. M. Archer, A. V. Chadwick, J. J. Miasik, M. Tamizi and J. D. Wright, Sens. Actuators B, 1989, 16, 379 CrossRef CAS.
- P. S. Vukusic, J. R. Sambles and J. D. Wright, J. Mater. Chem., 1992, 2, 1105 RSC.
- M. S. Jory, P. S. Cann and J. R. Sambles, J. Phys. D, 1994, 27, 169 Search PubMed.
- J. D. Wright, A. Cado, S. J. Peacock, V. Rivalle and A. M. Smith, Sens. Actuators B, 1995, 29, 108 CrossRef.
- P. I. Nikitin, A. A. Beloglazov, N. N. Valeiko, J. A. Creighton, A. M. Smith, N. A. J. M. Sommerdijk and J. D. Wright, Sens. Actuators B, 1997, 38–39, 53.
- R. C. Jorgensen and S. S. Yee, Sens. Actuators B, 1993, 12, 213 CrossRef.
- Texas Instruments: http://www.ti.com/sc/docs/msp/spreeta.
- S. J. Elston and J. R. Sambles, J. Mod. Opt., 1991, 38, 1223 CAS.
- A. V. Kabashin and P. I. Nikitin, Opt. Commun., 1998, 150, 5 CrossRef CAS.
- J. Homola and S. S. Yee, Sens. Actuators B, 1998, 51, 331 CrossRef.
- H. Bader and J. Hoigné, Water Res., 1981, 15, 449 CrossRef CAS.
- D. Grosjean and M. W. M. Hisham, J. Air Waste Manage. Assoc., 1992, 42, 169 Search PubMed.
- Y. Dorta-Schaeppi and W. D. Treadwell, Helv. Chim. Acta, 1949, 32, 356 CrossRef CAS.
- G. Bergshoeff, R. W. Lanting, J. van Ham, J. M. G. Prop and H. F. R. Reijnders, Analyst (London), 1984, 109, 1165 RSC.
- R. P. Sijbesma, A. P. M. Kentgens and R. J. M. Nolte, J. Org. Chem., 1991, 56, 3199 CrossRef CAS.
- C. A. Hunter and J. K. M. Sanders, J. Am. Chem. Soc., 1990, 112, 5525 CrossRef CAS.
- J. W. H. Smeets, L. van Dalen, V. E. M. Kaats-Richter and R. J. M. Nolte, J. Org. Chem., 1990, 55, 454 CrossRef CAS.
- H. Akahosi, S. Toshima and K. Itaya, J. Phys. Chem., 1981, 85, 818 CrossRef.
- A. Factor and G. E. Heinsoln, J. Polym. Sci., Part B, Polym. Lett., 1971, 9, 289 Search PubMed.
- B. Odell, M. V. Reddington, A. M. Z. Slawin, N. Spencer, J. F. Stoddart and D. J. Williams, Angew. Chem., Int. Ed. Engl., 1988, 27, 1547 CrossRef.
- E. Kretschmann and H. Raether, Z. Naturforsch., Teil. A, 1968, 23, 2135 Search PubMed.
- J. D Wright, J. V. Oliver, R. J. M. Nolte, S. J. Holder, N. A. J. M. Sommerdijk and P. I. Nikitin, Sens. Actuators B, 1998, 51, 305 CrossRef.
Footnote |
| † Basis of a presentation given at Materials Chemistry Discussion No. 2, 13–15 September 1999, University of Nottingham, UK. |
| This journal is © The Royal Society of Chemistry 2000 |
