Formation and spectroscopic characterisation of self-assembled phthalocyanine monolayers†
David J. Revell, Isabelle Chambrier, Michael J. Cook and David A. Russell*
School of Chemical Sciences, University of East Anglia, Norwich, UK NR4 7TJ, d.russell@uea.ac.uk
First published on UnassignedUnassigned22nd December 1999
Abstract
A series of three Phthalocyanine (Pc) derivatives have been designed, synthesised and formulated as self-assembled monolayers (SAMs) on gold-coated optical waveguides. The alkyl chain tethering the Pc macrocycles to the gold surface via a thiol moiety varied in length viz. (CH2)11, (CH2)8 and (CH2)3. The three Pc SAMs have been characterised using reflection absorption infrared spectroscopy and fluorescence spectroscopy excited via the evanescent wave. The infrared data have shown that the length of the alkyl tether has a profound effect on the orientation and packing density of the Pc macrocycle on the gold surface. Similarly, the intensity of fluorescence observed from the Pc monolayers was related to the length of the alkyl tether. A further investigation of the C11 Pc derivative SAM has shown that the monolayer film was stable, exhibiting no oxidation and only minor orientation changes on the gold surface over a period of 24 months as determined by infrared and fluorescence spectroscopy. The longevity of the Pc SAM is thought to be due to the macrocyclic ring possibly preventing oxidation of the thiolate root. As simple alkanethiols are known to oxidise at gold surfaces, the stability results obtained for the Pc derivative would suggest that macrocyclic SAMs may have properties that are more suitable for long term applications.
Introduction
Phthalocyanines (Pcs) have been shown to possess properties which are attractive for numerous applications ranging from electrophotography,1 optical data storage systems,2,3 chemical sensors,4,5 photovoltaic cells,6 fuel cells,7 electrochromic devices8 and photodynamic therapy of cancer.9,10 Such is the interest in these macrocyclic compounds that much work has focused on the formulation of thin films of Pcs using techniques such as Langmuir–Blodgett,11–14 spin-coating,14,15 deposition from the vapour phase16,17 and more recently the formation of Pc monolayers via self-assembly.18–20 Self-assembled monolayers (SAMs) offer a number of advantages over other thin film formation techniques in that the monolayer films are simple to fabricate, are chemically bound to the substrate and deposition is highly reproducible with known specific molecular orientation. Such properties are particularly attractive in many of the fields in which Pcs are being applied.We have previously reported the formation and characterisation of SAMs formulated from thiol and disulfide derivativised Pcs deposited on gold-coated substrates18–21 and trichlorosilyl derivative Pcs assembled on glass and silicon substrates,22 focusing on the use of the Pc SAMs for chemical sensing applications. In our previous studies we have noted that the mercaptoalkyl chain which tethers the Pc macrocycle to the gold-coated substrate appears to determine the surface orientation of the SAM. In order to study this observation a series of three Pc derivatives have now been synthesised with a varying length mercaptoalkyl chain viz. C11, C8, C3. In this paper the formation of the three Pc derivatives as SAMs on gold-coated glass substrates and the subsequent characterisation of the surface orientation by reflection absorption infrared (RAIR), visible absorption and fluorescence spectroscopies is described. Additionally, the long term stability of macrocyclic SAMs is also discussed as infrared and fluorescence spectroscopic data for the C11 Pc derivative SAM over a 24 month period are also presented.
Experimental
Synthesis of the Pc derivatives
![[thin space (1/6-em)]](https://www.rsc.org/images/entities/char_2009.gif) °C min−1.
°C min−1. | ||
| Fig. 1 Phthalocyanine derivatives showing varying length mercaptoalkyl tether: (CH2)111, (CH2)82 and (CH2)33. | ||
1,4,8,11,15,18-Hexahexyl-22-[n-(methylsulfonyloxy)alkyl]-25-methylphthalocyanines
These were prepared from the hydroxyalkyl derivatives, above, by adaptation of the procedure described previously.21°C, (D→I) 135.7°C. m/z 1239. δH (270 MHz, C6D6): 7.82 (m, 4H), 7.4–7.64 (m, 4H), 4.7 (m, 4H), 4.58 (m, 4H), 4.41 (m, 4H), 3.7 (t, 2H), 3.5 (s, 3H), 1.0–2.4 (m, 65H), 0.88 (t, 18H), −0.8 (s, 2H). Found. C, 75.58; H, 9.00; N, 8.89. C78H110N8O3S requires: C, 75.55; H, 8.95; N, 9.04%.°C, (D→D) 163.9°C, (D→I) 186.0°C. m/z 1169. δH (270 MHz, C6D6): 7.82 (s, 4H), 7.35–7.62 (m, 4H), 4.65 (m, 4H), 4.55 (t, 2H), 4.41 (m, 6H), 4.2 (t, 2H), 4.08 (t, 2H), 3.47 (s, 3H), 2.42 (t, 2H), 1.2–2.4 (m, 51H), 0.9 (m, 18H), −0.81 (s, 2H). Found. C, 75.07; H, 8.62; N, 9.43. C75H100N8O3S requires: C, 74.95; H, 8.62; N, 9.58%.1,4,8,11,15,18-Hexahexyl-22(n-mercaptoalkyl)-25-methylphthalocyanines
These were prepared from the (methylsulfonyloxy)alkyl compounds, above, by adaptation of the procedure described previously21 using thiourea followed by reaction with NaOH. Reactions were performed under nitrogen to avoid oxidation to the disulfide.21°C, (D→I) 173.8°C. δH (270 MHz, C6D6): 6.6–7.7 (m, 8H), 4.5 (m, 4H), 4.2 (m, 2H), 3.8–4.0 (m, 4H), 3.5 (m, 2H), 3.2 (m, 2H), 2.6 (m, 4H), 2.1–2.4 (m, 5H), 1.1–2.0 (m, 56H), 0.8–1.1 (m, 18H), −1.8 (s, 2H). S–H signal not identified. Found. C, 78.46; H, 9.12; N, 9.33. C77H108N8S requires: C, 78.52; H, 9.24; N, 9.51%.°C. m/z 1177. δH (270 MHz, C6D6): 7.1–7.8 (m, 8H), 4.62 (m, 4H), 3.5–4.5 (m, 14H), 3.2 (m, 5H), 1.2–2.6 (m, 46H), 0.8–1.1 (m, 18H), −2.05 (s, 2H). S-H signal not identified. Found. C, 78.23; H, 8.80; N, 9.85. C72H98N8S requires C, 78.07; H, 8.92; N, 10.11%.Formation of the Pc SAMs
Glass microscope slides (BDH Ltd.) were used as the substrates for the Pc SAMs characterised using RAIRS. For the fluorescence and visible region studies of the Pc SAMs SF-15 glass slides (UQG Ltd.) were used as the glass microscope slides exhibited an intrinsic fluorescence. For both types of substrate the glass surface was wiped clean with a soft, detergent free tissue and then washed with a stream of methanol in order to remove any bulk surface contamination. The glass substrates were then immersed into a solution of potassium hydroxide in aqueous methanol (100 g of potassium hydroxide was dissolved in 100 mL of Millipore water, then diluted to 250 mL with methanol) for 12 hours. The substrates were rinsed with fresh Millipore water and then dried in a stream of refluxing propan-2-ol. The resultant clean substrates were stored in sample jars, with air-tight lids. The cleaned, dried glass substrates were then coated with a layer of chromium (99.999% purity, Johnson Matthey Ltd.) followed by a layer of gold (99.999% purity, Johnson Matthey Ltd.). The chromium layer was deposited to ensure a good adhesion of the gold onto the glass surface. The thickness of each metal layer deposited was dependent upon the spectroscopic technique employed to study the metal film once a SAM had been formed on the freshly prepared surface. For RAIR spectroscopic characterisation, 5 nm of chromium was deposited on the cleaned glass substrates followed by a 45 nm gold layer. For the fluorescence and visible absorption spectroscopy experiments, 1 nm of chromium was deposited on the cleaned glass substrate followed by an 8 nm gold layer. Both the chromium and gold layers were deposited by thermal evaporation under vacuum using an Edwards Auto 306 vacuum evaporator. The Pc SAMs were formed by immersing the freshly prepared gold-coated substrates in a 2 × 10⁻⁴ mol dm−3 cyclohexane solution of 1, 2, or 3 for 20 hours (to ensure the formation of well organised SAMs24). Reference substrates for the SAMs were fabricated by immersing freshly prepared gold-coated substrates into cyclohexane for 20 hours. The Pc SAMs, and their respective references, were then washed in fresh cyclohexane, dried in a stream of argon and then subsequently stored in clean amber sample jars with air-tight lids.RAIR spectroscopic characterisation of Pc SAMs
RAIRS experiments were performed using a Bio-Rad FTS40 Fourier transform infrared spectrometer coupled with a Spectra-Tech FT85 reflectance unit. The FTIR spectrometer housed a liquid nitrogen cooled MCT detector. RAIR spectra were acquired with the reflectance unit, using p-polarised light at an incidence angle of 85°. The spectra were obtained from the co-addition of 1024 scans at a resolution of 4 cm−1.Visible absorption and fluorescence spectroscopy of Pc SAMs
The visible region spectra of the Pc SAMs were obtained using a Hitachi U3000 spectrophotometer, with the corresponding reference blank gold-coated substrate placed in the reference beam.Fluorescence data were obtained from the Pc SAMs using a method based on evanescent wave excitation. The protocol used was developed from that previously reported.20 The experimental configuration consisted of an in-house designed sample holder which was housed within the sample chamber of a Fluoromax-2 fluorescence spectrometer (Instruments SA). The sample holder allowed each Pc SAM to be reproducibly positioned with regards to the laser source.
Each Pc SAM was excited using a 3 mW laser diode at 670 nm (Model VLM2-3L, Applied Laser Systems) and a 4 mW HeNe laser at 633 nm (Model 1107, Uniphase Inc.). The laser beam was directed onto the edge of the glass substrate, i.e., to use the substrate as an optical waveguide. The laser radiation passed along the length of the substrate by means of total internal reflection thereby exciting fluorescence from the Pc SAM via the evanescent wave. The emitted fluorescence was detected using the photomultiplier detector of the fluorimeter.
Results and discussion
RAIRS characterisation of Pc SAMs
Reflection–absorption infrared spectroscopy (RAIRS) was used to determine the formation and structural orientation of the SAMs of Pcs 1, 2 and 3 on the gold-coated glass substrates. The assignment of the infrared absorption bands observed from the SAMs of 1–3 are summarised in Table 1. The RAIR spectrum of a SAM of 1 is shown in Fig. 2. Fig. 2A shows the strong absorption bands of CH3 (νAS) at 2965 cm−1, CH2 (νAS) at 2922 cm−1, CH3 (νS) at 2879 cm−1 and CH2 (νS) at 2852 cm−1.25 These aliphatic C–H stretches are associated with the 6 non-peripherally substituted alkyl chains and the mercaptoalkyl tether. Also present in the RAIR spectrum are a series of absorption bands between 3105–3000 cm−1 that are incorporated within a broad envelope representing aromatic CH stretches.26,27 Additionally, an absorption band is observed centred at 3302 cm−1, which is assigned to ν(NH).28 In Fig. 2B the following bands have been assigned:26–31 1605 cm−1, benzene C![[double bond, length as m-dash]](https://www.rsc.org/images/entities/char_e001.gif) C stretch; 1570 cm−1, ring stretching, components from C–C and C–N; 1507 cm−1, NH in plane deformation (δip); 1483 cm−1, ring stretching; 1468 cm−1, CH2 deformation (δCH2); 1455 cm−1, CH3 asymmetric deformation; 1434 cm−1, isoindole stretch; 1376 cm−1, CH3 symmetric deformation; 1306 cm−1, ring stretch; 1275 cm−1, ν(CN); 1095 cm−1, CN stretch involving the azo nitrogens; 1065 cm−1, C–H deformation; 1022 cm−1, skeletal mode of the central ring; 880 cm−1, out of plane ring C–H deformation and 725 cm−1, out of plane N–H deformation. The origin of the 1148 cm−1 absorption band present in Fig. 2B cannot be conclusively assigned as it has been described in the literature as a CN stretch involving the azo nitrogens27 and as an in plane CH deformation.30
C stretch; 1570 cm−1, ring stretching, components from C–C and C–N; 1507 cm−1, NH in plane deformation (δip); 1483 cm−1, ring stretching; 1468 cm−1, CH2 deformation (δCH2); 1455 cm−1, CH3 asymmetric deformation; 1434 cm−1, isoindole stretch; 1376 cm−1, CH3 symmetric deformation; 1306 cm−1, ring stretch; 1275 cm−1, ν(CN); 1095 cm−1, CN stretch involving the azo nitrogens; 1065 cm−1, C–H deformation; 1022 cm−1, skeletal mode of the central ring; 880 cm−1, out of plane ring C–H deformation and 725 cm−1, out of plane N–H deformation. The origin of the 1148 cm−1 absorption band present in Fig. 2B cannot be conclusively assigned as it has been described in the literature as a CN stretch involving the azo nitrogens27 and as an in plane CH deformation.30 | ||
| Fig. 2 RAIR spectrum of a SAM of 1. | ||
| Pc Derivative SAM/absorption bands (cm−1) | |||
|---|---|---|---|
| 1 | 2 | 3 | Assignment25–31 |
| 3302 | 3295 | ν(NH) | |
| 3105–3000 | Aromatic ν(CH) | ||
| 2965 | 2963 | 2965 | CH3 (νAS) |
| 2922 | 2924 | 2928 | CH2 (νAS) |
| 2879 | 2878 | 2878 | CH3 (νS) |
| 2852 | 2856 | 2859 | CH2 (νS) |
| 1605 | 1607 | Benzene CC stretch | |
| 1570 | 1565 | Ring stretching, component from C–C and C–N | |
| 1507 | 1507 | NH in plane deformation (δip) | |
| 1483 | 1485 | Ring stretching | |
| 1468 | 1470 | 1467 | CH2 deformation (δCH2) |
| 1455 | 1458 | CH3 asymmetric deformation | |
| 1434 | 1425 | Isoindole stretch | |
| 1376 | CH3 symmetric deformation | ||
| 1306 | 1308 | Ring stretch | |
| 1275 | 1275 | ν(CN) | |
| 1148 | 1148 | CN stretch involving the azo nitrogens or in plane CH deformation | |
| 1095 | 1096 | CN stretch involving the azo nitrogens | |
| 1065 | 1065 | 1069 | C–H deformation |
| 1022 | 1022 | Skeletal mode of the central ring | |
| 880 | 880 | Out of plane ring C–H deformation | |
| 761 | Out of plane ring C–H deformation/out of plane ring deformation | ||
| 725 | Out of plane N–H deformation | ||
The RAIR spectrum of a SAM of 2 is shown in Fig. 3. Fig. 3A shows similarities to Fig. 2A in that strong absorption bands from the aliphatic CH stretches associated with the non-peripheral alkyl chains of the Pc macrocycle are observed. A weak absorption band at 3295 cm−1 is also present, which can be assigned as a ν(NH). It should be noted that the intensity of the ν(NH) absorption band is not as large as that observed for the SAM of 1 (Fig. 2A). Additionally, the envelope of absorption bands between 3105–3000 cm−1 associated with the aromatic CH stretches was not observed for the SAM of 2 as compared with the SAM of 1. Fig. 3B shows absorption bands which are predominantly associated with the macrocycle of the Pc SAM (see Table 1 for assignment).
 | ||
| Fig. 3 RAIR spectrum of a SAM of 2. | ||
The RAIR spectrum of a SAM of 3 is shown in Fig. 4. Fig. 4A shows the strong absorption bands of the aliphatic CH stretches related to the alkyl chains of the Pc macrocycle. The absorption bands due to the ν(NH) and the aromatic CH stretch were not observed. As can be seen from Fig. 4B, none of the absorption bands associated with the Pc macrocycle is present in the spectrum. The absorption bands present in Fig. 4B are those associated with the substituent alkyl chains, viz. CH2 deformation (δCH2) at 1467 cm−1 and the C–H deformation at 1069 cm−1.
 | ||
| Fig. 4 RAIR spectrum of a SAM of 3. | ||
With consideration of the metal surface selection rule, i.e., only vibrational modes with a dipole component perpendicular to the metal surface may be excited and observed,32 the RAIRS data can be used to determine the orientation of the three Pc SAMs upon their respective gold-coated substrates. It is clear from Fig. 2 and 3 that absorption bands associated with the macrocyclic ring (e.g. N–H stretches/deformations, aromatic ν(CH), ring stretching modes and CN stretches/deformations) of the SAMs of 1 and 2 are present in the RAIR spectra. However, the RAIR spectrum of the SAM 3 shows no vibrational modes originating from the Pc macrocyclic ring. The RAIR data suggest that Pc derivatives of 1 and 2 have self-assembled in a different orientation on the gold surface as compared with 3. As the RAIR spectra of the SAMs of 1 and 2 show Pc macrocyclic absorption bands this indicates that the macrocyclic cores of 1 and 2 are inclined with respect to the metal surface. The absence of the Pc macrocyclic absorption bands in the RAIR spectrum of SAM 3 suggests that the aromatic core of the Pc molecules lie parallel to the gold surface. In a previous study,20 a 1,4,8,11,15,18,22 heptadecyl-25-(3-mercaptopropyl)phthalocyanine was self-assembled onto a gold-coated substrate (a Pc derivative again with a C3 anchor chain) and was also found to orientate parallel to the metal surface.
The RAIRS information allows further interpretation of the 1 and 2 SAMs. Fig. 2 and 3 clearly show that while macrocyclic absorption bands are present for both Pc SAMs the relative intensities of these modes are greater for the SAM of 1 as compared to the SAM of 2. The difference in intensity of the absorption bands between the Pc molecules for the two monolayers indicates that the Pc cores of the SAM of 1 are orientated in a more perpendicular configuration with respect to the gold-coated surface as compared to the molecules within the SAM of 2. Therefore, it is clear that all three Pc SAMs (1, 2 and 3) adopt different orientations on the gold-coated substrates. The difference in surface orientation of these SAMs is evidently related to the length of the mercaptoalkyl anchor chain for the three Pcs. It is apparent that the C3 mercaptoalkyl chain of 3 forces the macrocycle to assume a parallel orientation on the gold-coated surface, while the longer chains of C11 and C8, associated with the Pc molecules 1 and 2, respectively, allow the macrocycles to adopt a more perpendicular orientation with respect to the surface, thereby increasing the packing density and molecular ordering of these monolayers.
It is possible that the difference in surface orientation between the SAMs of 1 and 2 is not only due to the length of the mercaptoalkyl chain but also whether the chain length has an odd or even number of carbon atoms. If the mercaptoalkyl anchor chain is considered to be in an all-trans extended configuration25,33 then the Pc macrocycle would adopt a different orientation with respect to the alkyl chain depending on whether its length is odd or even. Therefore the orientation adopted by the SAM of 1 may place it in a configuration that allows it to pack with a greater density compared to that of SAM 2. The parallel surface orientation of the SAM of 3 would confer a reduced packing density as compared to the SAMs of 1 and 2. Such conclusions are supported by Zak et al.34 who reported that longer mercaptoalkyl chain metalloporphyrins orientated in a more perpendicular orientation with respect to the surface.
The presence of both symmetric and asymmetric CH2 stretches in the RAIR spectra of all three Pc SAMs suggests that the 6 substituent alkyl chains of the Pc macrocycles are tilted in relation to the parallel and perpendicular planes of the gold-coated surface. Further information regarding the configuration of these alkyl chains can be obtained by considering the orientation of the Pc macrocycles and from the position of the νAS and νS methylene stretching bands. It has been established that the Pc macrocycle of the SAM of 1 is orientated such that the ring is approaching a perpendicular position in relation to the gold-coated surface. The Pc molecules would therefore be densely packed, ‘face-to-face', with a high degree of order. Such an orientation would allow the alkyl chain substituent groups of neighbouring Pc molecules to adopt an all-trans crystalline packing stabilised by van der Waals interactions. Evidence for such an alkyl chain configuration is provided by the position and width of the methylene stretching vibrations [CH2 (νAS) at 2922 cm−1 and CH2 (νS) at 2852 cm−1] observed in the RAIR spectrum of the SAM of 1 (Fig. 2A) which are indicative of crystalline packing.25,33 The Pc macrocycles in the SAM of 3 have been determined to lie parallel to the gold-coated surface. In such an orientation the alkyl chain substituent groups of the neighbouring Pc molecules would be unable to pack in a crystalline manner and are therefore expected to adopt a disordered state. The methylene stretching vibrations [CH2 (νAS) at 2928 cm−1 and CH2 (νS) at 2859 cm−1] observed in the RAIR spectrum of the SAM of 3 (Fig. 4A) provide evidence that the alkyl chains do assume such a disordered configuration.25,33 The Pc macrocycle in the SAM of 2 adopts an orientation which is intermediate between that of 1 and 3. The Pc molecules are densely packed, albeit less than in the SAM of 1, in a ‘face-to-face' manner with a degree of order. With this type of structural configuration the alkyl chain substituent groups of neighbouring Pc molecules cannot readily form an all-trans crystalline packed structure. Evidence for the reduced density in the packing of the alkyl chains is again provided by the shift to higher frequency for the CH2 stretching vibrations25,33 [CH2 (νAS) at 2924 cm−1 and CH2 (νS) at 2856 cm−1], as observed in the RAIR spectrum of the SAM of 2 (Fig. 3A). A schematic representation of the possible orientation of the three Pc SAMs on the gold-coated substrates is given in Fig. 5.
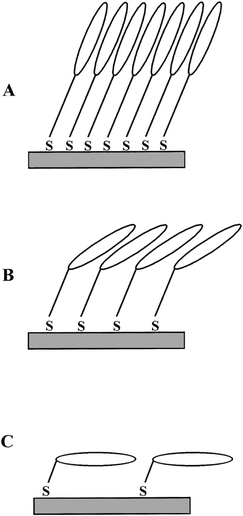 | ||
| Fig. 5 Schematic representation of the possible orientation of the Pc SAMs on the gold-coated substrate (A) SAM of 1, (B) SAM of 2 and (C) SAM of 3. | ||
Visible absorption spectra of Pc SAMs
The strong visible region absorbance characteristic of Pcs gives rise to detectable absorption profiles of each of the three SAMs: visible region absorption spectra obtained from SAMs of 1, 2 and 3 on gold-coated glass substrates are shown in Fig. 6. The visible spectra for each SAM show the characteristic Q band associated with Pc molecules. The Q bands for all three SAMs are broadened relative to those observed in solution for the three Pc derivatives and are blue-shifted by ca. 40 nm. Such broadening of the Q band has been previously observed in the visible spectra of SAMs of non-metallated trichlorosilyl derivative Pcs self-assembled directly onto glass substrates22 and is characteristic of spectra obtained from other solid state formulations.14,35 | ||
| Fig. 6 Visible absorption spectra of SAMs 1–3. | ||
Evanescent wave excited fluorescence of Pc SAMs
The fluorescence emission spectra of the SAMs of Pcs 1, 2 and 3 on gold-coated glass substrates were obtained using a technique based on evanescent wave excited fluorescence spectroscopy.20 Laser radiation was passed along the length of the glass substrate by the means of total internal reflection. At each reflection point along the optical waveguide laser light penetrated through the substrate via the evanescent wave exciting the Pc SAM. The fluorescence spectra for the SAMs of Pcs 1, 2 and 3 obtained using evanescent wave excitation at 633 and 670 nm are shown in Fig. 7 (A and B respectively). The maximum fluorescence emission for the three Pc SAMs occurred at 790 nm. | ||
| Fig. 7 Fluorescence emission spectra of SAMs 1–3 and background substrate excited at (A) 633 nm and (B) 670 nm. | ||
There is a large ‘red-shift' of the fluorescence emission maxima for the three Pc SAMs studied as compared to the solution values (λmax 737, 751, 745 nm for 1, 2 and 3 respectively). The large ‘red-shift' between solution and SAM fluorescence spectra suggests that the macrocycles of the Pc SAMs are ordered as such shifted fluorescence emission spectra are observed for ordered Langmuir–Blodgett films of Pc molecules.35
From the spectra shown in Fig. 7 it is apparent that the mercaptoalkyl chain length tethering the Pc macrocycle to the gold surface affects the intensity of fluorescence emission. In both Fig. 7A and B the SAM of 1 exhibits the greatest intensity of the three Pc derivatives. It is also apparent that the SAM of 3 shows the weakest fluorescence, with the SAM of 2 intermediate between those of 1 and 3. The relative intensity of fluorescence emission from the SAM of 2 is dependent on the wavelength of the laser used to excite the monolayer; the fluorescence emission appears more intense upon using 633 nm excitation (Fig. 7A) which is possibly due to the larger value of ε at this wavelength as compared to 670 nm (Fig. 6). The relationship between intensity of fluorescence versus chain length of tether is possibly due to a number factors. The fluorescence intensity will depend on the number of molecules present in the monolayer film, which may be lower in the apparently less densely packed SAM of 3, and the extent of self quenching, which could be higher for the more densely packed monolayer films of 1 and 2. However, an overriding factor is expected to be the proximity of the Pc molecules to the gold surface. A number of studies have shown that the excited state of a fluorophore positioned near a metal surface is quenched via non-radiative energy transfer processes.36-41 However, by separating the fluorophore from the surface it is possible to obtain fluorescence emission. Assuming that the angular tilts of the mercaptoalkyl anchor chains of the Pc derivatives are similar to those of straight chain alkane thiols, i.e. 20–30° from the surface normal,25,33 the Pc macrocycle within 1, 2 and 3 would be ca. 13 Å, 10 Å and 4 Å respectively from the gold surface.20 This suggests that a distance of at least 12–13 Å between the fluorophore and metal surface is ideally required to obtain significant fluorescence emission from the excited Pc macrocycle.
It is possible that the intensity of fluorescence emission from the SAM of 2 is affected by the macrocycle being separated from the metal surface by an even length alkyl chain, C8 as compared with the odd chain lengths of 1 and 3 (C11 and C3 respectively). As discussed above, variation in orientation between the C11 and C8 tethered Pc SAMs is suggested from the RAIRS data (see Fig. 5). The orientation that the Pc macrocycle assumes in the SAM of 2 may therefore place it in a configuration such that its excited state could be more efficiently quenched than would be expected for an estimated distance of 10 Å from the gold substrate. Any odd–even effect could only be established through the synthesis of Pc derivatives with, e.g., a C7 and C9 mercaptoalkyl anchor chain. Additionally, Pc derivatives containing long mercapto-n-alkane chains (n > 11) would be desirable in order to determine the optimum distance of macrocycle from the metal surface.
Long-term stability of Pc SAMs
A number of studies have shown that straight chain alkane thiols formulated as SAMs oxidise at the thiolate root over a period of time limiting their use in numerous applications.24,42–45 Any potential applications of macrocyclic SAMs would require that the monolayer film possesses long-term stability. In order to investigate the longevity of the Pc SAMs, both RAIR and evanescent wave excited fluorescence spectra were obtained from 1 at regular intervals over a period of 24 months.Fig. 8 shows a RAIR spectrum of a 24 month aged SAM of 1. The RAIR spectrum clearly shows the characteristic absorption bands associated with the Pc macrocycle such as N–H stretches/deformations, aromatic ν(CH), ring stretching modes and CN stretches. The vibrational modes of the macrocycle appear in the same position, with similar intensities to those bands observed in the RAIR spectrum of the freshly prepared SAM of 1 (Fig. 2). However, while the locations of ν(CH2) and ν(CH3), associated with substituent alkyl chains, in Fig. 8A are the same as those seen in Fig. 2A for the freshly prepared SAM, it is apparent that the relative intensities of these stretching modes have changed over the 24 month period. It would appear that while the macrocycle ring of the aged Pc SAM lies in a similar orientation to the original ‘as deposited' SAM of 1, the substituent alkyl chains have relaxed to a different orientation with respect to the gold surface over the period of study. This possibly suggests that the macrocyclic ring of the Pc derivative protects the Au–S bond of the mercaptoalkyl tether preventing oxidation of the thiolate moiety. Such a result is in agreement with studies made on benezenethiol SAMs on gold, albeit that the investigations took place over only a 10 day period.46,47
 | ||
| Fig. 8 RAIR spectrum of an aged (24 month) SAM of 1. | ||
Evanescent wave excited fluorescence emission spectra from the SAM of 1 were recorded and analysed over a period of 24 months. Over the 24 month time period the fluorescence intensity and emission profile of the SAM of 1 were unchanged from that shown in Fig. 7.
Conclusions
The results presented in this paper describe the characterisation of a series of three Pc derivatives formulated as self-assembled monolayers on gold-coated substrates. The orientation of the Pc macrocycles on the gold surface was found to be dependent upon the length of the incorporated mercaptoalkyl anchor chain. When a C11 hydrocarbon chain was used the Pc macrocycles assumed a densely packed and highly ordered orientation with the Pc ring arranged in a near perpendicular configuration with respect to the gold surface. A C3 alkyl anchor chain induced the formation of a less closely packed monolayer in which the Pc macrocycles arranged in a parallel orientation. Evanescent wave excited fluorescence emission spectra could be obtained from the Pc SAMs on the metal surface, the intensity of the emission was again related to the length of the mercaptoalkyl chain length. Importantly, the SAM of Pc 1 was shown to be stable over a period of 24 months which suggests that macrocyclic SAMs possess significant advantages over other SAM systems such as straight chain alkane thiols.Acknowledgements
The authors would like to thank the EPSRC for supporting this work in the form of a studentship for DJR.References
- P. GregoryHigh Technology Applications of Organic Colorants, Plenum Press, New York, 1991. Search PubMed.
- J. E. Kuder, J. Imaging Sci., 1988, 32, 51 Search PubMed.
- R. Ao, L. Kümmert and D. Haarer, Adv. Mater., 1995, 5, 495 CrossRef CAS.
- J. D. Wright, Prog. Surf. Sci., 1989, 31, 1 CrossRef CAS.
- A. W. SnowW. R. Barger in Phthalocyanines Properties and Applications, ed. C. C. Leznoff and A. B. P. Lever, VCH Publishers, New York, 1989, p. 341. Search PubMed.
- D. Wöhrle and D. Meissener, Adv. Mater., 1991, 3, 129 CrossRef CAS.
- A. B. P. Lever, M. R. Hempstead, C. C. Leznoff, W. Lui, M. Melnik, W. A. Nevin and P. Seymour, Pure Appl. Chem., 1986, 58, 1467 CrossRef CAS.
- C. S. Frampton, J. M. O'Connor, J. Peterson and J. Silver, Displays, 1988, 174 CrossRef CAS.
- R. Bonnett, Chem. Soc. Rev., 1995, 19 RSC.
- M. J. Cook, I. Chambrier, S. J. Cracknell, D. A. Mayes and D. A. Russell, Photochem. Photobiol., 1995, 62, 542 Search PubMed.
- S. Baker, G. G. Roberts and M. C. Petty, IEE Proc., Part I: Solid State Electronic Devices, 1983, 130, 260 Search PubMed.
- D. G. Zhu, M. C. Petty and M. Harris, Sens. Actuators B, 1990, 2, 265 CrossRef.
- D. Crouch, S. C. Thorpe, M. J. Cook, I. Chambrier and A. K. Ray, Sens. Actuators B, 1994, 18–19, 411 CrossRef CAS.
- M. J. Cook, J. Mater. Chem., 1996, 6, 677 RSC.
- M. J. Cook, D. A. Mayes and R. H. Poynter, J. Mater. Chem., 1995, 5, 2233 RSC.
- P. S. Vukusic and J. R. Sambles, Thin Solid Films, 1992, 221, 311 CrossRef CAS.
- J. D. Wright, A. Cado, S. J. Peacock, V. Rivalle and A. M. Smith, Sens. Actuators B, 1995, 29, 108 CrossRef.
- T. R. E. Simpson, D. A. Russell, I. Chambrier, M. J. Cook, A. B. Horn and S. C. Thorpe, Sens. Actuators B, 1995, 29, 353 CrossRef.
- T. R. E. Simpson, M. J. Cook, M. C. Petty, S. C. Thorpe and D. A. Russell, Analyst, 1996, 121, 1501 RSC.
- T. R. E. Simpson, D. J. Revell, M. J. Cook and D. A. Russell, Langmuir, 1997, 13, 460 CrossRef CAS.
- I. Chambrier, M. J. Cook and D. A. Russell, Synthesis, 1995, 1283 CrossRef CAS.
- M. J. Cook, R. Hersans, J. McMurdo and D. A. Russell, J. Mater. Chem., 1996, 6, 149 RSC.
- G. C. Bryant, M. J. Cook, T. G. Ryan and A. J. Thorne, Tetrahedron, 1996, 52, 809 CrossRef CAS.
- A. B. Horn, D. A. Russell, L. J. Shorthouse and T. R. E. Simpson, J. Chem. Soc., Faraday Trans., 1996, 92, 4759 RSC.
- M. D. Porter, T. B. Bright, D. L. Allara and C. E. D. Chidsey, J. Am. Chem. Soc., 1987, 109, 3559 CrossRef CAS.
- A. N. Siderov and I. P. Kotlyar, Opt. Spectrosc., 1961, 11, 92.
- H. F. Shurvell and L. Pinzuti, Can. J. Chem., 1966, 44, 125 CAS.
- M. P. Sammes, J. Chem. Soc., Perkin Trans. 2, 1972, 160 RSC.
- M. J. Cook in Spectroscopy of New Materials, ed. R. J. H. Clark and R. E. Hester, Wiley, Chichester, 1993, p. 87. Search PubMed.
- M. Starke and H. Wagner, Z. Chem., 1969, 9, 193 Search PubMed.
- B. Stymme, F. X. Sauvage and G. Wettermark, Spectrochim. Acta, 1979, 35A, 1195 CrossRef.
- B. E. Hayden in Methods of Surface Characterisation Vol. I-Vibrational Spectroscopy of Molecules on Surfaces, ed. J. T. Yates and T. E. Madey, Plenum Press, New York, 1987. Search PubMed.
- R. G. Nuzzo, L. H. Dubois and D. L. Allara, J. Am. Chem. Soc., 1990, 112, 558 CrossRef CAS.
- J. Zak, H. Yuan, M. Ho, L. K. Woo and M. D. Porter, Langmuir, 1993, 9, 2772 CrossRef CAS.
- R. Aroca, G. J. Kovacs, C. A. Jennings, R. O. Loufty and P. S. Vincett, Langmuir, 1988, 4, 518 CrossRef CAS.
- D. H. Waldeck, A. P. Alivisatos and C. B. Harris, Surf. Sci., 1985, 158, 103 CrossRef CAS.
- H. Kuhn, J. Chem. Phys., 1970, 53, 101 CrossRef CAS.
- R. R. Chance, A. Prock and R. Silbey, J. Chem. Phys., 1975, 62, 2245 CrossRef CAS.
- R. R. ChanceA. ProckR. Silbey in Advances in Chemical Physics, ed. I. Prigogine and S. A. Rice, Vol. 37, Wiley, New York, 1978, p. 1. Search PubMed.
- A. Campion, A. R. Gallo, C. B. Harris, H. J. Robota and P. M. Whitmore, Chem. Phys. Lett., 1980, 73, 447 CrossRef CAS.
- A. Adams, R. W. Rendell, W. P. West, H. P. Broida, P. K. Hansma and H. Meliu, Phys. Rev. B, 1980, 21, 5565 CrossRef CAS.
- Y. Li, J. Huang, R. T. McIver Jr. and J. C. Hemminger, J. Am. Chem. Soc., 1992, 114, 2428 CrossRef CAS.
- M. J. Tarlov and J. G. Newman, Langmuir, 1992, 8, 1398 CrossRef CAS.
- M. E. Weisshaar, M. M. Walczak and M. D. Porter, Langmuir, 1993, 9, 323 CrossRef.
- D. A. Hutt and G. J. Leggett, J. Phys. Chem., 1996, 100, 6657 CrossRef CAS.
- J. E. Chadwick, D. C. Myles and R. L. Garrell, J. Am Chem. Soc., 1993, 115, 10364 CrossRef CAS.
- R. L. Garrell, J. E. Chadwick, D. L. Severance, N. A. McDonald and D. C. Myles, J. Am. Chem. Soc., 1995, 117, 11563 CrossRef CAS.
Footnote |
| † Basis of a presentation given at Materials Chemistry Discussion No. 2, 13–15 September 1999, University of Nottingham, UK. |
| This journal is © The Royal Society of Chemistry 2000 |