Explicit chemical speciation by microsecond pulsed glow discharge time-of-flight mass spectrometry: concurrent acquisition of structural, molecular and elemental information†
Vahid Majidi*a, Matt Moserb, Cris Lewisb, Wei Hanga and Fred L. Kingb
aLos Alamos National Laboratory, Chemical Science and Technology Division, MS K484, Los Alamos, NM 87545, USA
bDepartment of Chemistry, West Virginia University, Morgantown, WV 26506-6045, USA
First published on UnassignedUnassigned7th January 2000
Abstract
A microsecond pulsed glow discharge (µs-pulsed GD) was used for elemental, structural and molecular analysis. This plasma was generated repeatedly at 100 Hz with a 1 kV electrical pulse lasting 20 µs. Samples were continuously introduced into the µs-pulsed discharge and allowed to interact with the plasma. Depending on the extent of this interaction, which is controllable at the discretion of the user, the samples may undergo soft chemical ionization yielding molecular ions or may be completely atomized and ionized yielding elemental information. The operator could choose the above interaction zones or anything in between, which provides structural information through an electron ionization type fragmentation pattern. Detection of plasma produced ions was done by time-of-flight mass spectrometry (TOF-MS), which is most suitable for complete mass spectrometric analysis of time-gated transient events. Using ion energetic information and the so-called ‘thermometer molecules', the magnitude of ionization energy available in the discharge was calculated. At 60 µs after the plasma ignition the plasma had an equivalent ionization energy of about 17 eV. The plasma energy decreased as a function of time. At about 300 µs the plasma reached a relatively constant ionization energy of 8–9 eV, which lasted for nearly 200 µs. Toluene, p-xylene, ethylbenzene and tungsten hexacarbonyl are among the molecules analyzed using time-gated µs-pulsed GD-TOF-MS.
Introduction
During the past decade, true chemical speciation has become the Holy Grail for environmental, clinical and nutritional chemists.1–5 Chemical speciation, by definition, is the identification of elements and their chemical environment in a given sample. For many scientists, it is unacceptable merely to know the concentration of elements in a given sample because years of research have clearly shown that the elements in specific chemical environments play distinct roles.6,7 As such, to realize fully the influence of a given element in foods, biological systems, toxicological mechanisms or electronic materials, one must measure the concentration of analytes, determine the elements present and identify the chemical nature or molecular form of these species. Interestingly, each piece of information required for completion of the speciation dossier for an analyte requires a battery of chemical analysis and sample preparation procedures.8The most popular trend for chemical speciation is to utilize coupled techniques, yielding two-dimensional information.9–11 Often, chromatography or an alternative separation technique is used to separate the mixture into its constituent components, then each component is interrogated by some spectroscopic technique. In nearly all cases, the nature of compounds is inferred from their chromatographic properties, and the identification of elements and their relative concentrations are measured via spectroscopic techniques. While this approach provides a significant amount of information, it is not speciation in the true chemical sense. For example, consider a gas chromatography (GC) instrument coupled with an inductively coupled plasma mass spectrometry (ICP-MS) system.12 While GC can separate organometallic compounds based on their volatility and their net interactions with the stationary phase, it does not provide any explicit information with regard to the molecular identity of each component. The molecular identity is inferred through elution time with respect to standard compounds. ICP-MS can easily determine the concentration of analytes and identify the elements present in each component eluted from the GC column. However, it cannot provide any specific information with regard to molecular identity of individual compounds arriving from the GC column. If the above GC system was connected to a typical bench-top quadrupole mass spectrometer with electron ionization (EI), a fragmentation pattern for each molecule could be obtained, but the elemental composition information is not directly evident from the EI mass spectrum. Perhaps replacement of EI with chemical ionization (CI) may prove more useful for the determination of molecular ions for a specific class of compounds. Nonetheless, true chemical speciation is only achieved when multitudes of techniques are used to assess the elemental, molecular and structural information for a given analyte.
Using the multitude of techniques suggested in the above section requires a massive laboratory investment. Furthermore, every sample becomes a research project with no hope for high throughput analytical production facilities. A useful speciation technique should provide the required information in a reasonable time frame. More recently, low-pressure plasmas have been utilized effectively to probe compounds through partial fragmentation.13–15 As with most one-dimensional detection schemes, the information gathered from these systems must be augmented by other analytical schemes, if complete chemical speciation is desired.
Investigators around the globe have devised a plethora of clever techniques through better separation methodologies or more selective detection technologies to improve the quality of information gained from speciation experiments. Coupled techniques, at best, can provide two-dimensional information for a mixture (i.e., only elemental or molecular identity as well as concentration can be ascertained, but not all three). Therefore, to achieve complete success, a speciation detector must be capable of providing at least two different types of information on each pure component. When chromatography is used with this type of detector, a true three-dimensional picture can be assembled for the sample, which in turn translates to true chemical speciation.
The list of requirements for an ideal speciation detector is certainly stringent for any analytical tool. Our group, however, has been able to devise such an instrument. Using microsecond pulsed (µs-pulsed) glow discharge time-of-flight mass spectrometry (GD-TOF-MS) and temporal gating techniques, we have succeeded in obtaining molecular information, elemental information and structural information concurrently from the same instrument. The time frame for a complete experiment yielding molecular, elemental and structural information is less than 1 ms. This paper describes our latest effort at true chemical speciation with a single detector.
Theoretical considerations
Glow discharge is a low-pressure plasma sustained and operated in an elegantly simple device. As stated in a review by Harrison and Hang, ‘one best not overlook the underlying deception in this simplicity, which masks subtle complexities associated with the chemistry and physics of the plasma'.16 In other words, direct current (dc) glow discharge plasmas are steady-state but highly heterogeneous plasmas with a number of dynamic processes occurring simultaneously. Sputtering, Penning ionization, charge exchange, electron bombardment, photon emission, photon absorption and elastic and inelastic collisions are among the processes dominating the dc glow discharge plasma environment.If a pulsed power supply instead of a dc source is used, then a transient glow discharge plasma is obtained. Because the plasma is formed with a temporally discrete electrical pulse, the nature of the plasma is highly time dependent. A schematic representation of pulsed plasma as function of time is shown in Fig. 1. As depicted, the transient plasma has a different relative density and different energetics at different times with respect to the plasma initiation time. In general, electron collision processes have the shortest half-lives, and therefore one would expect that EI may dominate the time region immediately at the onset and after the cessation of the electrical pulse. Because of the high energy densities achieved with pulsed plasmas, during the maximum peak intensity of the electrical discharge one may suspect that the atomization followed by ionization of elements may dominate this temporal region. Lastly, long after the cessation of sputtering events and termination of electron processes, collisions with metastable atoms of the buffer gas (e.g., Ar) or simple collisional charge exchange may dominate this time region.17 For a µs-pulsed glow discharge the entire plasma transition from sputtering to EI to charge exchange and Penning ionization spans less than 1 ms. Therefore, when an analyte other than the cathode material is continuously introduced into the pulsed plasma chamber, one can isolate and observe the specific physico-chemical interactions within the plasma via temporal gating of the detector. If TOF-MS is used for time-gated detection, one may obtain elemental information during the plasma ignition, followed by EI and molecular fragmentation pattern after the termination of the electrical pulse and, finally, molecular ion information during Penning ionization and charge exchange reaction (because of lower energies involved).
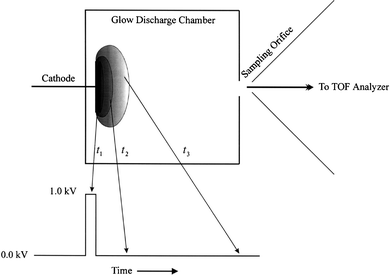 | ||
| Fig. 1 Schematic representation of µs-pulsed glow discharge and relative plasma position/density as a function of time. | ||
It is the temporal isolation of the above processes that is used in our system to acquire concurrently molecular, structural and elemental information for a given analyte (i.e., three-dimensional information). When this technique is combined with chromatographic separation schemes, four-dimensional spectral data on sample mixtures are easily attainable, resulting in true sample speciation within a chromatographic time frame.
Experimental
The glow discharge chamber is constructed of 1 in tubing fixed to an NPT tapped, double-sided 2.75 in conflat flange (MDC, Hayward, CA, USA). A gas inlet port and the chamber pressure monitor (Hasting Teledyne-Raydist, Hampton, VA, USA) are fixed to the NPT tapped ports. A ½ in probe inlet is connected to this chamber, and a 1 mm ion exit orifice facilitates the extraction of ions into the time of flight. A pin cathode geometry is used to control the cathode current density better. These pins are cut from solid copper wire and fixed to the probe tip. A Macor or quartz insulating cap is placed over the feed-through conductor and sample to allow reproducible sputtering of the cathode. The direct insertion probe with the face of the cathode exposed is introduced into the vacuum chamber without breaking the vacuum.As illustrated in Fig. 2, sample introduction was achieved through a leak valve plumbed into the direct insertion probe inlet. An auxiliary roughing pump was used to ensure that the sample introduction rate and sample residence time within the glow discharge chamber could be adjusted at the operator's discretion. Volatile and semi-volatile samples were contained within a sample vial and attached to the metering leak valve (22 Series, Whitey Co., Highland Heights, OH, USA) via a ¼ in Cajon ultra-torr fitting (Swagelok, Macedonia, OH, USA). The sample, direct insertion probe sleeve and the ion source were kept at an elevated temperature using heat tapes.
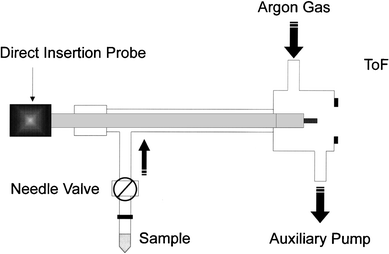 | ||
| Fig. 2 Schematic representation of sample inlet system for gas phase species. | ||
An electronic pulser (Model GRX-3.0 K-H, Direct Energy, Fort Collins, CO, USA) was used to convert the direct current power (Model 1570, Power Design, Westbury, NY, USA) to a train of high voltage pulses, lasting several microseconds. The electronic pulser was controlled by a digital delay generator (Model DG 535, Stanford Research Systems, Sunnyvale, CA, USA). The digital delay generator allows adjustment of pulse width, duty cycle and gate delay position. The initial trigger output from the digital delay generator is positioned at the glow discharge power onset. An internal adjustable delay is then set relative to the initial trigger. This delay triggers the application of a positive potential pulse (with an adjustable width) to the TOF repeller, which will orthagonally inject an ion packet into the flight tube. Adjustment of the temporal position of this injection pulse permit the mass spectrometric monitoring of ions formed during distinct time regions within the plasma pulsed power sequence. A digital storage oscilloscope (Model TDS 520, Tektronix, Beaverton, OR, USA) is used to monitor the power, trigger and injection pulses.
The TOF mass spectrometer has been described previously;18 however, a brief explanation is provided here. The analyzer is an angular type instrument (Model D-850, R. M. Jordan, Grass Valley, CA, USA) operated in the reflectron mode and is orthogonal to the ion beam from the glow discharge source. This orientation facilitates pulsed injection of sample ions in the source region of the TOF-MS system. The GD-TOF-MS operating conditions are presented in Table 1. The optimum operating conditions were determined experimentally. The signal output from the 40 mm dual microchannel plate detector (Galileo Electro-optic, Sturbridge, MA, USA) was collected and stored using a 500 MHz digital storage oscilloscope (Model TDS 520, Tektronix). The data were then imported into a spreadsheet (Microsoft Excel 97, Microsoft, Redmond, WA, USA) for construction of mass spectral plots. Three-dimensional data were plotted with Origin version 3.5 (Microcal Software, Nothampton, MA, USA).
| Glow discharge— | |
| Pressure | 0.4–0.5 Torr |
| Applied potential | 1.0 kV |
| Pulse duration | 20 µs |
| Frequency | 100 Hz |
| Time-of-flight mass analyzer— | |
| Pressure | 5.0 × 10⁻⁶ Torr |
| Repeller pulse duration | 2.5 µs |
| Flight pathlength | 2.0 m |
| Sampler orifice diameter | 1.0 mm |
| Skimmer orifice diameter | 1.0 mm |
| Skimmer potential | −1.9 kV |
| Repeller plate (A1) potential | −0.4 kV |
| Extractor grid (A2) potential | 0.0 V |
| Accelerator potential | −2.0 kV |
| Flight tube potential | −2.0 kV |
| Deflection plate (XY1) potential | −2.4 kV |
| Deflection plate (XY2) potential | −2.0 kV |
| Detector potential | −2.0 kV |
Results and discussion
To evaluate the behavior of cathode material (Cu) and the background buffer gas (Ar) in the absence of analyte, a series of time-resolved µs-pulsed GD-TOF-MS experiments were performed and the results are shown in Fig. 3. As illustrated, at temporal windows up to 100 µs after the initiation of the glow discharge pulse the ions from the buffer gas at 40 (Ar+) and 41(ArH+) atomic mass units (u) dominate the mass spectra. At a 100 µs delay, contaminant ions due to molecular oxygen (m/z 32) and water (m/z 18) are observed. Fragment ions originating from these molecules are also present (i.e., OH+ and O+). At this time window, the cathode material ions (Cu+ isotopes at 63 and 65 u) are also starting to appear. The intensity of Cu+ isotopes continues to increase and reach a maximum at 200 µs. Beyond 200 µs, the intensities of contaminants and buffer gas ions are insignificant, whereas the population of Cu+ isotopes remains abundant well after 500 µs. The temporal behaviors of Ar, H2O, O2 and Cu ions are similar to those reported earlier for µs-pulsed GD.19 From the data presented, it is clear that during the first 100 µs of the plasma lifetime (for µs-pulsed GD) the energetics of the discharge are completely different from those in the latter part of the plasma life cycle. At the onset of the plasma, the energy is deposited predominantly into the buffer gas. This energy is then transferred to the sputtered cathode material through collisional pathways. To illustrate best the utility of temporally resolved µs-pulsed GD-TOF-MS for chemical speciation, we performed a series of experiments on p-xylene, toluene, ethylbenzene and tungsten hexacarbonyl. These experiments were used to assess the analytical performance and the energetics of the proposed system.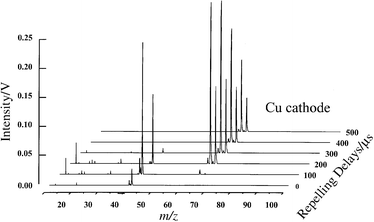 | ||
| Fig. 3 Time resolved µs-pulsed GD-TOF-MS of Cu cathode in Ar buffer gas. | ||
Ethylbenzene
The spectrum of ethylbenzene obtained 45 µs after the plasma ignition is shown in Fig. 4 along with the NIST electron ionization (at 70 eV) reference spectrum. As we described previously for the Cu cathode, background peaks at 16, 18, 32, 40, and 41 u belong to the buffer gas and contaminants (Cu+ ions are not expected at this time window). The agreement between the reference spectrum and our result is good, but not excellent. The main reason for the dissimilarities observed is the total energy deposited during the acquisition of the two spectra. The detail energetics of our system will be discussed later. Disregarding the background ions, the peaks at 1 and 12 u indicate that the analyzed compound is composed of carbon and hydrogen. If metallic species were present, the isotopic abundance could be used for appropriate identification. Assuming that the library search routine was not sufficient to identify this compound (this will be the case for non-volatile organometallic compounds), structural analysis should yield useful information. Fig. 4(C) illustrates the mass spectrum of ethylbenzene obtained at 305 µs after the plasma ignition. From this simple spectrum we can ascertain that the molecular ion has a mass of 106 u and because of the peak at mass 91 u we are assured that the compound is a substituted benzene. Upon ionization, an alkyl substituted benzene will readily rearrange to produce the tropyllium cation through A4 cleavage.20 Simple structural analysis reveals that we must have an alkyl substituted benzene and because of the molecular ion we know that an ethyl group (i.e., 106 − 77 = 29 u) must be the alkyl moiety. The spectrum obtained at 45 µs further verifies the proposed structure due to the presence of cleaved benzene (C6H5+ at 77 u) and the ethyl ions (C2H5+ at 29 u).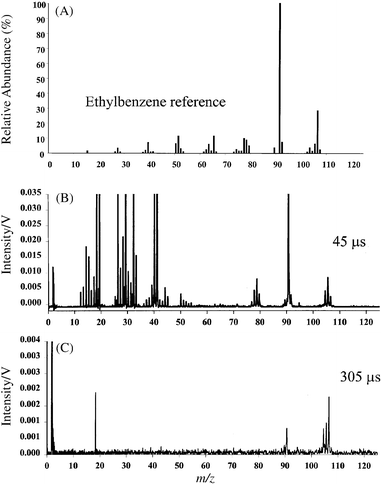 | ||
| Fig. 4 Mass spectra of ethylbenzene: (A) NIST EI reference spectrum obtained at 70 eV; (B) µs-pulsed GD profile obtained 45 µs after the plasma ignition; (C) µs-pulsed GD profile obtained 305 µs after the plasma ignition. | ||
p-Xylene
The complete three-dimensional time-resolved spectrum of p-xylene is illustrated in Fig. 5. This three-dimensional representation shows the true potential and utility of the pulsed GD system for chemical identification and speciation. Because the transient plasma energy changes dynamically and reproducibly, a single pulse can be used to reveal all elemental, molecular and structural information as a function of data acquisition time. Whereas at early times no molecular information is present, the molecular ion and fragments begin to appear 60 µs after the plasma ignition. By 240 µs, the fragment spectrum is nearly depleted with the most intense peak being represented by the molecular ion. A closer comparison of the data collected at 80 µs with the NIST reference spectrum obtained at 75 eV indicates a reasonable match, as shown in Fig. 6. However, it is the combination of pulsed GD data at different time windows that ultimately indicates the nature of the compound present. Fig. 6(C), the mass spectrum of p-xylene collected 470 µs after the plasma ignition, indicates a molecular ion at 106 u, which is identical with the molecular ion for ethylbenzene. The presence of an ion at 91 u in Fig. 6(B) indicates that a substituted benzene is the target molecule. However, because of the lack of ethyl cation or C6H5+, we know that the compound of interest cannot be ethylbenzene. Therefore, the only possible alternative must be a dimethyl-substituted benzene. In reality, the mass spectra for 1,2-dimethylbenzene (ortho-), 1,3-dimethylbenzene (meta-), and 1,4-dimethylbenzene (para-) are nearly identical and relatively useless for the distinction between the three isomers. However, a combination of chromatographic separation and µs-pulsed glow discharge will certainly provide the comprehensive chemical information required for this case. When the same experiment is repeated using a 2 kV GD pulse with a pulse duration of 10 µs, only elemental information is extracted from the sample (Fig. 7). This result is due to the higher power densities achieved within the plasma. Once again, the operating conditions for these plasmas are fully flexible and at the discretion of the operator. The user can program the plasma pulse sequence to extract the exact type of the information required for specific analysis.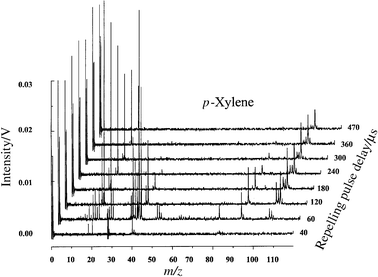 | ||
| Fig. 5 Time resolved µs-pulsed GD-TOF-MS of p-xylene in Ar buffer gas under normal experimental conditions. | ||
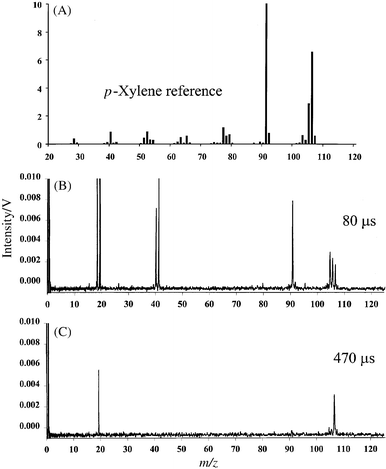 | ||
| Fig. 6 Mass spectra of p-xylene: (A) NIST EI reference spectrum obtained at 75 eV; (B) µs-pulsed GD profile obtained 80 µs after the plasma ignition; (C) µs-pulsed GD profile obtained 470 µs after the plasma ignition. | ||
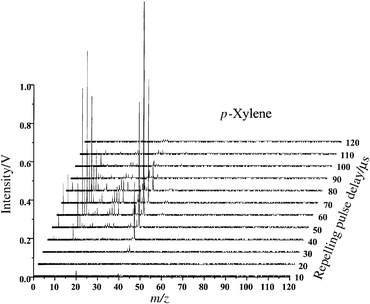 | ||
| Fig. 7 Time resolved µs-pulsed GD-TOF-MS of p-xylene in Ar buffer gas under high peak-power experimental conditions. | ||
Toluene
The spectrum of toluene obtained 45 µs after the plasma ignition is shown in Fig. 8 along with the NIST EI (at 70 eV) reference spectrum. Because of the simple structure of toluene and the relative abundance of background ions at 45 µs, the match between the 70 eV EI spectrum and the GD-TOF spectrum is unacceptable. However, by considering the data obtained at two different times [Fig. 8(C)], one can assess the identity of the analyzed compound. The mass spectrum at 305 µs indicates a molecular ion at 92 u. The mass spectrum at 45 µs shows a base peak at 91 u and two peaks at 63 and 65 u. Interestingly, these do not belong to Cu isotopes because, according to Fig. 3, the Cu signal appears after 100 µs and the 63/65 u peak ratios are exactly opposite the 63Cu/65Cu expected isotope abundance. Therefore, the peaks at 63 and 65 u are fragment ions that may be used to identify the parent molecule. Using this information we can look back at the fragmentation pattern and realize that the original compound at 92 u will yield a base ion at 91 u with fragments at 65 and 63 u and relatively free from other fragmentation. This pattern is now indicative of toluene (92 u) rearranging to tropyllium ion (91 u) followed by cleavage to C5H5+ (a five-membered ring) and C5H3+ (opened ring).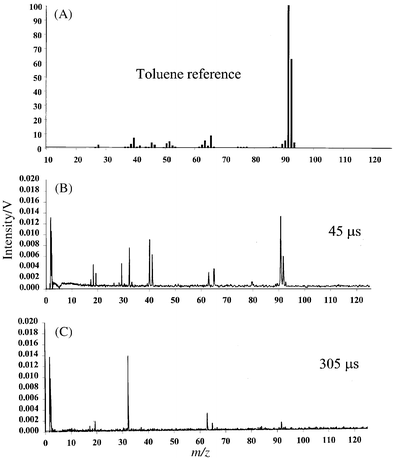 | ||
| Fig. 8 Mass spectra of toluene: (A) NIST EI reference spectrum obtained at 70 eV; (B) µs-pulsed GD profile obtained 45 µs after the plasma ignition; (C) µs-pulsed GD profile obtained 305 µs after the plasma ignition. | ||
Tungsten hexacarbonyl
The motivation behind running the above organic compounds was not to establish the capability of our technique for elemental analysis but to show that µs-pulsed GD-TOF-MS is a powerful tool for molecular and structural analysis. Organic compounds were used for the initial phase of this research because of the vast literature available on ion energetic information and fragmentation patterns. Tungsten hexacarbonyl was used in the following experiments for two reasons. First, W(CO)6 is an organometallic compound which is an ideal platform for demonstrating explicit speciation through identification of molecular ion, fragments and constituent elements. Second, W(CO)6 is a unique molecule, with a well-studied fragmentation pattern, which sometimes is referred to as a thermometer molecule. Depending on the amount of energy deposited into this molecule, 0, 1, 2, 3, 4, 5 and 6 carbonyl ligands are lost at distinct energy intervals. Although many of these energy levels are relatively close to each other, W(CO)6 will provide a range of identifiable plasma energies. For this compound, we shall discuss the mass spectra obtained in the reverse order so that the explanation may be self-evident. Starting with Fig. 9(A), obtained 330 µs after the plasma ignition, we see that this compound exhibits what seems to be a molecular ion at 354 u. In reality, a cluster of four peaks is observed at 350, 351, 352 and 354 u with ratios similar to W isotope ratios. The sensitivity of these measurements is not good enough to register the minor isotope at 248 u. Fig. 9(B) is the mass spectrum of W(CO)6 obtained 240 µs after the plasma ignition. The parent ion cluster at 350 u is still present, but a series of other clusters with similar peak ratios appear at 322–326, 294–298, 266–270, 238–242 and 210–214 u. A closer look reveals that these peak clusters are exactly 28 u apart. Two possible ions that can be responsible for a mass loss of 28 u are N2+ or CO+. While loss of N2+ may be observed from hydrazine-type compounds, loss of five sets of N2+ is highly unlikely. Therefore, the target molecule at 354 u is successively losing one (326 u), two (298 u), three (270 u), four (242 u) and five (214 u) carbonyl ligands. The spectrum of W(CO)6 obtained 180 µs after the plasma ignition is shown in Fig. 10 along with the NIST EI (at 70 eV) reference spectrum. The µs-pulsed GD-TOF-MS spectrum clearly shows a peak cluster corresponding to W+. This spectrum may be compared against a reference library, but the combination of three mass spectra obtained with our system clearly illustrates that one can correctly deduce the target molecule as tungsten hexacarbonyl.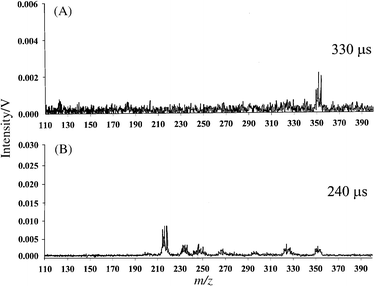 | ||
| Fig. 9 Mass spectra of tungsten hexacarbonyl: (A) µs-pulsed GD profile obtained 330 µs after the plasma ignition; (B) µs-pulsed GD profile obtained 240 µs after the plasma ignition. | ||
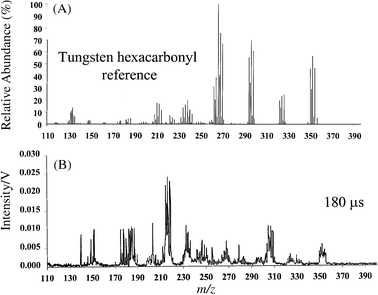 | ||
| Fig. 10 Mass spectra of tungsten hexacarbonyl: (A) NIST EI reference spectrum obtained at 70 eV; (B) µs-pulsed GD profile obtained 180 µs after the plasma ignition. | ||
Time dependent energy deposition
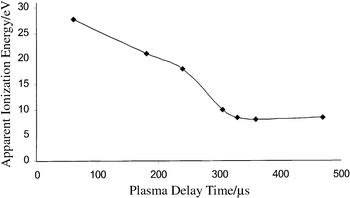
Considering the data presented thus far, it should be apparent that when an analyte is introduced into a transient plasma, it encounters different environments depending on the time of interaction with respect to the plasma initiation time. One must then answer the following question: ‘how energetic is the plasma at a given time?' Using the vast amount of data available in the organic mass spectrometry literature and utilizing the information obtained with our thermometer molecule (tungsten hexacarbonyl), we should be able to estimate the energetics of the plasma at different times. Starting with the discharge buffer gas we know that Ar has a first ionization energy of about 15.8 eV (Ar+), a second ionization energy of 27.7 eV (Ar2+) and the energy of its long-lived metastable (Ar*) is approximately 11.5 eV. Furthermore, a collision between a molecule having an ionization potential of less than 11.5 eV and Ar* will lead to ion formation (Penning ionization).21,22 Because the buffer gas is the most abundant species, we may consider Ar species to be collisionally dominating. Smith and co-workers have shown that in a glow discharge chamber, the Penning ionization efficiency is nearly maximized at 0.5–0.6 Torr pressure (i.e., our operating regime).23The literature values for the appearance energy of toluene fragments and molecular ions along with their appearance times in our GD experiments are given in Table 2. Considering that Ar+ is present 45 µs after the discharge, the minimum ionization energy available to the analyte molecule must be equivalent to the Ar ionization potential of 15.8 eV. Nonetheless, the presence of a C5H5+ ion with an appearance energy of 16.5 eV indicates that available plasma energy is greater than 16.5 eV. At 305 µs, only Cu+ (7.7 eV) and the toluene molecular ion (9.0 eV) are present. The tropyllium ion, requiring >11 eV, does not appear at this time window.
The complete three-dimensional time profile for p-xylene may better illustrate the time-dependent ionization energy available within the transient plasma. The literature values for the appearance energy of p-xylene fragments and molecular ions along with their appearance times in our GD experiments are given in Table 3. The molecular ion, along with tropyllium ion, Ar2+ (doubly ionized argon), Ar+ and Ar2+ are all present at 60 µs after the plasma onset. The presence of Ar2+ in the mass spectrum indicates that at least 27.7 eV of ionization potential must be available in the plasma. At 360 µs, the tropyllium ion is completely removed from the spectrum but the p-xylene molecular ion with an appearance energy of 8.4 eV is present. The molecular ion for p-xylene remains visible up to 470 µs after the discharge (i.e., 8.4 eV of ionization potential is still available).
Lastly, we can exploit the energetics of tungsten hexacarbonyl to map better the time-dependent plasma ionization potential. The literature values for the appearance energy of W(CO)6 fragments and molecular ions along with their appearance times in our GD experiments are given in Table 4. At 180 µs after the discharge W+, requiring approximately 21 eV, can be observed. At 240 µs, WCO+ with an appearance energy of 18 eV can be observed. Lastly, at 330 µs only the molecular ion W(CO)6+ with an appearance energy of 8 eV is observed. Removal of the first CO requires a minimum energy of 9.8 eV. Now, utilizing the information assembled in Tables 2–4, we can construct a plot of apparent plasma energy as a function of time (Fig. 11). The massive electrical power (kW) deposited by the µs pulse is rapidly converted into plasma energy and deposited into the buffer gas and the cathode material. This energy is then transferred to the ground state atoms and molecules in the gas phase. When the highly energetic species are depleted, the long-lived metastables maintain a relatively constant plasma energy for a few hundred microseconds.
 | ||
| Fig. 11 Measured plasma ionization energy as a function of time for µs-pulsed GD. | ||
| Ion | Appearance energy/eV (ref. 30) | Time observed in plasma/µs | Apparent plasma energy at observed time/eV |
|---|---|---|---|
| W+ | 21.0 | 180 | >21.0 |
| WCO+ | 18.4 | 240 | >18.4 |
| W(CO)2+ | 16.3 | 240 | >18.4 |
| W(CO)3+ | 14.1 | 240 | >18.4 |
| W(CO)4+ | 12.2 | 240 | >18.4 |
| W(CO)5+ | 10.3 | 240 | >18.4 |
| W(CO)6+ | 8.6 | 330 | >8.6 |
We should emphasize that although the detection of ions is gated with respect to the GD pulse, the analyte is continuously introduced into the plasma chamber. Therefore, to some extent the lifetime and residence time of certain species may be significantly longer than the observation window. Subsequently, if long lived species are generated at the onset of the plasma and the observation window is set at several hundred microseconds after the plasma ignition, the ions observed may represent a convolution of several species generated earlier. The use of an auxiliary pump on the glow discharge chamber to control the sample residence time has greatly reduced the potential for this time overlap. However, to assess the extent of this time overlap effect future experiments with pulsed nozzle sample introduction will be conducted.
Conclusion
The utility of µs-pulsed GD-TOF-MS for explicit chemical speciation has been vividly demonstrated. The energetics of the pulsed plasma are highly dynamic and cannot be estimated, at this time, for the temporal region which includes the ignition process and up to 40 µs later. Future experiments to evaluate the plasma pulse duration, peak power, chamber pressure, mixed gas buffers, helium metastable population and deliberate CI through appropriate CI agents should greatly enhance the application potential of this system for single component speciation. Multi-component samples will be best analyzed with µs-pulsed GD-TOF-MS coupled with any separation scheme (depending on the sample type).Acknowledgements
This work was supported in part by the Los Alamos National Laboratory through the ADAPT program.References
- Trace Metal Analysis and Speciation, ed. I. S. Krull, Elsevier, New York, 1991. Search PubMed.
- Metal Speciation and Contamination of Soil, ed. H. E. Allen, C. P. Huang, G. W. Bailey and A. R. Bowers, Lewis Publishers, Ann Arbor, MI, 1994. Search PubMed.
- Chemical Speciation in the Environment, ed. A. M. Ure and C. M. Davidson, Blackie, Glasgow, 1995. Search PubMed.
- O. F. X. Donard, B. Lalere, F. Martin and R. Lobinski, Anal. Chem., 1995, 76, 4250 CrossRef.
- R. Lobinski, I. R. Pereiro, H. Chassaigne, A. Wasik and J. Szpunar, J. Anal. At. Spectrom., 1998, 13, 859 RSC.
- T. H. BothwellR. W. CharltonJ. D. CookC. A. Finch, Iron Metabolism in Man, Blackwell, Oxford, 1979. Search PubMed.
- R. Hussain, R. B. Walker, M. Layrisse, P. Clark and C. A. Finch, Am. J. Clin. Nutr., 1965, 16, 464 Search PubMed.
- R. Lobinski, Appl. Spectrosc., 1997, 51, 260A Search PubMed.
- V. Majidi and N. J. Miller-Ihli, Analyst, 1998, 123, 809 RSC.
- M. K. Donais, Spectroscopy, 1998, 13, 30 Search PubMed.
- N. G. Orellana-Velado, R. Pereiro and A. Sanz-Medel, J. Anal. At. Spectrom., 1998, 13, 905 RSC.
- T. De Smaele, L. Moens, R. Dams and P. Sandra, Fresenius' J. Anal. Chem., 1996, 355, 778 CAS.
- J. W. Waggoner, M. Belkin, K. L. Sutton, J. A. Caruso and H. B. Fannin, J. Anal. At. Spectrom., 1998, 13, 879 RSC.
- J. Rodriguez, R. Pereiro and A. Sanz-Medel, J. Anal. At. Spectrom., 1998, 13, 911 RSC.
- M. Belkin, J. W. Waggoner and J. A. Caruso, Anal. Commun., 1998, 35, 281 RSC.
- W. W. Harrison and W. Hang, Fresenius' J. Anal. Chem., 1996, 355, 803 CAS.
- M. Joseph, N. Xu and V. Majidi, Spectrochim. Acta, Part B, 1994, 49, 89 CrossRef.
- R. E. Steiner, C. Lewis and V. Majidi, J. Anal. At. Spectrom., 1999, 14, 1537 RSC.
- W. W. Harrison, W. Hang, X. Yan, K. Ingeneri and C. Schilling, J. Anal. At. Spectrom., 1997, 12, 891 RSC.
- J. W. Cooper, Spectroscopic Techniques for Organic Chemists, John Wiley & Sons, New York, 1980. Search PubMed.
- H. Hotop and A. Niehaus, Z. Phys., 1968, 215, 1395 Search PubMed.
- H. Hotop and A. Niehaus, Z. Phys., 1969, 228, 68 Search PubMed.
- R. L. Smith, D. Serxner and K. R. Hess, Anal. Chem., 1989, 61, 1103 CrossRef CAS.
- J. OlmstedG. M. Williams, Chemistry the Molecular Science, Mosby, Chicago, 1994. Search PubMed.
- S. Tajima and T. Tsuchiya, Bull. Chem. Soc. Jpn., 1973, 46, 3291 CAS.
- M. Klessinger, Angew. Chem., Int. Ed. Engl., 1972, 11, 525 CrossRef CAS.
- H. Helm, K. Stephan and T. D. Mark, Phys. Rev. A, 1979, 19, 2154 CrossRef CAS.
- A. G. Loudon and R. Z. Mazengo, Org. Mass Spectrom., 1974, 8, 179 Search PubMed.
- J. O. Howell, J. M. Goncalves, C. Amatore, L. Klasinc, R. M. Wightman and J. K. Kochi, J. Am. Chem. Soc., 1984, 106, 3968 CrossRef CAS.
- G. D. Michels, G. D. Flesch and H. J. Svec, Inorg. Chem., 1980, 19, 479 CrossRef CAS.
Footnote |
| † US Government copyright. This work was performed under the auspices of the US Department of Energy. |
| This journal is © The Royal Society of Chemistry 2000 |