Low pressure inductively coupled plasma ion source for atomic and molecular mass spectrometry: Investigation of alternative reagent gases for organomercury speciation in tissue and sediment
Bernd Rosenkranz, Gavin O'Connor and E. Hywel Evans*
Department of Environmental Sciences, University of Plymouth, Drake Circus, Plymouth, UK PL4 8AA
First published on UnassignedUnassigned7th January 2000
Abstract
A low pressure ICP has been operated in ‘atomic' and ‘molecular' modes. Atomic mass spectra for methylmercury were obtained when the plasma was sustained in pure helium between 9 and 12 W power, and molecular spectra were obtained at 5 W power in the presence of a reagent gas. Methane, isobutane and ammonia were investigated as reagent gases, with ammonia yielding the best stability and sensitivity. A detection limit of 8 pg was obtained for Me2Hg in ‘atomic' mode, and detection limits of 18, 48 and 20 pg were obtained for MeHgEt, MeHgCl and Me2Hg, respectively, in ‘molecular' mode. Four extraction methods were compared for the determination of methylmercury spiked into sediment, with the best extraction efficiencies of 70–90% being obtained by microwave extraction, both with and without an ethylation step. Two extraction methods were compared for the determination of methylmercury in TORT-2 certified reference material. Microwave extraction with derivatization resulted in a found value of 0.171 ± 0.018 µg g−1 compared to the certified value of 0.152 ± 0.013 µg g−1.
Introduction
The successful combination of mass spectrometry (MS) with the inductively coupled plasma (ICP) has been the method of choice for element-selective determinations in a wide range of samples. The ICP is one of many ionization sources, which can be categorised according to the extent to which they ionize or fragment the analyte compound. Soft ionization sources such as chemical ionization (CI), fast atom bombardment (FAB), electrospray ionization (ESI) and matrix-assisted laser desorption ionization (MALDI) enable the determination of fragment ions of long-chain molecules. Most plasma sources, including the ICP, microwave-induced plasma (MIP) and glow discharge (GD), may be considered as harsh ionization sources. If structural information about a compound is required then the ICP would be inappropriate, and an ionization source such as electron ionization (EI) should be used, but if element-selective detection is paramount then the converse would be true. Hence, there is a need for an ionization source capable of operating in a soft and a harsh ionization mode.The most successful element-selective detector is argon ICP-MS. The major advantage of the ICP is its high thermal temperature, which enables the introduction of aqueous solutions and results in almost complete atomization and ionization without extreme perturbation of the plasma. Other plasma sources such as the MIP can be sustained using a variety of plasma gases, including helium, which may result in more efficient ionization due to the higher ionization energy of this gas. Low pressure (LP) ICP1–3 and MIP4–6 ion sources have also been investigated for the formation of both atomic and molecular ions, most successfully in combination with gas chromatography (GC). Evans et al.7 investigated the use of a LP-ICP, formed using helium and operated at low power, for the production of mass spectra similar to those of an EI source, for a series of organometallic and halogenated compounds introduced by GC. By increasing the power and the pressure inside the plasma the fragmentation increased. At about 150 W and 10 mbar the fragmentation was complete and the analytes were completely atomized. A Penning ionization source has also been used to provide a tuneable degree of fragmentation on a series of gaseous organic compounds.8 Caruso and co-workers have investigated GD sources9–12 for the speciation of a range of compounds, including organotin and organolead, and observed molecular fragmentation of the analyte compounds. From these studies it has become obvious that a low pressure plasma source is capable of being operated in a tuneable mode. Recently, a customised designed instrument has been assembled to investigate further the use of a LP-ICP as a tuneable source.13 Initial studies using this instrument14,15 have indicated that, by altering the composition of the plasma gas alone, it is possible to utilise the LP-ICP as a soft ionization source, yielding spectra similar to those of a CI source, or as a harsh ionization source which provides only elemental information, such as an atmospheric ICP. Furthermore, the source can be operated in a tuneable mode between hard and soft ionization regimes. In the present study, a variety of different reagent gases were investigated for use in modifying the ionization conditions in a LP-ICP, and the application of the technique to the determination of methylmercury in marine samples was investigated.
Experimental
Instrumentation
A detailed description of the LP-ICP-MS system used in these studies has been given previously.13,14 In brief, a Hewlett-Packard Mass Selective Detector (MSD), with a custom-made ion sampling interface, was used to analyse and detect ions from the LP-ICP. The low pressure plasma was sustained using a modified rf generator and matching network, in a 140 mm long quartz tube of 1/2′′od, with a 1/4′′od side arm, to which a calibration vial containing perfluorotributylamine (PFTBA) was attached. The quartz plasma torch was connected to the ion sampling interface via a low pressure sampling cone (University of Plymouth), which was machined from aluminium, had a 2 mm orifice and an Ultra-torr fitting for a 1/2′′ pipe. This enabled a vacuum seal to be formed between the low pressure torch and the ion sampling interface. Reagent gases were added to the plasma gas via the side arm of the quartz torch and controlled using a scaled needle valve (Edwards, West Sussex, UK). Typical operating conditions are shown in Table 1.| Parameter | Range studied | Atomic mode | Molecular mode | Pseudo-molecular mode |
|---|---|---|---|---|
| LP-ICP-MS: | ||||
| Forward power/W | 4–12 | 9 | 5 | 5 |
| Reflected power/W | 0 | 0 | 0 | 0 |
| Methane/ml min−1 | 0–3.5 | 0 | 0 | 0 |
| Isobutane/ml min−1 | 0–1.2 | 0 | 0 | 0 |
| Ammonia/ml min−1 | 0–2.4 | 0 | 0.09 | 0 |
| Hydrogen/ml min−1 | 0–1.9 | 0 | 0 | 0 |
| Torch pressure/Torr | 0.2 | 0.2 | 0.2 | 0.2 |
| Interface pressure/Torr | 0.005 | 0.005 | 0.005 | 0.005 |
| Analyser pressure/Torr | <1 × 10⁻⁶ | <1 × 10⁻⁶ | <1 × 10⁻⁶ | <1 × 10⁻⁶ |
| Gas chromatograph: | ||||
| Injector | Cold on-column | |||
| Column | DB1, 30 m × 0.32 mm id | |||
| Carrier flow/ml min−1 | 3 | |||
| Injection volume/µl | 1–1.5 | |||
| Oven temperature/°C | 40–140![[thin space (1/6-em)]](https://www.rsc.org/images/entities/char_2009.gif) °C at 20 °C at 20![[thin space (1/6-em)]](https://www.rsc.org/images/entities/char_2009.gif) °C min−1 °C min−1 | |||
A gas chromatograph (PU4550, Pye Unicam, Cambridge, UK), fitted with an on-column injector, was interfaced to the LP-ICP-MS by way of a heated transfer line.13 The GC capillary column (DB-1, 30 m × 0.32 mm id with a 0.25 µm film thickness, J & W, Fisons, Loughborough, Leicestershire, UK) was passed through the heated transfer line and into the low pressure torch, and a vacuum seal was made with a combination of Ultra-torr and Swagelock fittings. Typically, 1 µl of pentane solution was injected on-column and the GC oven was ramped from 35 to 150![[thin space (1/6-em)]](https://www.rsc.org/images/entities/char_2009.gif) °C at 25
°C at 25![[thin space (1/6-em)]](https://www.rsc.org/images/entities/char_2009.gif) °C min−1. The carrier gas flow rate was 3 ml min−1 of helium at a column head pressure of 85 kPa.
°C min−1. The carrier gas flow rate was 3 ml min−1 of helium at a column head pressure of 85 kPa.
Data were acquired on a Hewlett-Packard MS workstation, with HP59970A (Version 3.1) software, which was interfaced to the MSD. To obtain mass spectra the instrument was operated in scanning mode, and the mass range 50–350 m/z was monitored. For quantitative determinations the instrument was operated in selective ion monitoring (SIM) mode, allowing selected atomic and fragment ions to be monitored.
Reagent gases were introduced through the side arm of the torch and controlled by a needle valve. The amount was determined at atmospheric pressure at several needle valve settings and recalculated for low pressure conditions using Poiseuille's law.16
Reagents and standards
Standards were diluted in pentane (HPLC-grade, Rathburn Chemicals, Walkerburn, Scotland, UK) to the required concentration. Diethylmercury and dimethylmercury were obtained from Johnson (Gillingham, Dorset, UK), methylmercury chloride was obtained from Alfa (Karlsruhe, Germany), sodium peroxodisulfate, potassium bromide and copper sulfate were obtained from Fluka (Gillingham, Dorset, UK), nitrogen (99.9%), hydrogen (99%), ammonia, and isobutane (99%) were obtained from Air Products (Cheshire, UK), and the derivatization reagent sodium tetraethylborate was obtained from Strem Chemical (Old Glossop, Derbyshire, UK).Analysis of samples
Method 1.. This method was a variation of the Westöö method and is described in detail elsewhere.17 In brief, approximately 0.5 g of sediment was placed in a 10 ml Pyrex flask and 4 ml of an acidic solution of sodium bromide and copper sulfate (3∶1 ratio in 5% H2SO4) were added to free bound mercury. This step was followed by a solvent–solvent extraction with 1 ml of pentane and shaking overnight. After centrifugation (2500 rpm), the organic layer was removed and subjected to a clean-up step.17 Finally, the organic phase was dried using Na2SO4 and injected on-column.
Method 2 (acidic leaching).. Approximately 0.8 g of sample was placed in a 10 ml Pyrex flask, 1.5 ml of concentrated nitric acid were added, vortex shaken for 5 min, then dried at 80
![[thin space (1/6-em)]](https://www.rsc.org/images/entities/char_2009.gif) °C for 6 h. De-ionized doubly distilled water was added and the pH adjusted to between 4 and 5. Sodium tetraethylborate (NaBEt4) (0.2% m/m)18 was then added to ethylate the methylmercury and the solution solvent-extracted with three successive 0.3 g portions of pentane. The pentane extract was dried over Na2SO4 and injected on-column.
°C for 6 h. De-ionized doubly distilled water was added and the pH adjusted to between 4 and 5. Sodium tetraethylborate (NaBEt4) (0.2% m/m)18 was then added to ethylate the methylmercury and the solution solvent-extracted with three successive 0.3 g portions of pentane. The pentane extract was dried over Na2SO4 and injected on-column.Method 3 (microwave-assisted leaching and ethylation).. Approximately 0.5 g of sample and concentrated nitric acid were placed in a reaction vessel and exposed to a microwave field at 150 W for 5 min (domestic microwave oven). After microwave digestion, samples were diluted with water, the pH being adjusted to 4 using a basic buffer, then extracted three times into a solution of 1 ml of NaBEt4 solution and 1.0 g of pentane, and centrifuged at 2500 rpm. An aliquot of the supernatant was injected on-column after drying over Na2SO4.
Method 4 (microwave-assisted leaching).. This method was identical with method 3, except that the NaBEt4 ethylating reagent was omitted.
In addition to the above, methylmercury chloride (250 ng g−1 as Hg) was prepared in both aqueous and pentane solution, and 1.5 ml spikes of each of these solutions were added in triplicate to separate samples of sediment (approximately 1 g each). After storage with the other samples they were treated by either evaporating the pentane-spiked samples to dryness and analysing the samples, or by filtering the aqueous layer and analysing the filtrate and sediment separately, to determine whether all the methylmercury was absorbed by the sediment. In this case only method 4 was used for extraction.
All solutions were analysed in ‘atomic' mode by monitoring the 202Hg+ ion, and in ‘molecular' mode by monitoring the 217HgMe+ fragment ion with ammonia as the reagent gas.
Method 1.. This method was the same as method 1 for the sediment samples.
Method 2 (basic leaching).. Approximately 0.5 g of freeze-dried tissue was placed in a 15 ml vial, and 2 ml of sodium hydroxide solution (10% m/m) were added. After digestion at 80
![[thin space (1/6-em)]](https://www.rsc.org/images/entities/char_2009.gif) °C for 4 h, the pH was adjusted to 4 using 0.5 ml of concentrated acetic acid and 3 ml of buffer solution, then 1.5 ml of NaBEt4 solution in water (0.4% m/m) were added and shaken for 1 h. The solution was extracted into pentane, centrifuged at 2500 rpm and the supernatant was injected on-column.19
°C for 4 h, the pH was adjusted to 4 using 0.5 ml of concentrated acetic acid and 3 ml of buffer solution, then 1.5 ml of NaBEt4 solution in water (0.4% m/m) were added and shaken for 1 h. The solution was extracted into pentane, centrifuged at 2500 rpm and the supernatant was injected on-column.19Results and discussion
Effect of reagent gases
A previous study14 has shown that it is necessary to add isobutane as a reagent gas to the LP-ICP in order to promote the fragmentation of organohalide species below a threshold concentration. However, this was not necessary for tetraethyllead.15 In order to study this phenomenon further, the effect of methane, isobutane and ammonia on the fragmentation and ionization of organomercury compounds was investigated.The effect of reagent gas flow rate and power on the signal intensity for the CH3Hg+ fragment ion is shown in Fig. 1, for each of the reagent gases. For each of the gases there was a distinct optimum at a power between 5 and 7 W, and a gas flow between 0.09 and 0.17 ml min−1. The corresponding mass spectra obtained under optimum conditions are shown in Fig. 2(a), 2(b), 3(a) and 3(b) for methane, isobutane, ammonia and pure helium (at higher power), respectively. It has been shown that, in the presence of helium, which has a relatively high recombination energy of 24.6 eV, ionization occurs by charge transfer to form an unstable molecular ion with high internal energy, with subsequent extensive fragmentation.20 This seems to be the case here (Fig. 2 and 3), with the major ions being Hg+ and CH3Hg+ (e.g. at m/z 202 and 217), and probable existence of neutral Hg· and CH3Hg·. However, it is likely that several other processes also occurred. For example, protonation to form [Hg + H]+ at m/z 203 and [CH3Hg· + H]+ at m/z 218 [Fig. 2(b)]; electrophilic addition with the C4H9+ reagent ion of isobutane to form the fragments at m/z 271–277 [Fig. 2(b)]; and anion abstraction with ammonia to form [CH3Hg − H]+ [Fig. 3(a)]. Interpretation of the mass spectra is complicated by the propensity for atmospheric air and water vapour to leak into the system and the polymerisation of isobutane after several hours of isobutane introduction at 0.12 ml min−1, such that a thin coating of polymer inside the torch was visible.
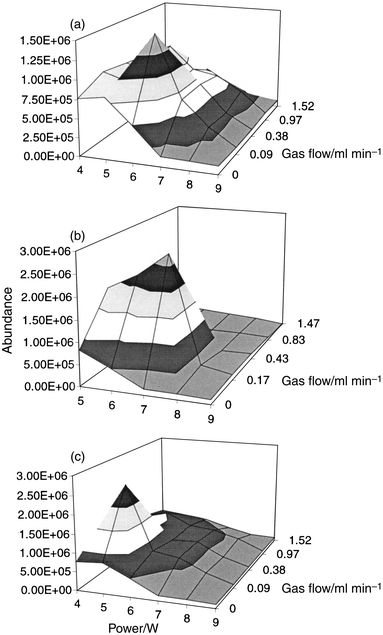 | ||
| Fig. 1 Effect of reagent gas flow and power on the signal intensity of the fragment ion at m/z 217 resulting from a 1 ng injection of methylmercury chloride: (a) methane; (b) isobutane; (c) ammonia. | ||
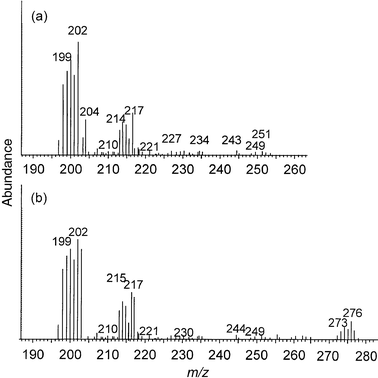 | ||
| Fig. 2 Mass spectrum of a 1 ng injection of methylmercury chloride in the presence of reagent gases: (a) methane; (b) isobutane. | ||
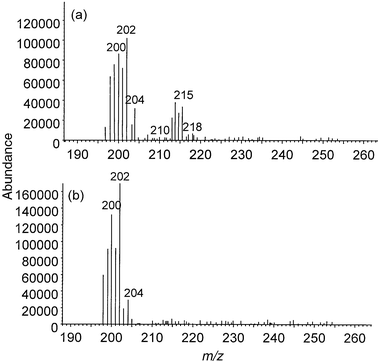 | ||
| Fig. 3 Mass spectrum of a 2.5 ng injection of methylmercury chloride operated in molecular and atomic modes: (a) molecular mode—ammonia reagent gas, 5 W power; (b) atomic mode—pure helium plasma, 9 W power. | ||
The effect of power on the signal intensity of MeHg+, under the optimum reagent gas flow, is summarised in Fig. 4. It can be seen that fragmentation was highly dependent on power, such that the intensity of the fragment ion decreased exponentially as power was increased. At a power of 9 W, for pure helium, the mass spectrum was comprised almost solely of the atomic ions of Hg [Fig. 3(b)]. In this ‘atomic mode' the instrument was operating as an element-selective detector, whereas at a power of 5 W with ammonia present [Fig. 3(a) and Fig. 4], the instrument was in ‘molecular mode', operating as a qualitative mass spectrometer. It should be noted that, in order to operate the instrument in the ‘atomic mode', it was not sufficient merely to eliminate the reagent gas, but it was also necessary to increase the power to 9 W. This is shown clearly in Fig. 1, where the signal for MeHg+ was still fairly high at 5 W even in the absence of reagent gas, but reduced to almost zero at 9 W power.
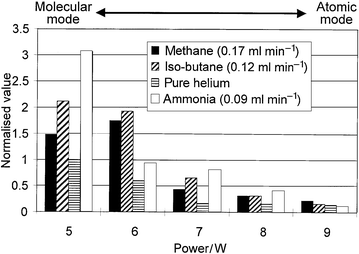 | ||
| Fig. 4 Summary of the effects of different reagent gases on the signal intensity for the fragment ion at m/z 217. | ||
The addition of hydrogen had no positive effect on the formation of molecular ions. Initial studies of the effect of hydrogen on the fragmentation of PFTBA indicated that hydrogen greatly increased the atomic ion abundance; hence, hydrogen was not studied further.
Ammonia was subsequently chosen as the best reagent gas because it yielded the most stable and intense mass spectra, and did not give rise to polymerisation products in the torch.
Figures of merit
Figures of merit for the LP-ICP-MS operated in different modes are shown in Table 2. The best detection limit for Me2Hg was achieved in ‘atomic' mode because sensitivity for the 202Hg+ ion was maximum under these conditions, and no molecular fragments were present. A comparable detection limit was obtained in ‘molecular' mode, indicating the very high abundance of this ion even when incomplete atomization occurred.| Analyte injected | m/z (ion) monitored | Mode of operation | LODa/pg | RSD (%) | Slope/counts ng−1 | Linear rangeb | r2 |
|---|---|---|---|---|---|---|---|
| aCalculation based on five measurements per value, 3σ/slope. bExpressed as orders of magnitude of concentration. | |||||||
| Me2Hg | 202 (Hg+) | Atomic | 8 | 2.8 | 126![[thin space (1/6-em)]](https://www.rsc.org/images/entities/char_2009.gif) 824 824 | 3 | 0.9987 |
| Me2Hg | 202 (Hg+) | Molecular | 20 | 3.4 | 109![[thin space (1/6-em)]](https://www.rsc.org/images/entities/char_2009.gif) 741 741 | 3 | 0.9971 |
| MeHgCl | 217 (MeHg+) | Pseudo-molecular | 112 | 10.5 | 11![[thin space (1/6-em)]](https://www.rsc.org/images/entities/char_2009.gif) 508 508 | 2 | 0.9648 |
| MeHgCl | 217 (MeHg+) | Molecular | 48 | 9.2 | 25![[thin space (1/6-em)]](https://www.rsc.org/images/entities/char_2009.gif) 412 412 | 2 | 0.9751 |
| MeHgEt | 217 (MeHg+) | Pseudo-molecular | 23 | 5.2 | 105![[thin space (1/6-em)]](https://www.rsc.org/images/entities/char_2009.gif) 192 192 | 2 | 0.9979 |
| MeHgEt | 217 (MeHg+) | Molecular | 18 | 4.7 | 117![[thin space (1/6-em)]](https://www.rsc.org/images/entities/char_2009.gif) 836 836 | 2 | 0.9985 |
For the other compounds studied, the LP-ICP-MS was operated in both ‘molecular' and ‘pseudo-molecular' modes (i.e. the power was reduced to 5 W but the reagent gas was excluded). Detection limits for the MeHg+ fragment ion at m/z 217 were comparable in both modes of operation; however, addition of the reagent gas resulted in a better fragmentation pattern, so this was the preferred option.
Analysis of samples
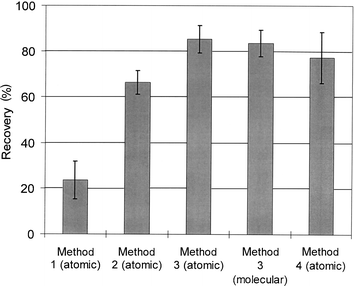 | ||
| Fig. 5 Recovery of MeHgCl spike from sediment using four different extraction methods. Detection was performed in atomic mode, except for method 3 where both atomic and molecular modes were used. See text for explanation. | ||
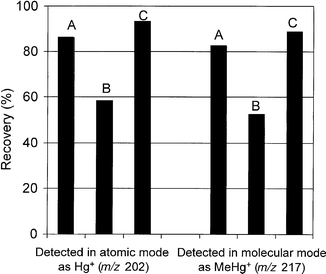 | ||
| Fig. 6 Recovery of MeHgCl spike from sediment using extraction method 4 and by using both the atomic and molecular modes: A, total recovery after spiking with pentane solution; B, recovery from sediment residue after filtration and spiking with aqueous solution; C, recovery from sediment + filtrate after spiking with aqueous solution. | ||
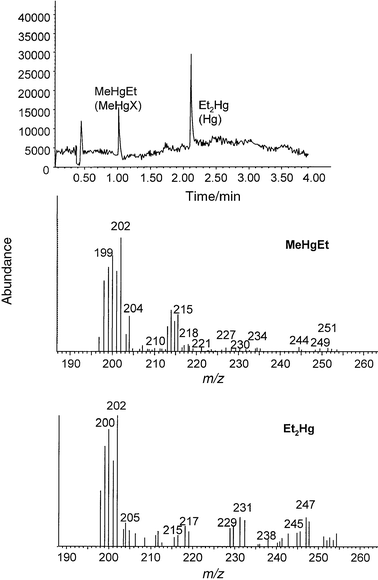 | ||
| Fig. 7 Total ion chromatogram of TORT-2 extract and mass spectra corresponding to the two analyte peaks, obtained using molecular mode. | ||
| Found value as Hg (n = 5)/µg g−1 | ||
|---|---|---|
| Certified value as Hg/µg g—1 | Method 1 | Method 2 |
| 0.152 ± 0.013 | 0.192 ± 0.023 | 0.171 ± 0.018 |
Conclusions
A low pressure ICP has been operated in ‘molecular' and ‘atomic' modes. When the plasma was sustained in helium at 7 ml min−1 and at 9 W power (‘atomic' mode), atomic mass spectra for methylmercury were obtained. When operated at 5 W with the addition of a reagent gas (‘molecular' mode), molecular fragment ions were obtained. In the latter case the ionization mechanism may be a combination of electron impact, charge transfer, and chemical ionization, although further work is needed to elucidate the most probable mechanisms. The technique was successfully applied to the determination of methylmercury in spiked sediment and TORT-2 certified reference material.Acknowledgements
The authors thank British Petroleum and the Nuffield Foundation, and the European Community for providing a Marie Curie Fellowship to B.R.References
- E. H. Evans and J. A. Caruso, J. Anal. At. Spectrom., 1993, 8, 427 RSC.
- T. M. Castillano, J. J. Giglio, E. H. Evans and J. A. Caruso, J. Anal. At. Spectrom., 1994, 9, 1335 RSC.
- X. Yan, T. Tanaka and H. Kawaguchi, Appl. Spectrosc., 1996, 50, 182 Search PubMed.
- R. A. Heppner, Anal. Chem., 1983, 55, 2170 CrossRef CAS.
- E. Poussel, J. M. Mermet, D. Deruaz and C. Beaugrand, Anal. Chem., 1988, 60, 923 CrossRef CAS.
- L. K. Olson, C. W. Story, J. T. Creed, W. Shen and J. A. Caruso, J. Anal. At. Spectrom., 1990, 5, 471 RSC.
- E. H. Evans, W. Pretorius, L. Ebdon and S. Rowland, Anal. Chem., 1994, 66, 3400 CrossRef CAS.
- M. Kohler and U. P. Schlunegger, J. Mass Spectrom., 1995, 30, 134 CAS.
- L. K. Olson, M. Belkin and J. A. Caruso, J. Anal. At. Spectrom., 1996, 11, 491 RSC.
- M. Belkin, L. K. Olson and J. A. Caruso, J. Anal. At. Spectrom., 1997, 12, 1255 RSC.
- M. Belkin, J. W. Waggoner and J. A. Caruso, Anal. Commun., 1998, 35, 281 RSC.
- T. Gorecki, M. Belkin, J. A. Carso and J. Pawlyszyn, Anal. Commun., 1997, 34, 275 RSC.
- G. O'Connor, L. Ebdon, E. H. Evans, H. Ding, L. K. Olson and J. A. Caruso, J. Anal. At. Spectrom., 1996, 11, 1151 RSC.
- G. O'Connor, L. Ebdon and E. H. Evans, J. Anal. At. Spectrom., 1997, 12, 1263 RSC.
- G. O'Connor, L. Ebdon and E. H. Evans, J. Anal. At. Spectrom., 1999, 14, 1303 RSC.
- P. W. Atkins, Physical Chemistry, Oxford University Press, Oxford, 4th edn., 1990. Search PubMed.
- H. E. L. Armstrong, W. T. Corns, P. B. Stockwell, L. Ebdon and E. H. Evans, Anal. Chim. Acta., 1999, 390, 245 CrossRef.
- S. Rapsomanikis, Analyst, 1994, 119, 1429 RSC.
- E. Jantzen and A. Prange, Fresenius' J. Anal. Chem., 1995, 353, 28 CrossRef CAS.
- Practical Organic Mass Spectrometry, ed. J. R. Chapman, Wiley, Chichester, 2nd edn., 1993. Search PubMed.
- J. B. Westmore and M. M. Alauddin, Mass Spectrom. Rev., 1986, 5, 381 CAS.
| This journal is © The Royal Society of Chemistry 2000 |
