The use of a hollow cathode glow discharge (HCGD) as an atomic emission spectrometric element specific detector for chlorine and bromine in gas chromatography
C. Schepersa and J. A. C. Broekaert*b
aDepartment of Chemistry, University of Dortmund, D-44221, Dortmund, Germany
bInstitute for Analytical Chemistry, University of Leipzig, Linnéstrasse 3, D-04103, Leipzig, Germany.. E-mail: broekaer@sonne.tachemie.uni-leipzig.de
First published on UnassignedUnassigned7th January 2000
Abstract
The use of a dc hollow cathode glow discharge (HCGD) as an element specific detector for chlorinated and brominated hydrocarbons was investigated. An interface was constructed which allows the coupling of a gas chromatograph with a demountable HCGD using metal (Cu, Al, Mg) or graphite cathodes, helium as the working gas (pressure 0.8 kPa) and currents of about 30–60 mA at preset voltages ranging from 350 to 1000 V. In order to obtain optimum conditions for the determination of halogenated hydrocarbons, the influence of the dimensions and the materials of the cathode on the signals for the Cl and Br lines in the visible region was evaluated. After optimising the plasma parameters with the Cl![[thin space (1/6-em)]](https://www.rsc.org/images/entities/char_2009.gif) II 479.454 nm and BrII 478.550 nm atomic emission lines, detection limits of 3 pg s−1 for chlorine and 5 pg s−1 for bromine were obtained, which depended on dilution of the working gas with the organohalogen compounds. The linear dynamic ranges were found to extend from 50 to 1500 pg s−1 for Cl and from 100 to 3500 pg s−1 for Br. The detection of 1-bromo-3-chloropropane, 1-bromo-2-chloroethane and dichloromethane at the low pg s−1 level was possible.
II 479.454 nm and BrII 478.550 nm atomic emission lines, detection limits of 3 pg s−1 for chlorine and 5 pg s−1 for bromine were obtained, which depended on dilution of the working gas with the organohalogen compounds. The linear dynamic ranges were found to extend from 50 to 1500 pg s−1 for Cl and from 100 to 3500 pg s−1 for Br. The detection of 1-bromo-3-chloropropane, 1-bromo-2-chloroethane and dichloromethane at the low pg s−1 level was possible.
1 Introduction
For elemental determinations in gaseous samples with atomic emission spectrometry, various plasma sources have been proposed. Apart from the ICP1 and the DCP, the MIP2 has been used to a wide extent. However, glow discharges have also been used for gas analyses.3 Also, as the need for element specific detection in gas chromatography emerged more investigations with glow discharges for element specific detection have been carried out.4–11Among glow discharges, the hollow cathode glow discharge (HCGD) offers the highest power of detection, because of the long residence time of the analyte in a low pressure plasma with well-defined dimensions. Moreover, it has low equipment costs and it can be used with very low gas flows. There, the HCGD can be considered as an alternative to electron capture detection12 in gas chromatography and the high power of detection of hollow cathode glow discharges should permit detection limits for halogens in the low pg s−1 range.
In this work, a demountable HCGD and an interface, which allowed easy coupling to a common gas chromatograph, were constructed. With this set-up, the detection of several chlorinated and brominated hydrocarbons was investigated. The optimum parameters for the power and pressure with respect to the intensities, which means normalized peak heights, of the observed atomic emission lines were investigated and different materials for the cathode and different geometries of the electrode were examined. The analytical figures of merit of the set-up were demonstrated for the detection of toxicologically relevant halogenated hydrocarbons in gas chromatography.
2 Apparatus
A diagram of the hollow cathode used is presented in Fig. 1(a). The HCGD is made of brass and has two windows for both end-on and side-on radiation measurements. The lamp can be evacuated down to 0.01 kPa. The sample gas is brought into the discharge through a steel capillary on which the cathode is mounted. It enters the hollow cathode plasma through a hole in the bottom of the hollow cathode. The cathode is a tube with an outer diameter of 8 mm and an inner diameter of 4 mm and its dimensions are shown in Fig. 1(b). Only the cavity is covered with the discharge, as a quartz tube shields the outer wall of the electrode. The capillary is shielded as well by a quartz tube, so as to prevent parasitary discharges along the capillary itself. | ||
| Fig. 1 (a) Hollow cathode glow discharge: general view. (b) Dimensions of the cathodes: Q1 = 8 mm, Q2 = 4 mm, Q3 = 0.55 mm, Q4 = 2 mm, a = 10/15/20/25/30 mm, b = 5 mm and c = 10 mm. (c) Interface between gas supply and hollow cathode glow discharge lamp. | ||
The power for the discharge is also coupled to the cathode by the steel capillary. For electrical isolation, it is surrounded by a quartz capillary with an outer diameter of 2 mm. The length of the cathode will be shown to have a considerable influence on the atomic emission line intensities.
To couple the HCGD with the gas chromatograph, an interface, as shown in Fig. 1(c), was constructed. It consists of a glass enclosure around the steel capillary, which is insulated by the quartz tube. A metal piece houses the steel capillary and is placed in the glass enclosure. The steel capillary is powered and kept by the power supply at negative high voltage through a tungsten connector entering the glass enclosure vacuum tight and fused to the electrode support. At the end of the capillary, a glass tube bearing a conventional GC fitting at the other end is used for the sample inlet. Detailed information on the components of the instrumentation is given in Table 1.
| Monochromator | 0.7 m Czerny–Turner vacuum monochromator, grating 70 × 70 mm2, constant a = 1/2400 mm. |
| Labtest (Victoria, Australia) | |
| Photomultiplier | Hamamatsu (Middlesex, NJ, USA), R166 UH/84.2 |
| HCGD | Brass |
| Power supply | Hüttinger Elektronik (Freiburg i. Breisgau, Germany), IGD 05/13500 LH |
| Capillary heating | Resistive heating up to 250°C |
| Cryostat | Julabo (Seelbach, Germany), F25 |
| Gas chromatograph | Carlo Erba (Milan, Italy), 6130 |
| Column | Macherey–Nagel (Düren, Germany), SE 54 Widebore |
| 1-Chlorooctane | Merck (Darmstadt, Germany), 806903 |
| 1-Bromo-2-chloroethane | Merck, 818870 |
| Helium 4.6 | Messer-Griesheim (Frankfurt, Germany), 0385 |
In order to investigate the optimum electrode material, the interface was coupled with a heated flow cell, which allowed continuous evaporation of 1,2-dichloropropane.
3 Experimental
3.1 Electrode material
In order to find the optimum conditions for the excitation of halogenated hydrocarbons, six different metals were investigated as cathode materials. Accordingly, six cathodes were made and the parameters for stable plasma conditions were examined. For this study, a continuous flow of chlorine into the plasma was used. Therefore, vapours of halogenated hydrocarbons were produced by placing discrete aliquots of the latter in a glass vessel and evaporating them. This allowed the determination of the detection limits from the signals and the concentrations by applying an exponential dilution calculation (see also, e.g., ref. 13). In a first series of measurements, the pressure and power were optimised so as to reach maximum analyte line intensity signals. This was achieved by selecting voltages where the discharge was stable for the respective cathode material and recording the resulting current. Results obtained with the different electrode materials and with lines in the visible region (Table 2) and the conditions found to be optimum are given in Table 3. The influence of pressure on the signal intensities was studied in the range 250–1500 Pa. The optimum was found to be between 0.5 and 0.8 kPa for the set-up used. However, no influence of flow rate and pressure could be found within this range. The pressures for different cathode materials were selected so as to have maximum operation stability.| aHighest precision. | |
|---|---|
| Chlorine | ClII 479.454 nma |
| ClII 481.006 nm | |
| ClII 481.946 nm | |
| Bromine | BrII 478.550 nma |
| BrII 481.671 nm | |
In spite of favourable properties for magnesium, such as good conductivity and high thermal conductivity, a stable plasma was not obtained. This might have been related to the presence of traces of oxygen, causing oxidation of the electrode and discharge breakdown. The oxygen may come from leaks in the laboratory-made glass flow-through cell. It was not possible to evacuate the lamp completely without leaving any trace of oxygen.
It also was not possible to use copper as the hollow cathode material. After cleaning the surface of the cathode, the plasma was stable for only a few minutes. After several minutes the plasma began to flicker, which necessitated raising the voltage. The reason for this behaviour might lie in an embrittlement of the surface of the electrode.
Of all materials used as the cathode, aluminium required the highest power. With voltages above 1 kV, it was possible to obtain a stable discharge. However, the power changed continuously and could not be made reproducible between 20 and 100 mA.
Stainless steel was found to be very suitable as the electrode material. At about 850 V, the plasma was stable; because a power of 50 W could be obtained, the volatilisation and excitation were favourable. For these conditions, it was possible to determine chlorine as halogenated hydrocarbon with a detection limit of 18 ng s−1. The detection limit was calculated from the ratio of the net line intensities during the analyte flows and the blank line using the 3s criterion for the blank. A relative standard deviation (RSD) of about 10% could be obtained and this was found to be mainly limited by the poor signal-to-noise ratio introduced by the presence of spectral interferences.
As is shown by the results in Table 3, titanium was very useful as a cathode material. The plasma was found to be very stable, very few spectral interferences for the chlorine lines were found to occur and the electrode even after 500 h showed hardly any signs of erosion. A disadvantage was the high temperature of the electrode resulting from the poor heat conductance. It was not possible to increase the power beyond 70 W, as would have been necessary to obtain maximum analyte line intensities, because otherwise the electrode began to glow and the plasma collapsed.
| Material | Graphite | Titanium | Steel | Aluminium | Copper | Magnesium |
|---|---|---|---|---|---|---|
| Voltage/V | 550 | 1000 | 850 | >1000 | 480 | — |
| Power/W | 16.5 | 65 | 50 | 20–100 | 35 | — |
| Pressure/kPa | 0.8 | 0.8 | 0.8 | 0.8 | 0.8 | — |
| Helium flow rate/ml min−1 | 5 | 10 | 10 | 10 | 10 | — |
| Lifetime/h | ∼50 | >500 | ∼200 | — | — | — |
| Detection limit/ng s−1 | 9 | 21 | 18 | — | — | — |
| Precision (%) | 5.6 | 8.4 | 9.2 | — | — | — |
The best electrode material obviously was graphite. Here the glow discharge was found to be extremely stable, it was very inexpensive, and it turned out only to be necessary to work at powers lower than 20 W so as to obtain maximum analyte signals and to minimize spectral interferences. In addition to the better signal-to-background ratio, the glow discharge was also more stable and showed less evolution of heat. However, the lifetime was restricted to 50 h because of the sputtering. The detection limit for a continuous chlorine flow is as low as 9 ng s−1 and an RSD of 5% can be obtained. It will be shown that the detection limit for chlorine can be decreased to the pg s−1 range after coupling the hollow cathode source with a gas chromatograph.
3.2 Influence of cathode cavity depth
Not only the material but also the length of the cathode cavity has an influence on the intensities of the atomic emission lines. This had been described extensively for planar cathodes in the literature.14,15 In a series of experiments the depth of the cathode had been varied in the range 10–30 mm for a constant internal diameter of 4 mm.In Fig. 2, the intensities are maximum for a cathode cavity depth of 20 mm. Therefore, the optimum ratio between depth and diameter was 5–6 for the set-up used. If the ratio were higher, spectrometric determination would become difficult because of opening angle limitations. A lower ratio seemed to prohibit the formation of a stable glow discharge.
 | ||
| Fig. 2 Dependence of the intensities of the ClII 479.454 nm emission line on the depth of the cathode cavity. Depth of the cathode cavity, 10–30 mm; mean of five replicate measurements. Helium HCGD; graphite electrode; p = 0.8 kPa; I = 30 mA; U = 255 V; 1,2-dichloromethane. | ||
3.3 Influence of power
As shown in Table 3, the optimum range of plasma power depended strongly on the electrode material. The optimum power for a graphite hollow cathode (Fig. 3) was between 15 and 20 W. If the power was not high enough, there was insufficient excitation of the sample in the plasma, whereas at higher plasma power, the optimum temperatures for excitation of the lines might be surpassed. | ||
| Fig. 3 Influence of the plasma power and the depth of the graphite cathode cavity on the intensities of the analyte atomic emission line ClII 479.454 nm. Helium HCGD; graphite electrode; p = 0.8 kPa; 1,2-dichloromethane. | ||
3.4 Coupling to gas chromatography
After coupling the HCGD through the interface described with the gas chromatograph, it was possible to work without appreciable traces of oxygen. Therefore, a further significant improvement of the figures of merit of the system could be obtained. Furthermore, it was possible to reduce the plasma power to 7–10 W, which led to more reproducible results. Because the spectra also displayed fewer spectral interferences for the analyte lines, a decrease in the detection limits could be achieved. The results for the detection of chlorine and bromine when introducing 1-bromo-3-chloropropane into the source by means of injection into the evaporation cell are shown in Table 4. The cell was placed in-line with the gas chromatograph, while bypassing the column so that constant introduction flows were obtained. In the evaporation cell, known amounts of analyte were placed in a small vessel over which a gas stream flowed. The detection limits were calculated from the signals obtained and the respective relative standard deviations and also from the evaporation rates determined by weighing the amount of solution to be evaporated.| Chlorine evaporation rate/ng s−1 | Detection limit/ng s−1 | Bromine evaporation rate/ng s−1 | Detection limit/ng s−1 |
|---|---|---|---|
| 9.2 | 0.8 | 21.0 | 2.0 |
| 8.9 | 0.1 | 20.0 | 0.1 |
| 10.0 | 0.2 | 22.1 | 1.1 |
| 15.5 | 0.8 | 35.1 | 3.3 |
| 17.1 | 1.1 | 37.8 | 5.0 |
It could be shown that in this way, detection limits of 100 pg s−1 are found. It must be considered, however, that these results were reached with a continuous halogen flow. It was clearly observed that with a further decrease in the absolute concentrations, lower detection limits for samples of chlorine and bromine would be obtained. An estimate of these detection limits was possible from a scan in the wavelength range between 478 and 482 nm (Fig. 4).
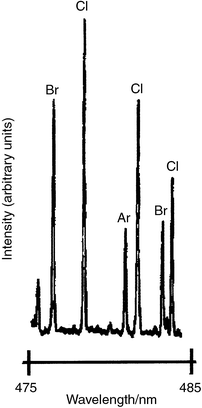 | ||
| Fig. 4 Scan in the wavelength range 478–482 nm. Helium HCGD; graphite electrode; p = 0.8 kPa; I = 33 mA; U = 260 V; 1-bromo-2-chloroethane; flow rate of chlorine and bromine, 25 ng s−1. | ||
The detection limits obtained from the evaporation experiments mainly suffered from inaccuracies in weighing and fluctuations due to instabilities in the organic vapour supply. The ultimate detection limits were obtained from exponential dilution experiments, where background acquisition and stability of the source are much better. The detection limits obtained with exponential dilution were 3 pg s−1 for chlorine (ClII 479.454 nm) and 5 pg s−1 for bromine (BrII 478.550 nm). Therefore, the HCGD can be considered as an alternative for electron capture detection in gas chromatography and, moreover, delivers element specific information, which is not possible with most other types of detectors.
For evaluating the features of the HCGD as an element specific detector for gas chromatography, 0.5 µl of 1,2-dichloromethane for chlorine and 0.5 µl of 1-bromo-2-chloroethane for bromine were injected at variable split/splitless ratios on to the column. The split/splitless ratio was selected between about 1∶100 and 1∶150. As shown in Fig. 5, linear calibration curves were obtained both for chlorine and bromine. Obviously, the precision in the case of Br is much poorer, owing to the analytical lines used, as the signal intensity of the ClII 479.454nm line is much higher than that of the BrII 478.550 nm line and the background noise is nearly equal in both cases. The analytical lines in the visible region had been chosen because of their high intensities and freedom from spectral interferences. Moreover, they could be measured very easily, being in the visible region (see Table 2 and Fig. 4).
 | ||
| Fig. 5 Calibration for (a) chlorine and (b) bromine by injecting 0.5 µl of (a) 1,2-dichloromethane and (b) 1-bromo-2-chloroethane into the GC-HCGD system. Graphite electrode; p = 0.8 kPa; I = 28 mA; U = 250 V; split/splitless ratio, 1∶100; flow rate of Cl, 3 ng s−1. | ||
In Fig. 6, calibration curves for the measurement of chlorine and bromine in the case of 1-bromo-2-chloroethane are shown. The calibration curves do not pass through the origin, as effects resulting from the need to work at different levels of amplification might occur. In this case, the measurements were made at much higher analyte flows and, accordingly, the precision obtained was also much higher.
 | ||
| Fig. 6 Calibration for (a) chlorine and (b) bromine with 0.5 µl 1-bromo-2-chloroethane using a GC-HCGD. Graphite electrode; p = 0.8 kPa; I = 31 mA; U = 252 V; variable split/splitless ratio. | ||
As hexane normally is used as a solvent for 1-bromo-2-chloroethane, the standard solutions were prepared by dilution with hexane in different ratios. The resulting detection limits for Br and Cl and the calibration curves obtained from the signals in the case of different dilutions are shown in Table 5 and Fig. 7, respectively. As the detection limit is calculated from the signal-to-background ratio, the best result is reached at the highest absolute concentrations, which means low ratios of 1-bromo-2-chloroethane to hexane. At ratios of 1:60 or higher, however, the detection limit decreased again, but the standard deviation was about 50% or more.
 | ||
| Fig. 7 Calibration for (a) chlorine and (b) bromine obtained with several dilutions of 1-bromo-2-chlorethane in hexane injected into the gas chromatograph. Graphite electrode; p = 0.8 kPa; I = 27 mA; U = 244 V (error bars below the scale of reproduction); variable split/splitless ratio. | ||
| 1-Bromo-2-chloroethane:hexane ratio | CBr/pg s−1(±10%) | IBr(arbitrary units) | Detection limit of Br/pg s−1 | CCl/pg s−1 (±10%) | ICl (arbitrary units) | Detection limit of Cl/pg s−1 |
|---|---|---|---|---|---|---|
| 1∶1 | 3300 | 0.97 | 3.8 | 1463 | 18.7 | 1.7 |
| 1∶2 | 2200 | 0.68 | 7.3 | 975 | 0.68 | 3.2 |
| 1∶4 | 1320 | 0.38 | 7.9 | 585 | 0.39 | 3.4 |
| 1∶6 | 943 | 0.27 | 8.0 | 418 | 0.27 | 3.5 |
| 1∶10 | 600 | 0.18 | 15 | 266 | 0.20 | 6.1 |
| 1∶15 | 413 | 0.10 | 19 | 183 | 0.11 | 7.4 |
| 1∶20 | 314 | 0.09 | 24 | 139 | 0.09 | 11 |
| 1∶40 | 161 | 0.03 | 34 | 71 | 0.04 | 13 |
| 1∶50 | 129 | 0.02 | 41 | 57 | 0.03 | 15 |
| 1∶60 | 108 | 0.02 | 34 | 48 | 0.02 | 15 |
| 1∶80 | 81 | 0.01 | 12 | 36 | 0.02 | 12 |
| 1∶100 | 65 | — | — | 29 | — | — |
The results show that low detection limits, which depend on the analyte vapour loading in the case of different standard samples, a large dynamic range and high precision are obtained. The vapour loading might be understood to influence the analytical signals and the detection limits because of its influence on the plasma discharge parameters.
4 Conclusions
It was shown that an HCGD as a source for atomic emission spectrometry is a very sensitive, alternative element specific detector for gas chromatography. The system can be easily coupled with a commonly used gas chromatograph. The power of detection approaches that of flame ionisation detection and even electron capture detection. Moreover, the HCGD has a low gas consumption and is easy to operate. It has been demonstrated that the HCGD allows the measurement of non-metals such as chlorine and bromine in the case of organic compounds. With a simultaneous spectrometer, it will be possible to determine different halogens and also carbon and hydrogen simultaneously and to determine reliably the stoichiometry of the compounds.Acknowledgements
The authors thank Mr. H. Lehmkämper for making available the 0.7 m monochromator used.References
- M. A. Eckhoff, J. P. McCarthy and J. A. Caruso, Anal. Chem., 1982, 54, 165 CAS.
- S. A. Estes, P. C. Uden and R. M. Barnes, Anal. Chem., 1981, 53, 1336 CrossRef CAS.
- S. Caroli, Prog. Anal. At. Spectrosc., 1983, 6, 253 Search PubMed.
- J. A. C. Broekaert, J. Anal. At. Spectrom., 1987, 2, 537 RSC.
- R. K. Marcus, Glow Discharge Spectroscopies, Plenum Press, New York, 1993. Search PubMed.
- F. Paschen, Ann. Phys. (Leipzig), 1916, 50, 901 Search PubMed.
- H. Falk, Spectrochim. Acta, 1965, 21, 423 CrossRef CAS.
- L. Puig and R. Sacks, Appl. Spectrosc., 1989, 43, 801 Search PubMed.
- K. C. Ng, A. H. Ali and J. D. Winefordner, Spectrochim. Acta, Part B, 1991, 46, 309 CrossRef.
- R. Pereiro, T. K. Starn and G. M. Hieftje, Appl. Spectrosc., 1995, 49, 616 Search PubMed.
- J. A. C. Broekaert, R. Pereiro, T. K. Starn and G. M. Hieftje, Spectrochim. Acta, Part B, 1993, 48, 1207 CrossRef.
- M. Biziuk and A. Przjazny, J. Chromatogr., 1996, 733, 417 CrossRef CAS.
- G. Centineo, M. Fernandez, R. Pereiro and A. Sanz-Medel, Anal. Chem., 1997, 69, 3702 CrossRef CAS.
- A. Bengston and S. Hänström, J. Anal. At. Spectrom., 1998, 13, 437 RSC.
- R. Payling, Surf. Interface Anal., 1994, 21, 785 CrossRef CAS.
| This journal is © The Royal Society of Chemistry 2000 |