Atmospheric pressure helium rf plasma source for atomic and molecular mass spectrometry
R. Guevremont and R. E. Sturgeon
Institute for National Measurement Standards, National Research Council of Canada, Ottawa, Canada K1A 0R9
First published on UnassignedUnassigned7th January 2000
Abstract
A capacitively coupled low power atmospheric pressure rf He plasma established within a thermostated cylindrical steel block serves as a source for the generation of molecular and atomic ions for mass spectral analysis. Volatile analytes separated by gas chromatography are admitted to the source through a coaxial rf-powered center electrode. Variation of the forward power, in the range 5–100 W, and the position of the plasma relative to the differentially pumped extraction orifice of the mass spectrometer, permits control over the relative intensities of parent and daughter ion products of the decomposition of organometallic compounds introduced into the source. Spectral features range from simple response from atomic ions to the detection of the parent molecular compounds and combinations of the two between the extremes of operating conditions. Ferrocene, triethyllead chloride and ethylmercury chloride were used to illustrate the application of the technique.
Introduction
It is currently recognized that the determination of the total trace metal burden in most environmental and biological samples provides insufficient information relating to lability, i.e., bioavailability and toxicity, as well as for use in risk assessment scenarios. The separation and quantification of identifiable forms of an element (chemical, physical or morphological) constitutes the field of speciation1 and atomic spectrometry detectors, when coupled to an appropriate separation technique, currently play a major role in the development of this discipline. In the process, however, molecular or structural information is lost and a relative approach to speciation is accomplished by comparison of the temporal responses with those of known standards. This presents a fatal obstacle in the event that an uncharacterized element peak appears in the chromatogram with no retention time match with a known standard. Since no molecular information is available from conventional plasma sources, structural information is lost and identification becomes impossible. Recent work with multi-dimensional instrumentation has helped to rectify this problem.2–5 A combination of liquid chromatography with electrospray/ionspray sources can be used for measurement of fragment ion patterns, generating (potentially near simultaneous) structural information which can be used to deduce species identity in the absence of a standard. Additionally, ‘dual mode' analysis, achieved by judicious selection of operating conditions in the atmospheric pressure ionization (API) source interface, permits elemental atomic and molecular information to be obtained on the same sample.Additional ‘soft' ionization sources which provide a dual mode of operation to permit atomic and molecular detection include low pressure inductively coupled plasmas (ICPs),6,7 low power microwave-induced plasmas (MIPs)8 and low power glow discharges.9
Using a low power (45–90 W), low pressure He ICP, O'Connor et al.7 demonstrated that controlled fragmentation of organometallic species led to fragment ion spectra similar to those generated by conventional electron impact (EI) techniques. A low power MIP (20–32 W) coupled to a direct injection nebulizer for introduction of HPLC samples was used to elicit spectra from perfluorotributylamine and tetramethyltin.8 Results proved to be similar to their EI analogues. Similarly, admission of GC effluents into a low pressure (0.6 mbar) rf glow discharge, running at 30–40 W power, permitted identification of organotin molecular entities. Fragmentation patterns were relatively insensitive to discharge operating parameters and similar to those from EI sources.
Furnace atomization plasma emission spectrometry (FAPES) has already shown use as a sensitive element-specific detector for the measurement of Hg in GC effluents10,11 and serves as an efficient ion source for MS.12,13 In principle, it operates much as a rapidly oscillating atmospheric pressure glow discharge14 and, in light of the above, can thus be viewed as a candidate low power soft ionization source for molecular information when coupled to MS for detection.
In the present study, a preliminary evaluation of FAPIMS (furnace atomization plasma ionization mass spectrometry) as a dual mode detector for organometallic speciation of GC effluents was undertaken. Ferrocene, methylmercury chloride, ethylmercury chloride and triethyllead chloride were examined as test analytes.
Experimental
FAPIMS source
A schematic diagram of the source is presented in Fig. 1. The earlier reported FAPIMS ion source13 was redesigned to permit sampling of the plasma directly into a modified stainless-steel sampler plate containing a 0.10 mm id aperture. The FAPIMS workhead was simplified, as no provision for electrothermal vaporization of the sample was required, and consisted of a stainless-steel cylinder mounted such that adjustments in both X- and Y-directions (using micrometers), as well as axially, could be made to permit variable distances between the end of the powered electrode and the sampler plate orifice to be set (by riding on ‘O'-rings) in all three dimensions. The rf-powered center electrode assembly was modified to permit the introduction of GC effluent directly through the center electrode. In order to accomplish this, a 1 mm id channel was fabricated through a cylindrical Macor machinable glass ceramic (Wesgo/Duramic, Fairfield, NJ, USA), inserted in the stainless-steel body. This unit supported a copper conductor which provided a conduit for the rf connection as well as passageway for the GC line and connection for the center electrode. The latter consisted of a 2 mm od × 4 cm long high-purity nickel tube (Aldrich, Milwaukee, WI, USA) screwed into the copper conductor base at one end and transversely drilled along its penultimate centimeter of length with numerous small holes to permit uniform escape of GC effluent into the source.10,11 In this manner, the eluted species were directly transported to the most energetic portion of the FAPES discharge for optimum excitation and ionization.14 Rf power was supplied to the electrode from a 40 MHz Model RF10L generator through an AM-5 matchbox (RF Power Products, Voorhees, NJ, USA). Additional ports were added to the source housing to admit He make-up gas into the plasma discharge region (established between the center electrode and the steel cavity) as well as for purge gas flowing in the concentric space between the GC column and the copper conductor (electrode purge gas). This minimized tailing of the peaks and reduced back-diffusion of the eluates to the rear of the source.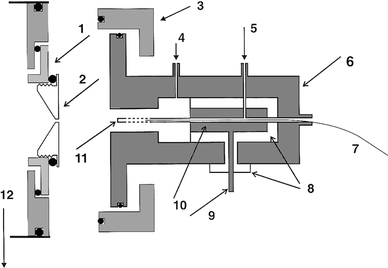 | ||
| Fig. 1 FAPIMS-GC workhead. 1, Macor insulator; 2, sampler plate orifice; 3, translation ring; 4, plasma gas; 5, electrode purge gas; 6, stainless-steel body; 7, GC capillary column; 8, Macor insulator; 9, rf power in; 10, copper conductor; 11, Ni center electrode; and 12, 0.7 Torr roughing pump. | ||
The FAPIMS source was interfaced to a triple quadrupole PE-SCIEX API 300 mass spectrometer. The API ionspray source chamber as well as the instrument's curtain plate and orifice were removed and replaced with a custom-made sampler plate having a flat profile containing a knife-edged orifice of 0.10 mm diameter. The plate was threaded into a Macor ceramic mount, electrically isolated from the instrument ground, as illustrated in Fig. 1. Voltages in the range 0–45 V (positive) were applied to the sampler plate. The mechanical roughing pump for the instrument provided a 0.7 Torr pressure (uncalibrated for He) in the differentially pumped region.
Samples were admitted to the FAPIMS source using one of two modes of introduction. In the first, continuous introduction of a low partial pressure of the analyte was achieved by passing a low flow of He carrier gas (1 ml min−1), regulated with a needle valve, through 10 cm long Pyrex columns containing several crystals of the compound of interest sandwiched between quartz wool plugs. The Pyrex columns were fitted into 1/4 in id copper tubes which could be heated with a winding of heater tape, and connected into a manifold with a Swagelok ‘T'-union to permit vapor transfer to the FAPIMS source via the GC line. The flux of compound was controlled by both the ambient temperature of the thermostated Pyrex column as well as by its volumetric dilution with an auxiliary flow of He at the T-junction. This method of sample introduction was not used for quantitative measurements but permitted qualitative investigation of the effects of various instrumental parameters on the resulting mass spectra to be investigated. The second method of sample introduction relied on the quantitative injection of known masses of the compounds, prepared in methanolic solutions, introduced via syringe in 1 µl volumes through the heated injection port (160![[thin space (1/6-em)]](https://www.rsc.org/images/entities/char_2009.gif) °C) and septum of a Varian Aerograph (Walnut Creek, CA, USA) Model 1440 gas chromatograph fitted with a 20 m length of 0.4 mm od × 0.25 mm id DB-5 column (J&W Scientific, Rancho Cordova, CA, USA). Depending on the compound, the GC oven was thermostated in the range 130–160
°C) and septum of a Varian Aerograph (Walnut Creek, CA, USA) Model 1440 gas chromatograph fitted with a 20 m length of 0.4 mm od × 0.25 mm id DB-5 column (J&W Scientific, Rancho Cordova, CA, USA). Depending on the compound, the GC oven was thermostated in the range 130–160![[thin space (1/6-em)]](https://www.rsc.org/images/entities/char_2009.gif) °C. The transfer column was wound with heating tape and covered with a layer of insulating fiber to promote uniform heating. The leads were attached to a variac. The FAPIMS source was likewise heated in the range 95–115
°C. The transfer column was wound with heating tape and covered with a layer of insulating fiber to promote uniform heating. The leads were attached to a variac. The FAPIMS source was likewise heated in the range 95–115![[thin space (1/6-em)]](https://www.rsc.org/images/entities/char_2009.gif) °C.
°C.
All gas flows were regulated with the use of ball-float rotameters (Cole Parmer, Vernon Hills, IL, USA) in combination with needle valves. An operating pressure of 15 psig was used to supply He at a flow rate of typically 0.5 l min−1 to the plasma discharge, 0.2 l min−1 to purge the electrode cavity and at sufficient volume to generate a calculated flow of approximately 30 cm s−1 through the GC column (0.25 ml min−1).
Reagents
Stock standard solutions (200 mg l−1) of triethyllead chloride, trimethyllead chloride, ferrocene, methylmercury chloride, ethylmercury chloride and triphenylarsine (Alfa Aesar, Johnson Matthey, Ward Hill, MA, USA) were prepared in sub-boiled, distilled methanol. Working standards, in the range of 2 mg l−1, were prepared by serial dilution. Helium was of laboratory grade (Air Products, Ottawa, Ontario, Canada).Procedures
Instrumental operating conditions were quickly established but not fully optimized in these experiments as the thrust of the study was essentially a qualitative assessment of FAPIMS as a dual mode ion source for MS. As such, the numerous lens voltages for the API were initially set near the manufacturer's recommended operating conditions and the GC oven temperature, elution gas flow rate, FAPIMS source and interface transfer temperature were simply adjusted such that a response could be ensured. The influence of forward rf power and position of the tip of the center electrode relative to the sampling plate orifice on performance was studied, as was the effect on atomic and molecular spectra of imposing a positive potential on the insulated sampler plate in an effort to delineate those parameters which impacted most on the relative atomic∶molecular response. This was achieved during introduction of a continuous flux of analyte with use of the packed Pyrex tubes. At any given temperature, stable and precise results could be generated in all cases. Injection of methanolic solutions of the analytes onto the GC column permitted some degree of quantification with respect to sensitivity as well as a calculation of the resulting isotope ratios for single injection runs.Results and discussion
The FAPIMS source has previously been shown to be useful for the generation of ions from picogram masses of inorganic salts vaporized and atomized at high temperature into the rf plasma.13 Sensitive detection of Hg(OH)+ and Hg(OH)2+ species in addition to Hg+ during admission of Hg0 vapor in a He carrier stream suggested use of the source for measurement of molecular compounds as well. The extended mass range available with the API 300 makes the present system well suited for the evaluation of the FAPIMS source for this application.Fig. 2 presents spectra obtained during admission of a steady-state flux of ferrocene into the source. As the forward rf power is increased from 10 to 25 W there is a shift in the relative intensities of the ions to result in a spectrum less dominated by the parent (M+) molecular ion at m/z = 186 and the protonated molecular (MH+) ion at m/z = 187. At higher powers, fragmentation ions arising from the loss of one cyclopentane ring occur, corresponding to the signal at m/z = 121 and the intensity of Fe is enhanced relative to that of MH+. Further increases in power continue this trend until the spectrum is primarily that due to elemental iron (spectrum not shown). The spectrum generated at 25 W is essentially identical with that produced with an EI source (NIST library # 16513, CAS 102545). Peaks evident at 202, 219 and 236 are due to mercury species, as noted above (the isotopic fingerprint is characteristic of this element), and are a consequence of residual contamination of the source with this earlier introduced analyte. Peaks are also evident at m/z = 44 and 30, likely arising from trace amounts of CO2 and production of NO in the plasma due to N2 and O2 impurities.15
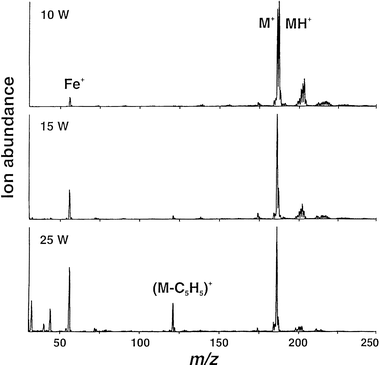 | ||
| Fig. 2 Effect of rf power on relative ion intensities for steady-state introduction of ferrocene vapor. Sampling depth 5 mm; 2 mm lateral position; +2 V on sampler plate. | ||
The relative ion intensities are determined by the stability of the species admitted as well as its ionization potential. The ionization potential of ferrocene is 6.90 eV16 and that of Fe is 7.87 eV. Even with substantial molecular dissociation, it is likely that the resulting ion intensity from the parent molecule will exceed that for Fe+ simply from a consideration of their relative ionization potentials. Ferrocene is relatively stable, having a melting-point of 448 K (subliming thereafter). The kinetic temperature of the plasma at 25 W is fairly low and likely well below this temperature,17 suggesting that substantial decomposition of the molecule in the FAPIMS source occurs via EI. Clearly, increasing the power from 10 to 25 W will not supply sufficient energy to fragment the molecule thermally so as to result in the changes in intensities noted in Fig. 2. Excitation temperature does not change significantly in this source as the rf power is increased, rather the electron density rises.18 This would produce results consistent with the interpretation advanced above. In addition to fragmentation reactions, the presence of the protonated ferrocene ion as well as the molecular mercury species indicates that chemical ionization reactions are also prevalent in this source; additional evidence for this will be presented later.
The data presented in Fig. 2 were obtained with the center electrode approximately 5 mm distant from the orifice of the sampler plate (i.e., 5 mm sampling depth) and with the center of the plasma discharge displaced laterally from the orifice by approximately 2 mm. As the source is translated in the X–Y plane (lateral positioning) relative to the orifice, the relative intensities of the major ions can be approximately mapped over the cross-section of the plasma. This information is presented for ferrocene in Fig. 3 using a 13 W plasma. It is clear that atomic and molecular information is independently maximal in spatially different regions of the source. Optimum sampling for atomic Fe+ occurs proximate to the center electrode, whereas molecular ion intensity is most pronounced near the periphery of the source around the grounded walls of the enclosure. Ideally, a symmetric pattern should be present, reflecting the radially symmetric structure of the plasma14,19 wherein maximum excitation, and thus ionization, occurs predominantly in a ring around the center electrode with a second, less intense discharge around the periphery of the counter electrode. As such, most intensive fragmentation occurs within the most energetic part of the plasma located in the annulus of space around the powered electrode. The fact that this two-dimensional cross-sectional structure can be observed in this small source (r = 4 mm) suggests that point sampling of the plasma gases can be achieved with a spatial resolution of the order of 1 mm or less. Although no illustrative data are presented, identical cross-sectional intensity patterns were obtained with both mercury and lead organometallic compounds introduced into the plasma (cf.Fig. 5).
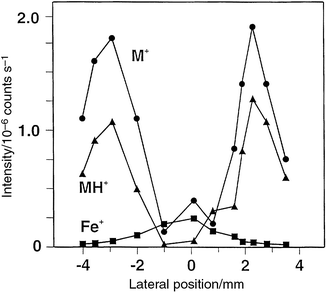 | ||
| Fig. 3 Effect of lateral sampling position on ion intensities for steady-state introduction of ferrocene vapor. 13 W rf power; sampling depth 5 mm; +0 V on sampler plate. | ||
Fig. 4 shows results for the admission of ethylmercury chloride vapor into a 20 W source. Detection of a variety of ions is possible, including Hg+ (m/z = 202), Hg(OH)+ (m/z = 219) and Hg(OH)2+ (m/z = 236), the M+ parent molecular ion (HgEtCl+) at m/z = 266 and a (30 + M+) ion at m/z = 296. Although the identity of this last species has not been established, one possibility is that it may be (M + NO)+, as NO is known to be present in the plasma.15 Additionally, fragmentation species such as HgEt+ (m/z = 231) as well as HgEt(H2O)+ at m/z = 249 are all obtained with the source displaced 3.8 mm from the axial center of the orifice to the spectrometer. It is also likely that some [HgEt(H2O)2]+ is present at m/z = 267. Ions below m/z = 180 were not of interest because only information relevant to speciation of this compound was of significance to this study. Presumably, fragments not containing Hg may be present. Similarly, any cluster ions present above m/z = 320 were not of interest and the instrument was not scanned beyond this mass. It is evident from these data that a fingerprint spectrum, characteristic of the parent compound, can easily be generated in the FAPIMS source to permit unambiguous identification of this species. As the source is laterally translated on-axis with respect to the sampler plate orifice, the influence of the two-dimensional structure of the plasma is again evident, with the most significant ion intensity arising from Hg+ as compared with its various molecular species. Additionally, as the rf power is decreased below 20 W, the relative intensities of the molecular∶atomic components are significantly enhanced, as noted earlier for ferrocene.
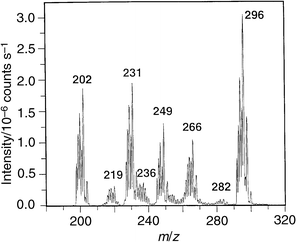 | ||
| Fig. 4 Mass spectrum acquired during steady-state introduction of ethylmercury chloride vapor. 20 W rf power; 5 mm sampling depth; 3.8 mm lateral position; +2 V on sampler plate. | ||
Fig. 5 further illustrates the effect of lateral sampling position on the spectrum obtained during admission of a steady-state concentration of triethyllead chloride vapor into the source when operated at 11 W. As the lateral offset of the center electrode from the sampler orifice is increased from 1.6 to 4.0 mm, the energetics of the discharge/sampling process decrease, as reflected in the degree of fragmentation of the molecule. Relative ion intensities for Pb+ decrease substantially whereas those for the EtPb+ and Et3Pb+ ions rise. This occurs because the region of the plasma being sampled is changed from that of the intense annulus around the center electrode to the more diffuse regions at greater radial distance.
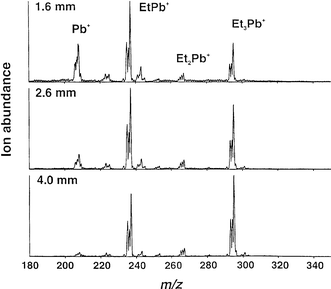 | ||
| Fig. 5 Effect of lateral sampling position on mass spectrum acquired during steady-state introduction of triethyllead chloride vapor. 11 W rf power; 5 mm sampling depth; +40 V on sampler plate. | ||
Data presented in Fig. 6 serve to illustrate further the influence of sampler plate voltage on the acquired spectra. Methylmercury chloride vapor was admitted to the source sustaining an 11 W plasma located on-axis to the sampler orifice. The intentional low forward power serves to produce a large population of molecular species, despite on-axis sampling. A spectrum containing fragmentation ions Hg+, CH3Hg+ (m/z = 217), CH3Hg(H2O)+ (m/z = 235), CH3Hg(H2O)2+ (m/z = 253), possibly CH3HgCl–H+, as well as [(CH3HgCl)++30] at m/z = 282 (possibly due to attachment of NO), is consistently obtained but, as the sampler plate voltage is increased, the dominance and intensity of the lower mass products becomes evident. Clearly, all other conditions being constant, the voltage field enhances collisional dissociation processes likely occurring in the region between the sampler cone and the grounded skimmer cone. This parameter provides for an additional variable to that of position and power which may be used to alter the information content of the spectrum.
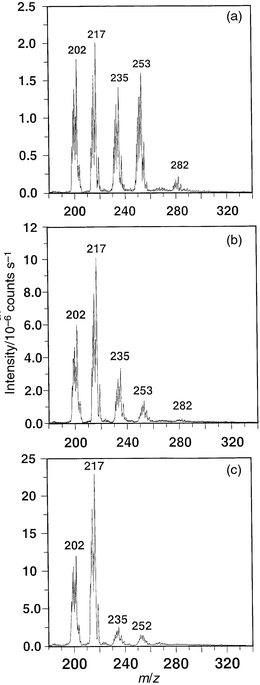 | ||
| Fig. 6 Effect of sampler plate voltage on ion intensities for steady-state introduction of methylmercury chloride vapor. 11 W rf power, on-axis sampling; 5 mm sampling depth: (a) +10 V on sampler plate; (b) +25 V on sampler plate; (c) +45 V on sampler plate. | ||
In an effort to assess the quantitative performance of the system, discrete masses of several compounds were introduced into the source using liquid injection of 1 µl volumes of methanolic standards (0.1–2 µg ml−1) onto the GC column. The solvent peak was permitted to elute rapidly into the source without the plasma on (as it would otherwise be quenched) to avoid any decomposition of the solvent and deposition of carbonaceous residue on components of the source. With suitable software and valving, the solvent can be automatically vented so as to avoid this problem.11Fig. 7 presents chromatograms obtained for the loading of 100 pg of ferrocene onto the GC column. Peak hopping (50 ms dwell time monitoring ions at m/z 54, 56, 184, 186 and 187) was used for acquisition of the mass spectrum. Source conditions were adjusted for good detection of an atomic species, i.e., 20 W power, on-axis sampling, 5 mm sampling depth, +2 V applied to the sampler plate. Although chromatographic conditions were likely not optimum, in that the heated transfer interface and column conditions did not guarantee quantitative transfer of the ferrocene through the system, the half-widths and symmetry of the eluted peaks for iron suggest that tailing and adsorption, at least, are minimal. From a single chromatographic run, a 56Fe∶54Fe ratio of 14.9 was obtained from the integrated peaks (540 counts∶36 counts-note scale change in Fig. 7), in reasonable agreement with the expected ratio of 15.8. Clearly, for quantitative measurements of isotope ratios it is more expedient to use shorter dwell times; this may improve agreement between measured and expected results. The accompanying ‘satellite' peaks in both spectra at 1.5 and 2.8 min are not iron-containing species (incorrect isotope ratio) and likely reflect the presence of unknown organic moieties eluted from the column.
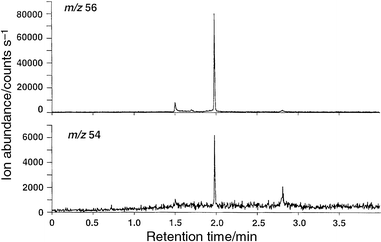 | ||
| Fig. 7 Chromatogram obtained for injection of 100 pg of ferrocene. 20 W rf power; on-axis sampling; 5 mm sampling depth; +2 V on sampler plate. | ||
Results for a similar experiment, run with 2.0 ng of ethylmercury chloride, are shown in Fig. 8. The measured 202Hg∶200Hg, based on a single run (117∶91 counts), is 1.29. This compares well with the expected value of 1.28. The earlier peak appearing at 1.5 min may be due to carry-over from a previous run or from desorption of mercury from some component in the source. In contrast to ferrocene, significant tailing of the mercury peaks is evident, consistent with the notorious affinity of mercury (elemental and organometallic) for adsorption onto surfaces.20 A number of factors may serve to improve this situation, including a higher temperature oven, interface and source and better optimization of the center electrode purge gas flow rates, as this is an important parameter that can be used to improve the quality of the spectra.11 Despite the use of nickel for the center electrode in an effort to minimize adsorption,20 it is likely that this nonetheless serves as a major adsorption site due to the relatively low temperature of this environment.
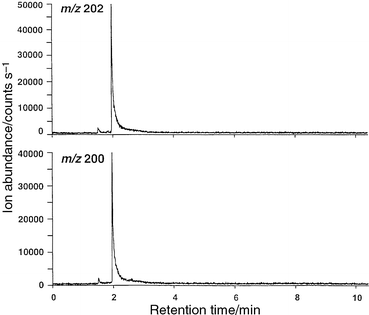 | ||
| Fig. 8 Chromatogram obtained for injection of 2.0 ng of ethylmercury chloride. 20 W rf power; on-axis sampling; 5 mm sampling depth; +2 V on sampler plate. | ||
Table 1 summarizes the relative sensitivities for detection of atomic and molecular ions arising from the (steady-state) introduction of a number of relatively stable, volatile organometallic species into the FAPIMS source. Conditions were optimized with respect to source variables to result in optimum sensitivity for the individual species and any conclusions drawn apply only to the particular tandem arrangement used here consisting of the FAPIMS source with the API mass spectrometer. With the exception of triphenylarsine, it is possible to strike a reasonably good balance between the atomic and molecular species of all of the compounds examined, suggesting that dual mode detection is a feasible option with this source.
| Compound | Atomic | Molecular | Sensitivity ratio, atomic∶molecular |
|---|---|---|---|
| CH3HgCl | Hg | MH+ | 4 |
| CH3CH2HgCl | Hg | (M + 30)+ | 4 |
| (CH3)3PbCl | Pb | (M − Cl)+ | 0.5 |
| (Et)3PbCl | Pb | (M − Cl)+ | 0.2 |
| Ferrocene | Fe | M+ | 0.1 |
| Triphenylarsine | As | MH+ | 0.01 |
Conclusions
FAPIMS serves as a viable source for element-selective detection with GC-MS for organometallic speciation. Variation of operating parameters, including rf power, sampler plate voltage, radial position and, likely, plasma gas flow rates as well as sampling depth, may all serve to promote conditions for the dual mode detection of atomic and molecular species. A combination of EI and chemical ionization appears operative and it remains to study the ionization mechanisms in a more systematic fashion. Although not quantified in this preliminary evaluation, detection limits are estimated to fall in the femtogram range despite minimal efforts to ensure efficient GC operation or the selection of parameters yielding optimum S/B. A more efficient heated transfer line with automatic solvent venting to couple the GC system and source is needed. The ease of operation of this atmospheric pressure source makes it attractive for potential routine use.References
- E. Nieboer and Y. Thomassen, Analyst, 1995, 120, 30N RSC.
- G. Zorob, F. B. Brown and J. Caruso, J. Anal. At. Spectrom., 1997, 12, 517 RSC.
- J. J. Corr, J. Anal. At. Spectrom., 1997, 12, 537 RSC.
- J. J. Corr and E. H. Larsen, J. Anal. At. Spectrom., 1996, 11, 1215 RSC.
- S. A. Pergantis, W. Winnik and D. Betowski, J. Anal. At. Spectrom., 1997, 12, 531 RSC.
- E. H. Evans, W. Pretorius, L. Ebdon and S. Rowland, Anal. Chem., 1994, 66, 3400 CrossRef CAS.
- G. O'Connor, L. Ebdon, E. H. Evans, H. Ding, L. K. Olson and J. A. Caruso, J. Anal. At. Spectrom., 1996, 11, 1151 RSC.
- N. P. Vela, J. A. Caruso and R. D. Satzger, Appl. Spectrosc., 1997, 51, 1500 Search PubMed.
- L. K. Olson, M. Belkin and J. A. Caruso, J. Anal. At. Spectrom., 1996, 11, 491 RSC.
- M. S. Jimenez and R. E. Sturgeon, J. Anal. At. Spectrom., 1997, 12, 597 RSC.
- W. Frech, J. Snell and R. E. Sturgeon, J. Anal. At. Spectrom., 1998, 13, 1347 RSC.
- R. E. Sturgeon and R. Guevremont, J. Anal. At. Spectrom., 1998, 13, 229 RSC.
- R. E. Sturgeon and R. Guevremont, Anal. Chem., 1997, 69, 2129 CrossRef CAS.
- V. Pavski, C. L. Chakrabarti and R. E. Sturgeon, J. Anal. At. Spectrom., 1994, 9, 1399 RSC.
- R. E. Sturgeon, S. N. Willie, V. Luong and S. S. Berman, Anal. Chem., 1990, 62, 2370 CrossRef CAS.
- R. D. LevinS. G. Lias, Ionization Potential and Appearance Potential Measurements, 1971–1981, NSRDS-NBS 71, US Department of Commerce, National Bureau of Standards, Washington, DC, 1982. Search PubMed.
- S. Imai and R. E. Sturgeon, J. Anal. At. Spectrom., 1994, 9, 493 RSC.
- R. E. Sturgeon, S. N. Willie and V. T. Luong, Spectrochim. Acta, Part B, 1991, 46, 1021 CrossRef.
- T. D. Hettipathirana and M. W. Blades, Spectrochim. Acta, Part B, 1992, 47, 493 CrossRef.
- S. R. Daniels, PhD Thesis, Carleton University, Ottawa, 1991..
| This journal is © The Royal Society of Chemistry 2000 |
