Aspects of transition metal pentacoordination: investigation of the structure and bonding of Me3NbCl2, Me3TaCl2 and Me2NbCl3 by photoelectron spectroscopy and density functional theory calculations
Anthony J.
Downs
,
Jennifer C.
Green
*,
G. Sean
McGrady
,
Neil
Munkman
and
Richard P. G.
Parkin
Inorganic Chemistry Laboratory, South Parks Road, Oxford, UK OX1 3QR. E-mail: jennifer.green@chem.ox.ac.uk
First published on 24th December 1999
Abstract
He I and He II photoelectron (PE) spectra of Me3NbCl2, Me2NbCl3 and Me3TaCl2 are presented and assigned. Density functional calculations give trigonal bipyramidal structures for the Nb complexes, with the axial positions occupied by Cl ligands. Calculated ionisation energies (IE) for Me3NbCl2, Me2NbCl3 and Me3TaCl2 are in good agreement with the experimental values and the molecular orbital compositions can be reconciled with the intensity changes in the PE spectra. The axial interactions are best described by a 3-centre 4-electron bond, which accounts for the longer Nb–Cl distances predicted for these bond lengths. That the orbitals involved in Ta–ligand bonding with a Ta 6s contribution have higher IE’s relative to their Nb counterparts may be due to relativistic stabilisation of the Ta 6s orbital. Comparisons with the main group analogue Me3SbCl2 support Elbel’s assignment of the PE spectrum of the latter compound, where there is a reversal of the IE ordering between the transition metal and the main group compounds. For Sb the halide orbitals constitute the highest lying set, whereas with the transition metal compounds the metal–carbon bonding orbitals provide the highest occupied molecular orbitals. No evidence is found in the calculations for a significant contribution to the bonding from Nb 5p orbitals. The large angles subtended by the Cl atoms at the metal are attributed to their negative charge and interligand repulsion.
Introduction
Five-coordinate species are remarkable in structural chemistry, as they have no low energy geometry with stereochemically equivalent sites. As such, pentacoordinate main group compounds played a central role in the development of VSEPR theory in the 1960’s.1,2 The trigonal bipyramid (tbp) was found to be favoured over the square pyramid (sp) in most cases, and the concept of apicophilicity was introduced to account for ligand site preferences in heteroleptic tbp systems.3,4 Five-coordinate transition-metal centres figure prominently in many reaction pathways, as well as featuring in ground state geometries. In 1975 a seminal paper by Rossi and Hoffmann![[hair space]](https://www.rsc.org/images/entities/char_200a.gif) 5 employed extended Hückel calculations to address the bonding in five-coordinate transition-metal complexes. The absence of non-bonding d electrons in the mixed ligand species Me3NbCl2, Me3TaCl2 and Me2NbCl3 has prompted us to study these systems by a variety of techniques. Here we report our investigation of the bonding by a combination of photoelectron spectroscopy and density functional theory (DFT) calculations. The He I spectrum of Me3TaCl2 has been reported previously;
5 employed extended Hückel calculations to address the bonding in five-coordinate transition-metal complexes. The absence of non-bonding d electrons in the mixed ligand species Me3NbCl2, Me3TaCl2 and Me2NbCl3 has prompted us to study these systems by a variety of techniques. Here we report our investigation of the bonding by a combination of photoelectron spectroscopy and density functional theory (DFT) calculations. The He I spectrum of Me3TaCl2 has been reported previously;![[hair space]](https://www.rsc.org/images/entities/char_200a.gif) 6 here we report the He II spectrum which suggests a minor change in the earlier assignment of the bands.
6 here we report the He II spectrum which suggests a minor change in the earlier assignment of the bands.
Experimental
Synthesis and characterisation
Standard high-vacuum and inert atmosphere techniques were used throughout. Me2NbCl3, Me3NbCl2 and Me3TaCl2 were prepared by the reaction of NbCl5 or TaCl5 with Me2Zn in pentane according to the procedures of Juvinall and Fowles et al.7,8 The volatile materials were separated by fractional sublimation in vacuo. Sample purity was checked by reference to the 1H NMR spectrum of a CD2Cl2 solution,8,9 and to the IR spectrum of the solid condensate at 77 K.10 Samples were stored at 77 K until needed to prevent thermal decomposition.Photoelectron spectroscopy
He I and He II PE spectra of Me3NbCl2, Me3TaCl2 and Me2NbCl3 were measured using a PES Laboratories 0078 spectrometer interfaced with an Atari microprocessor, which enables accumulation of a spectrum by repeated scans. Spectra were calibrated using He, Xe and N2.Computational methods
All calculations were carried out using the Amsterdam density functional (ADF) program system, versions 2.0.1 and 2.3.11 For geometry optimisations and calculation of ionisation energies, the electronic configurations of the molecular systems were described by an uncontracted triple-ζ basis set of Slater-type orbitals (STO). Hydrogen, carbon and chlorine were given an extra polarisation function, 2p on H and 3d on C and Cl. The cores of the atoms were frozen, C up to 1s, Cl to 2p, Nb up to 3d, Sb up to 4p and Ta up to 5p. First order relativistic corrections were made to the cores of all atoms using the Pauli formalism.Energies were calculated using Vosko, Wilk and Nusair’s local exchange correlation potential![[hair space]](https://www.rsc.org/images/entities/char_200a.gif) 12 with non-local-exchange corrections by Becke
12 with non-local-exchange corrections by Becke![[hair space]](https://www.rsc.org/images/entities/char_200a.gif) 13 and non-local correlation corrections by Perdew.14,15 The non-local correction terms were utilised in calculating gradients during geometry optimisation, so as to find the non-local minimum.
13 and non-local correlation corrections by Perdew.14,15 The non-local correction terms were utilised in calculating gradients during geometry optimisation, so as to find the non-local minimum.
Ionisation energies were estimated by calculating energies for the molecular ions in their ground and excited states. In all cases the geometries were fixed at that found for the optimum structure of the molecule to enable comparison with the experimental vertical IE. A complication arose in the case of Me3ECl2 (E = Nb, Sb and Ta), as the ADF program used does not handle C3h symmetry explicitly. This made the calculation of the excited states of the molecular ion unfeasible with this particular geometry constraint. The states were thus calculated using C3v symmetry, which involved rotation of the methyl groups through 30° from the C3h geometry so that one C–H bond in each CH3 group eclipsed the same M–Cl bond. Optimum bond lengths were found to be very close to those of the C3h structure, as were the corresponding one-electron energies.
For the calculation of ion states the basis set used was the molecular orbital (MO) from the molecular calculation. This assisted convergence on a hole in the specified orbital, and also provided a ready check on the extent to which the ion state hole could be described in terms of a single MO of the parent molecule.
Results
Structural predictions
For the Nb compounds under study, geometry optimisations were carried out with initial structures based on a tbp framework with various site occupancies; these are shown in Fig. 1.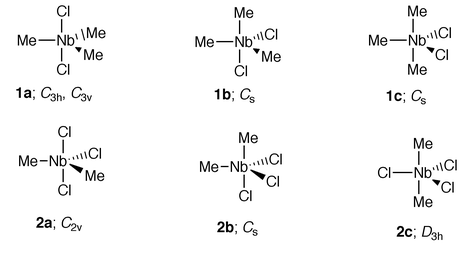 | ||
| Fig. 1 Initial structures assumed in geometry optimisations of Me3NbCl2 and Me2NbCl3. | ||
Use of symmetry constraints enabled an estimation of the relative energies of the various conformers envisaged for Me2NbCl3. The most stable was found to be a C2v structure for 2a, confirming the relative preferences of Cl for axial and Me for equatorial sites. The D3h conformer lay 1.43 eV in energy above the C2v structure. The Cs conformer optimised to a geometry where the angle subtended by the original axial groups at the Nb was 155°; this was 0.33 eV higher in energy than the C2v model. A frequency calculation confirmed that the C2v structure was a local minimum. The lowest energy vibrational mode, with a calculated wavenumber of 80 cm−1, involved bending of the two axial Cl and the equatorial Me ligands towards an sp structure, the process involved in Berry pseudorotation.
In the case of Me3NbCl2 the C3 structures had the lowest energy, the difference between the C3h and C3v forms being negligible. Structure 1b moved to an sp form with one Cl ligand axial, and having an energy 0.33 eV above those of the C3 conformers. Model 1c moved to a distorted tbp geometry with an angle of 148° between the axial Me and 126° between the equatorial Cl ligands; this lay 0.48 eV above the C3 conformers. Frequency calculations on the optimised C3h and C3v structures gave three very low imaginary frequencies for both, corresponding to rotation of the methyl groups. However, optimisation with no symmetry also failed to locate an energy minimum for the relative orientation of the methyl groups.
The predicted bond lengths and angles for the optimised structures of Me3NbCl2 and Me2NbCl3 are given in Table 1. Although the angle of 164° subtended by the two axial Cl’s at the Nb in Me2NbCl3 is appreciably less than the ideal of 180°, the skeletal shape is clearly closer to a tbp than an sp. The two axial Cl’s bend away from the equatorial Cl. The Nb–Cl axial bonds are calculated to be longer than the equatorial Nb–Cl, indicating that Cl is more strongly bound in an equatorial site. Very small distortions of the Me groups are predicted but the variations in bond length and angle are likely to be beyond the limits of experimental detection.
| Me3TaCl2 | Me3SbCl2 | |||||
|---|---|---|---|---|---|---|
| Parameter | Me2NbCl3 Calc. | Me3NbCl2 Calc. | Calc. | Exp.![[hair space]](https://www.rsc.org/images/entities/char_200a.gif) a a |
Calc. | Exp.![[hair space]](https://www.rsc.org/images/entities/char_200a.gif) b b |
| a ra Structure determined by electron diffraction studies on the gaseous molecule, see ref. 16. b ra Structure determined by electron diffraction studies on the gaseous molecule, see ref. 17. c Fixed by symmetry constraint. | ||||||
| r(M–Cl)eq/Å | 2.30 | |||||
| r(M–Cl)ax/Å | 2.34 | 2.35 | 2.41 | 2.317(3) | 2.53 | 2.460(6) |
| r(M–C)/Å | 2.17 | 2.17 | 2.20 | 2.158(5) | 2.15 | 2.107(6) |
| r(C–H)av/Å | 1.10 | 1.10 | 1.10 | 1.098(7) | 1.10 | 1.103(13) |
| Cleq–M–Clax/° | 98 | |||||
| Clax–M–Clax/° | 164 | 180![[hair space]](https://www.rsc.org/images/entities/char_200a.gif) c c |
180![[hair space]](https://www.rsc.org/images/entities/char_200a.gif) c c |
180![[hair space]](https://www.rsc.org/images/entities/char_200a.gif) c c |
180![[hair space]](https://www.rsc.org/images/entities/char_200a.gif) c c |
180![[hair space]](https://www.rsc.org/images/entities/char_200a.gif) c c |
| Cleq–M–C/° | 121 | |||||
| Clax–M–C/° | 86 | 88, 92 | 88, 92 | 90![[hair space]](https://www.rsc.org/images/entities/char_200a.gif) c c |
89, 91 | 90![[hair space]](https://www.rsc.org/images/entities/char_200a.gif) c c |
| C–M–C/° | 119 | 120![[hair space]](https://www.rsc.org/images/entities/char_200a.gif) c c |
120![[hair space]](https://www.rsc.org/images/entities/char_200a.gif) c c |
120![[hair space]](https://www.rsc.org/images/entities/char_200a.gif) c c |
120![[hair space]](https://www.rsc.org/images/entities/char_200a.gif) c c |
120![[hair space]](https://www.rsc.org/images/entities/char_200a.gif) c c |
For comparative purposes, geometry optimisations assuming C3h and C3v symmetry were also carried out on Me3TaCl2 and Me3SbCl2, with the results also given in Table 1. In these two cases, comparisons with the structures determined previously by electron diffraction studies of the vapours![[hair space]](https://www.rsc.org/images/entities/char_200a.gif) 16,17 find satisfactory agreement between theory and experiment.
16,17 find satisfactory agreement between theory and experiment.
Photoelectron spectroscopy
He I and He II spectra of Me3NbCl2, Me3TaCl2 and Me2NbCl3 are shown in Fig. 2–4. Vertical ionisation energies are tabulated in Table 2. The He I spectrum recorded for Me3TaCl2 is in good agreement with that previously published.6 For all three compounds, there are substantial differences between the band intensities generated with the different photon energies. A previous study of the PE spectrum of MeTiCl3, with photon energies varying between 22 and 50 eV, showed similar variations in photoionisation cross-sections.18 Such cross-section variations are important in their capacity to give a clear indication of the atomic orbitals (AO) contributing to the molecular orbital with which a particular PE band is associated. For example, Nb 4d ionisations will gain in relative intensity on increasing the photon energy. Cl 3p ionisations will fall dramatically in relative intensity between He I and He II radiation, as Cl 3p has a Cooper minimum in its cross-section around 42 eV. C 2p cross-sections show an intermediate behaviour. Thus, in the He I spectrum the Cl 3p ionisations will dominate the spectrum, whereas at 40 eV Nb 4d will be the dominant ionisation.![[hair space]](https://www.rsc.org/images/entities/char_200a.gif) a
a
| (a) M = Nb | ||||||||
|---|---|---|---|---|---|---|---|---|
| Population analysis | ||||||||
| IE/eV | Nb | Cl | C | |||||
| Orbital | Orbital energy/eV | Calc. | Exp. | Orbital character | d | s | p | p |
| a The orbital numbering differs between Nb, Ta and Sb because the Nb calculations include the Nb 4p core orbitals, while the Ta calculations treat the Ta 5p core orbitals as frozen, and the Sb calculations include the 4d orbitals in the valence set, while the 3p orbitals are frozen. b See ref. 22. | ||||||||
| 7e, e′ | −6.99 | 9.64 | 9.85 A1 | xy, x2 − y2 + C | 27 | 9 | 41 | |
| 10.14 A2 | 41 | |||||||
| 9a1, a1′ | −7.83 | 10.45 | 10.8 B | s − z2 + C σ | 15 | 12 | 54 | |
| 6e, e′′ | −7.92 | 10.63 | 11.65 C | Cl π | 9 | 74 | ||
| 5e, e′ | −8.01 | 11.13 | 11.65 C | Cl π | 86 | |||
| 8a1, a2′′ | −8.15 | 10.96 | 11.65 C | Cl σ | 92 | |||
| 1a2, a2′ | −9.77 | 12.40 | 12.8–15.5 E | C–H | ||||
| 7a1, a1′ | −9.85 | 12.59 | 13.4 D | s + z2 + Cl σ | 14 | 3 | 66 | |
| (b) M = Ta | ||||||||
|---|---|---|---|---|---|---|---|---|
| Population analysis | ||||||||
| IE/eV | Ta | Cl | C | |||||
| Orbital | Orbital energy/eV | Calc. | Exp. | Orbital character | d | s | p | p |
| 6e, e′ | −6.93 | 9.59 | 9.91 A1 | xy, x2 − y2 + C σ | 27 | 6 | 49 | |
| 10.26 A2 | ||||||||
| 5e, e′′ | −7.89 | 10.61 | 11.42 B | Cl π | 5 | 79 | 9 | |
| 4e, e′ | −7.96 | 11.10 | 11.85 C | Cl π | 5 | 79 | 5 | |
| 7a1, a2′′ | −8.01 | 10.89 | 11.42 C | Cl σ | 96 | |||
| 6a1, a1′ | −8.32 | 10.97 | 11.85 B | s − z2 + C σ | 20 | 12 | 50 | |
| 1a2, a2′ | −9.85 | 12.49 | 12.8–15.5 D | C–H | ||||
| 4a1, a1′ | −10.17 | 13.03 | 13.85 E | s + z2 + Cl σ | 10 | 9 | 69 | 3 |
| (c) M = Sb | ||||||||
|---|---|---|---|---|---|---|---|---|
| Population analysis | ||||||||
| IE/eV | Sb | Cl | C | |||||
| Orbital | Orbital energy/eV | Calc. | Exp.b | Principal orbital character | d | s | p | p |
| 8e, e′ | −6.72 | 9.48 | 9.8 | Cl π | 91 | 5 | ||
| 7e, e′′ | −6.84 | 10.14 | 10.22 | Cl π | 96 | |||
| 8a1, a1′ | −7.09 | 9.81 | 10.65 | Cl σ | 83 | 11 | ||
| 7a1, a2′′ | −8.74 | 11.41 | 12.05 | Cl σ + Sb p | 15 | 63 | 6 | |
| 6e, e′ | −8.91 | 11.60 | 12.05 | C σ + Sb p | 22 | 49 | ||
| 1a2, a2′ | −9.85 | 13.33 | C–H | |||||
| 5a1, a1′ | −13.87 | 16.63 | Sb s | 50 | 6 | 17 | ||
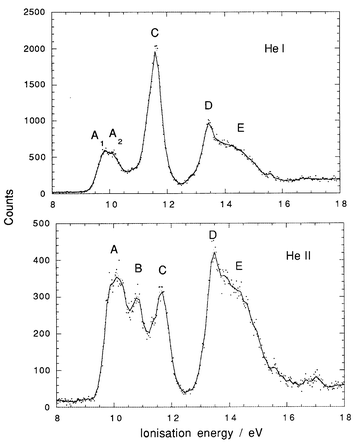 | ||
| Fig. 2 He I and He II PE spectra of Me3NbCl2. | ||
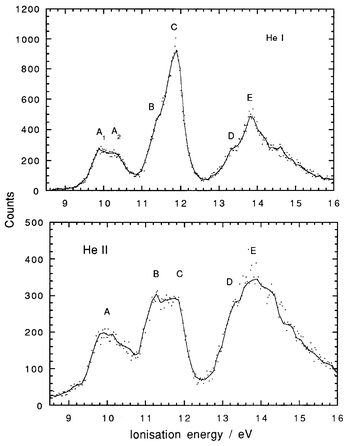 | ||
| Fig. 3 He I and He II PE spectra of Me3TaCl2. | ||
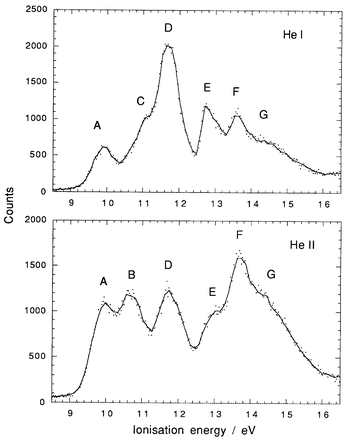 | ||
| Fig. 4 He I and He II PE spectra of Me2NbCl3. | ||
The IE of a band is also an indication of its orbital character. By analogy with MeTiCl3 and other metal halides the lowest IE PE bands will be due to metal–carbon bonding electrons, followed by bands associated with Cl lone pair pπ ionisations, followed by metal chlorine bonding ionisations, with C–H bonding ionisations having the highest IE in the valence region.18
For Me3NbCl2 (Fig. 2), bands A, B and D come from orbitals with metal character and C from orbitals with Cl character. Bands A and B can be assigned to ionisation of Nb–C bonding electrons, band C to Cl p ionisations, and band D to Nb–Cl bonding ionisations. The broad band E, which to a certain extent underlies D, is characteristic of the ionisation of C–H bonding electrons.
The PE spectrum of Me3TaCl2 (Fig. 3) is similar to that of its Nb analogue, if it is assumed that the equivalent of band B forms the low IE part of the second complex band. The intensity variations between the He I and He II spectra show a change in band shape and an increase in the intensity of the lower IE part of the band consistent with its association with electrons having metal character. In this case, band E is associated with an orbital of metal character superimposed on a broad C–H band D.
The PE spectrum of Me2NbCl3 may be assigned in a similar fashion. Bands A and B are associated with Nb–C bonding orbitals, C and D with Cl 3p ionisations, and E and F with Nb–Cl bonding electrons. The broad band G is due to C–H bonding ionisations.
For all three compounds, a more detailed assignment is made possible by examination of the DFT bonding model and calculation of the relevant IE.
MO analysis
In the MO analysis we are principally concerned with the framework orbitals and the Cl pπ electrons. For the Me3MCl2 series, the framework has effective D3h symmetry which distinguishes some orbital combinations otherwise possessing identical irreducible representations in the lower C3 symmetry. Accordingly, we use both labels to describe the orbitals.Pictorial representations of selected one-electron wave functions of Me3NbCl2 are given in Fig. 5. One-electron energies and a Mulliken population analysis of the upper occupied orbitals are detailed in Table 2. Orbitals 7e (e′) and 9a1 (a1′) show metal–carbon bonding characteristics, the orbital 9a1 (a1′) being formed with a Nb (s–dz2) hybrid. They are followed, on an increasing energy scale, by a set of orbitals of high chlorine 3p character, 6e (e′′), 5e (e′) and 8a1 (a2′′). The 5e (e′′) orbital shows some Nb character, which is π bonding with respect to the axial Cl. The 8a1 (a2′′) orbital has Cl pσ character; in principle this symmetry adapted combination could form a bonding interaction with a Nb 5p orbital, but the Mulliken analysis and the energy suggest its bonding role to be minimal. The 7a1 (a1′) orbital represents bonding between the axial chlorine pσ orbitals and the Nb dz2 orbital, chlorine character predominating. The Nb–Cl σ bonding is thus consistent with the simple model of a 3-centre 4-electron bond, but with a high degree of polarity. The 1a2 orbital is constrained to be purely C–H in character and is a convenient marker for the onset of the C–H bonding manifold.
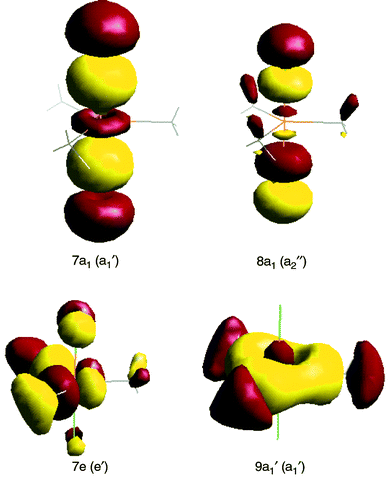 | ||
| Fig. 5 Selected representations of the MO’s of Me3NbCl2. | ||
Evaluation of the ionisation energies associated with removing electrons from these orbitals (Table 2) enables the assignment of the PE spectrum of Me3NbCl2 to be completed. The correlation between the calculated and experimental IE, if not obvious at first, is made clear by consideration of the intensity changes and the Mulliken populations. Band A is assigned to ionisation from the 7e orbital. The fact that it shows two maxima, A1 and A2, suggests that the 2E ground state of the molecular ion undergoes Jahn–Teller distortion. Band B is associated with ionisation from the 9a1 orbital. The very low intensity of this band in the He I spectrum, such that it is barely visible, is consistent with the intensity patterns found from the ionisation of other transition metal halides with orbitals having significant metal s character.18 Band C is associated with the orbitals of high Cl character, i.e. 6e, 5e and 8a1. Band D is attributed to the 7a1 ionisation. The bonding character of the orbital ensures the IE is higher than for ionisation of the Cl non-bonding electrons, while its metal d character has the consequence that band D grows relative to band C as the ionising radiation is changed from He I to He II. Calculation of the IE from an upper C–H bonding orbital places the onset of the C–H ionisation manifold very close to band E, in support of the preliminary interpretation of this band.
Me3TaCl2 has an orbital structure very similar to that of its Nb analogue. Accordingly, the PE spectrum is given a parallel assignment. The principal difference from Me3NbCl2 is revealed in the higher IE for the a1′ framework orbitals. The Ta–C a1′ bonding orbital is stabilised to an extent that places its ionisation (band B) in the second complex band overlapping with the Cl p bands. In addition, the Ta–Cl a1′ IE is greater so that the associated band E lies around the maximum of the C–H band manifold and does not precede it, as in the case of Me3NbCl2. As both these orbitals have Ta 6s content, their greater binding energies may well be a consequence of the relativistic stabilisation of the Ta 6s orbital.19–21 Elbel et al. did not identify any ionisation from the Ta–C a1 ionisation orbital,6 but otherwise their assignments correspond with ours.
For Me2NbCl3, the one-electron wave functions are represented pictorially in Fig. 6. One-electron energies and a Mulliken population analysis of the upper occupied orbitals are given in Table 3. Highest in energy in the occupied orbital energy manifold come the 3b2 and 4a1 orbitals, which have metal–carbon bonding character (Fig. 6). Of the next five orbitals, which are principally localised on Cl, the 1a2 orbital shows some Nb–Cl π bonding character (Fig. 6). The 2b1 orbital, which is Cl pσ in character and located on the axial ligands, has a negligible Nb 5p contribution, being very similar in its distribution to the a2′′ orbital of Me3NbCl2. The 1b1 and 1b2 orbitals are also Nb–Cl π bonding in character. Finally, the 2a1 and 1a1 orbitals provide the Nb–Cl σ bonding.
| Population analysis | ||||||||
|---|---|---|---|---|---|---|---|---|
| IE/eV | Nb | Cl | C | |||||
| Orbital | Orbital energy/eV | Calc. | Exp. | Orbital character | d | s | p | p |
| 3b2 | −7.05 | 9.64 | 9.89 A | xz + C σ | 21 | 32 | 36 | |
| 4a1 | −7.73 | 10.35 | 10.64 B | x 2 + C σ | 19 | 4 | 26 | 29 |
| 3b1 | −7.81 | 10.53 | 11.0 C | Cl π | 99 | |||
| 1a2 | −8.09 | 10.75 | 11.0 C | xy + Cl π | 9 | 70 | 8 | |
| 3a1 | −8.27 | 11.00 | 11.64 D | Cl π | 6 | 68 | 9 | |
| 2b2 | −8.32 | 11.00 | 11.64 D | Cl π | 83 | 7 | ||
| 2b1 | −8.54 | 11.29 | 11.64 D | Cl σ | 84 | 4 | ||
| 1b2 | −8.77 | 11.09 | 11.64 D | xz + Cl π | 16 | 73 | 6 | |
| 1b1 | −9.23 | 12.00 | 12.73 E | yz + Cl π | 16 | 74 | 3 | |
| 2a1 | −9.77 | 12.52 | 13.57 F | z 2 + Cl σ | 8 | 71 | 8 | |
| 1a1 | −10.18 | 12.56 | 13.57 F | y 2 + Cl σ | 18 | 73 | ||
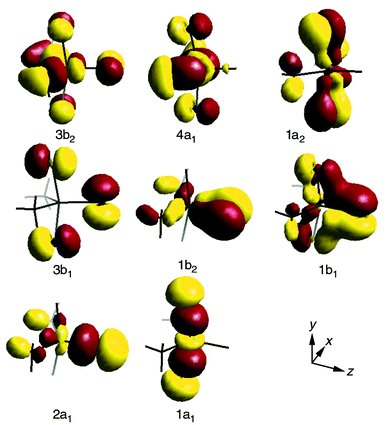 | ||
| Fig. 6 Selected representations of the MO’s of Me2NbCl3. | ||
The greater number of ionisations of interest for Me2NbCl3 as compared with Me3NbCl2 and the lower symmetry of Me2NbCl3, hamper the calculation of the ion state energies, as there are now several with the same symmetry representations. However, the calculations do give valuable guidance in assigning the PE spectrum (Table 3). Bands A and B are ascribed to ionisation from the 3b2 and 4a1 orbitals, respectively. Again the second band B is hard to see in the He I spectrum. Even though the orbital is of a1 symmetry, the population analysis does not show a 5s contribution as high as that found for the analogous a1′ orbital of Me3NbCl2. On the evidence of the IE pattern calculated and the relative intensities of the bands, it seems reasonable to assign band C to orbitals 3b1 and 1a2 and band D to 3a1, 2b2, 2b1 and 1b2, as these all have high Cl content and the associated ion states are predicted to lie within 0.3 eV of one another. Working again from the ion state energy pattern leads us to assign band E to the ionisation from the 1b1 orbital and band F to the 2a1 and 1a1 ionisations.
Discussion
Comparison with transition metal analogues
The appearance and assignment of the spectrum of Me3NbCl2 accord well with that of its heavier congener Me3TaCl2, which was studied by Elbel et al.6 Correlation of the orbital energies is shown in Fig. 7, where the most notable feature is the stabilisation of the M–C and M–Cl a1′ orbitals on descending the group. This correlates with the increased strength of the bonds formed by the metals of the third transition series.19 However, the M–C e′ orbital does not show a corresponding drop in energy between Nb and Ta. The metal s content of the a1′ orbitals and the relativistic stabilisation of the 6s orbital![[hair space]](https://www.rsc.org/images/entities/char_200a.gif) 20,21 may well account for the changes in the orbital energies and the related changes in the ionisation energies discussed above.
20,21 may well account for the changes in the orbital energies and the related changes in the ionisation energies discussed above.
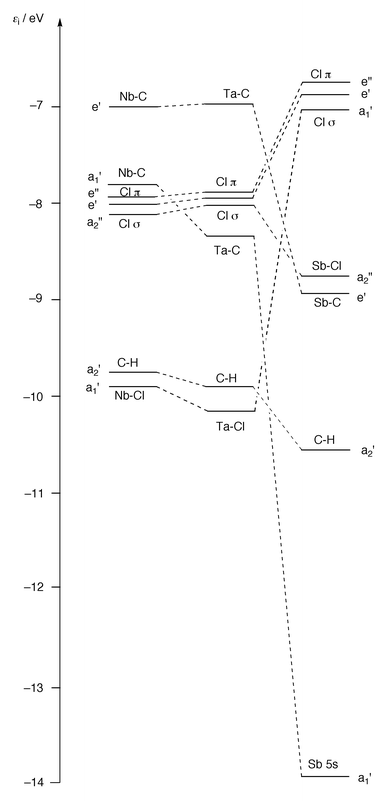 | ||
| Fig. 7 Orbital correlation diagram for Me3MCl2 (M = Nb, Ta or Sb). Orbitals are correlated with respect to their principal AO character. | ||
Comparison with main group analogues
There appear to have been no studies published of main-group compounds of the type Me2ECl3. For comparative purposes we have carried out calculations on Me3SbCl2, the results of which are reported in Table 2(c). The calculations show reasonable agreement between the calculated and experimentally determined dimensions![[hair space]](https://www.rsc.org/images/entities/char_200a.gif) 17 and IE
17 and IE![[hair space]](https://www.rsc.org/images/entities/char_200a.gif) 22 for this molecule.
22 for this molecule.
Fig. 7 compares the orbital energies of Me3SbCl2 with those of its transition metal counterparts. The D3h skeletal symmetry common to all these molecules permits a direct comparison between the energies for each orbital type. A striking feature of the figure is the energies of the Cl(p) orbitals; in the Sb compound these constitute the highest lying orbitals, whereas in the Nb compound they lie 1 eV lower. Both the Cl pπ and the Cl σ orbitals engage in very little mixing with other orbitals and their energies all lie very close together. However, the e′ and e′′ orbitals of Nb and Ta are somewhat more delocalised than those of Sb and a Mulliken charge analysis (Table 4) indicates that the Cl charge is greater in Me3SbCl2 (−0.55) than in the transition metal compounds [−0.48 (Ta), −0.45 (Nb)]. Such a feature is also apparent in the structural parameter Δ [ = r(M–Cl)ax − r(M–Cl)eq] observed for NbCl5 (Δ = 0.31 Å)![[hair space]](https://www.rsc.org/images/entities/char_200a.gif) 23 compared with SbCl5 (Δ = 0.061 Å),24 and serves to emphasise the orbitally deficient nature of the Clax–Sb–Clax unit in the main group compound.
23 compared with SbCl5 (Δ = 0.061 Å),24 and serves to emphasise the orbitally deficient nature of the Clax–Sb–Clax unit in the main group compound.
| Me3NbCl2 | Me3TaCl2 | Me3SbCl2 | Me2NbCl3 | |
|---|---|---|---|---|
| M | +1.84 | +1.74 | +1.51 | +1.78 |
| Cl | −0.45 | −0.48 | −0.55 | −0.40 (ax) |
| −0.41 (eq) | ||||
| C | −0.08 | −0.13 | −0.07 | −0.05 |
| H | −0.08 | −0.04 | −0.03 | −0.07 |
The metal–carbon bonding levels are considerably more stable in Me3SbCl2 with the more electronegative Sb, in keeping with the stability of the Sb 5s and 5p orbitals. In all cases the metal–chlorine interaction is that of a 3-centre 4-electron bond. With the transition metal compounds it is the a1′ level which is M–Cl σ bonding, as the metals use a dz2–s hybrid to form this bond and the a2′′ Cl σ level is non-bonding. For Me3SbCl2, by contrast, the a2′′ level is M–Cl bonding, being formed with the Sb 5pz orbital, and the a1′ Cl σ level is non-bonding.
Ligand site preferences
Rossi and Hoffmann![[hair space]](https://www.rsc.org/images/entities/char_200a.gif) 5 concluded that the electron-rich axial sites in a d0 tbp system would be preferred by more electronegative ligands, and that the equatorial sites would afford the stronger π bonding opportunity. These considerations are antagonistic for a ligand such as Cl. The calculated geometries clearly indicate the preference of Cl for the axial positions. The degree of Cl to Nb π donation appears, at best, to be modest for axially located chlorine atoms. In Me2NbCl3 though, the unique equatorial chlorine enjoys a significant degree of π bonding with the suitably disposed dxy and dx2 − y2 orbitals. The 1b1 and 1b2 MO’s show an important contribution from Nb 5d (Table 3 and Fig. 5). Evidently the stronger M–Cl σ-interaction experienced by the axial chlorine ligands is sufficient to encourage preferential occupation of these sites despite the favourable π bonding opportunities in the equatorial positions. However, our study disagrees with the EHMO analysis of Rossi and Hoffmann
5 concluded that the electron-rich axial sites in a d0 tbp system would be preferred by more electronegative ligands, and that the equatorial sites would afford the stronger π bonding opportunity. These considerations are antagonistic for a ligand such as Cl. The calculated geometries clearly indicate the preference of Cl for the axial positions. The degree of Cl to Nb π donation appears, at best, to be modest for axially located chlorine atoms. In Me2NbCl3 though, the unique equatorial chlorine enjoys a significant degree of π bonding with the suitably disposed dxy and dx2 − y2 orbitals. The 1b1 and 1b2 MO’s show an important contribution from Nb 5d (Table 3 and Fig. 5). Evidently the stronger M–Cl σ-interaction experienced by the axial chlorine ligands is sufficient to encourage preferential occupation of these sites despite the favourable π bonding opportunities in the equatorial positions. However, our study disagrees with the EHMO analysis of Rossi and Hoffmann![[hair space]](https://www.rsc.org/images/entities/char_200a.gif) 5 in one important respect; these authors presumed the involvement of M np orbitals in the bonding of the tbp systems they considered. We find no significant population of Nb 5p from our analysis of the calculated results, in keeping with the conclusions of a recent analysis of the stereochemistries of metal alkyls and hydrides from a valence bond perspective.25
5 in one important respect; these authors presumed the involvement of M np orbitals in the bonding of the tbp systems they considered. We find no significant population of Nb 5p from our analysis of the calculated results, in keeping with the conclusions of a recent analysis of the stereochemistries of metal alkyls and hydrides from a valence bond perspective.25
Skeletal angles in Me2NbCl3
A particularly striking feature of the calculated geometry of Me2NbCl3 is the Cleq–Nb–Clax angle of 98.1°. Gas-phase electron diffraction studies, which will be reported elsewhere,26,27 are in agreement with the calculated geometry. Such a deviation from the ideal angle of 90° finds no explanation in the analysis of the PE spectrum or of the calculated MO’s, there being no sign of any contribution to the 2b1 orbital from dxz on Nb (see Fig. 6). The tendency of M–Cl bonds to have large angles to adjacent bonds in early transition metal d0 systems, in direct contrast to their behaviour in analogous main group situations,1,2 is a phenomenon which has been appreciated for certain alkyl titanium systems.27,28 The two most consistent explanations of this behaviour evoke either (i) Coulomb repulsion between the Cl atoms bonded to an electropositive metal centre![[hair space]](https://www.rsc.org/images/entities/char_200a.gif) 27,28 or (ii) polarization of the electron density in the (n − 1) core level of the metal.29,30 Given the charges calculated here (see Table 4) and the softness of the skeletal bending modes shown by the frequency calculation, we prefer the former explanation.
27,28 or (ii) polarization of the electron density in the (n − 1) core level of the metal.29,30 Given the charges calculated here (see Table 4) and the softness of the skeletal bending modes shown by the frequency calculation, we prefer the former explanation.
Acknowledgements
We are grateful to the EPSRC for financial support and to Jesus College Oxford for the award of a Research Fellowship (to G. S. M.). Part of this work has been carried out using the computational resources of a DEC 8400 multiprocessor cluster (Columbus/Magellan), provided by the UK Computational Chemistry Facility at Rutherford Appleton Laboratory (admin: Department of Chemistry, King’s College London, Strand, London WC2R 2LS).References
- R. J. Gillespie, J. Chem. Soc., 1963, 4672, 4679 Search PubMed.
- R. J. Gillespie and I. Hargittai , The VSEPR Model of Molecular Geometry, Allyn and Bacon, Boston, MA, 1992. Search PubMed.
- R. G. Cavell, D. D. Poulin, K. I. The and A. J. Tomlinson, J. Chem. Soc., Chem. Commun., 1974, 19 RSC.
- R. G. Cavell, J. A. Gibson and K. I. The, J. Am. Chem. Soc., 1977, 99, 7841 CrossRef CAS.
- A. R. Rossi and R. Hoffmann, Inorg. Chem., 1975, 14, 365 CrossRef CAS.
- S. Elbel, M. Grodzicki, L. Pille and G. Rünger, J. Mol. Struct., 1988, 175, 441 CrossRef CAS.
- G. L. Juvinall, J. Am. Chem. Soc., 1964, 86, 4202 CrossRef CAS.
- G. W. A. Fowles, D. A. Rice and J. D. Wilkins, J. Chem. Soc., Dalton Trans., 1972, 2313 RSC.
- G. W. A. Fowles, D. A. Rice and J. D. Wilkins, J. Chem. Soc., Dalton Trans., 1978, 961 Search PubMed.
- G. S. McGrady , N. Munkman and A. J. Downs , unpublished work. .
- G. te Velde and E. J. Baerends, J. Comput. Phys., 1992, 99, 84 CrossRef CAS.
- S. H. Vosko, L. Wilk and M. Nusair, Can. J. Phys., 1980, 58, 1200 CrossRef CAS.
- A. D. Becke, Phys. Rev. A, 1988, 38, 3098 CrossRef CAS.
- J. P. Perdew, Phys. Rev. B: Condens. Matter, 1986, 33, 8822 Search PubMed.
- J. P. Perdew, Phys. Rev. B: Condens. Matter, 1986, 34, 7406 Search PubMed.
- A. Haaland, H. P. Verne, H. V. Volden and C. R. Pulham, J. Mol. Struct., 1996, 376, 151 CrossRef CAS.
- Q. Shen and R. T. Hemmings, J. Mol. Struct., 1989, 197, 349 CrossRef CAS.
- C. N. Field, J. C. Green, N. Kaltsoyannis, G. S. McGrady, A. N. Moody, M. Siggel and M. De Simone, J. Chem. Soc., Dalton Trans., 1997, 213 RSC and references therein..
- P. Pyykkö and J.-P. Desclaux, Acc. Chem. Res., 1979, 12, 276 CrossRef CAS.
- N. Kaltsoyannis, J. Chem. Soc., Dalton Trans., 1997, 1 RSC.
- Ch. Elschenbroich and A. Salzer , Organometallics, 2nd edn., VCH, Weinheim, 1992. Search PubMed.
- S. Elbel and H. tom Dieck, Z. Anorg. Allg. Chem., 1981, 483, 33 CrossRef CAS.
- S. K. Grove , O. Gropen , K. Faegri , A. Haaland , K.-G. Martinson , T. G. Strand , H. V. Volden and O. Swang , unpublished work. .
- L. S. Ivashkevich, A. A. Ischenko, V. P. Spiridonov, T. G. Strand, A. A. Ivanov and A. N. Nikolaev, J. Struct. Chem. (Engl. Transl.), 1982, 23, 295 Search PubMed.
- C. R. Landis, T. K. Firman, D. M. Root and T. Cleveland, J. Am. Chem. Soc., 1998, 120, 1842 CrossRef CAS.
- G. S. McGrady , A. Haaland , H. P. Verne , H. V. Volden , A. J. Downs and W. Scherer , Organometallics, Search PubMedpaper in preparation..
- G. S. McGrady and A. J. Downs , Coord. Chem. Rev., 1999, Search PubMedin press..
- G. S. McGrady, A. J. Downs, D. C. McKean, A. Haaland, W. Scherer, H. P. Verne and H. V. Volden, Inorg. Chem., 1996, 35, 4713 CrossRef CAS.
- I. Bytheway, R. J. Gillespie, T.-H. Tang and R. F. W. Bader, Inorg. Chem., 1995, 34, 2407 CrossRef CAS.
- R. J. Gillespie, I. Bytheway, T.-H. Tang and R. F. W. Bader, Inorg. Chem., 1996, 35, 3954 CrossRef CAS.
| This journal is © The Royal Society of Chemistry 2000 |
