Transition state probing and fragment rotational dynamics following impulsive bond breakage of HgI2
Helge Bürsing and Peter Vöhringer
Max-Planck-Institute for Biophysical Chemistry, Biomolecular and Chemical Dynamics Group, Am Faßberg, Göttingen, D-37077, Germany
First published on UnassignedUnassigned22nd December 1999
Abstract
The optical anisotropic response following 30 fs, 266 nm photolysis of mercuric diiodide in ethanol solution was measured to explore transition state dynamics leading to bond fission as well as fragment rotational dynamics in the asymptotic limit for two-body dissociation. The reactive motion in the vicinity of the transition state is accompanied by modifications of the nature of the electronic transition utilized for optical detection. The initial motion away from the originally prepared Franck–Condon region through the transition state toward the fragments effectively rotates the transition moment of the electronic probe resonance in the molecular frame of the dynamically evolving system. After the reactive portion including bond breakage is complete, the anisotropy reveals an inertial component on ultrafast time scales well below 1 ps. The time constant associated with this inertial decay is much faster than the free-rotor time constant of HgI implying that impulsive bond breakage of the parent molecule results in rotational excitation of the diatomic fragment. It is argued that excitation of fragment rotational degrees of freedom presumably arises from pronounced anisotropies of the excited state potential which is known to be bent for isolated HgI2. Furthermore, coherent vibrational motion of the diatomic product gives rise to periodic modulations of the anisotropy due to stretch–bend coupling in the dynamically evolving system.
I Introduction
Intramolecular energy relaxation in condensed matter has been a major research focus for many years since activation and deactivation of molecular species plays a central role in all thermally driven chemical reactions.1,2 Vibrational energy relaxation in liquids has been studied experimentally using diatomic,3–7 triatomic,6–8 and polyatomic molecules9,10 as well as ions.11,12 Such experiments have been analyzed at various levels of sophistication ranging from models based on isolated binary collisions4,13 to weak coupling theories complemented by molecular dynamics calculations.14–20 These efforts have provided a comprehensive picture of the underlying microscopic mechanisms and the time scales associated with vibrational energy dissipation in condensed phases.In contrast, rotational energy relaxation in liquids is much less understood. The reason for this lack of understanding is essentially twofold: First, an impulsive preparation of rotationally excited molecular species in liquids is not as straightforward as impulsive preparation of vibrational excitation which can be created e.g. through direct infrared excitation21 or through ultrafast nonadiabatic transitions following optical (electronic) excitation.9,10 Second, the time scales connected with rotational deactivation are entirely unclear and may not be fully separated from any optical preparation scheme. In this respect, nonequilibrium molecular dynamics simulations may be very useful in establishing the time scale for rotational thermalization of a particular solute solvent system prior to a direct time or frequency resolved experimental approach in the laboratory.
Nevertheless, equilibrium rotational dynamics in liquids have been studied quite extensively in the past using both time and frequency domain techniques. From line shape analyses of infrared (IR) resonances, it has been well known for many decades that the early time rotational dynamics in liquids resemble the motion of a collection of free rotors, whereas the long time dynamics correspond to motion of a diffusively damped ensemble.22–24 Consequently, the orientational (i.e. dipole and Raman) correlation functions decay inertially at early times and exponentially at long times. Time resolved studies on rotational dynamics in liquids have mostly focused on the latter portion.25–27 However, a few experimental studies have indeed accomplished a direct time-resolved recovery of the inertial component on ultrafast time scales below 1 ps.28
Most recently, rotational dynamics of diatomics have been studied following impulsive bond breakage of triatomic parent species like triiodide ions29,30 or mercuric diiodide in polar liquid solutions.31 In the former case, the inertial component to the orientational correlation function of the diiodide fragments dissolved in polar protic liquids decays considerably faster than expected for a room temperature ensemble of I2− ions, implying that the process of bond breakage transfers a substantial amount of excess energy into fragment rotations.29,30 Hence, such experiments permit a direct comparison of the decay of nonequilibrium rotational correlation functions with those for which the rotor is in thermal equilibrium with its bath. Whereas equilibrium rotational correlation functions32–34 can be obtained directly from IR resonances or, alternatively, from equilibrium molecular dynamics calculations, the properties of corresponding nonequilibrium correlations functions have as yet neither been explored by experimental nor theoretical means. To our knowledge, appropriate molecular dynamics (MD) simulations for a rotationally excited rotor embedded in a thermally equilibrated bath have not yet been presented in the literature.
Fragment rotational excitation in photodissociation reactions may result from solvent assisted symmetry breaking of the ground state parent species along the bending coordinate.29,30,35,36 Such an explanation is supported e.g. by tight binding quantum chemical calculations of the ground state triiodide ion which were combined with simple force field considerations to account for the polarizable liquid environment.37 Alternatively, the equilibrium geometry of the ground state may be linear while the excited state of the parent species could be bent.29,30 As a result, an initial evolution on the dissociative excited state along the bending coordinate may translate into an nonequilibrium distribution of rotational velocities of the diatomic fragments.
In the case of mercuric diiodide in ethanol solutions, the HgI fragments were believed to rotate at early times approximately like a collection of free rotors at room temperature.31 Such an interpretation was based on the transient anisotropy of dissociating HgI2 in ethanol solution taken with a time resolution of about 150 fs and a comparison of these data with equilibrium MD simulations on solvated HgI molecules. However, the conclusion of rotationally cold HgI fragments is rather questionable since it is known from quantum chemical calculations using effective core potentials that the excited states of mercuric dihalides are significantly bent already in the gas phase.38 Nevertheless, even in the presence of fragment rotational excitation, equilibrium MD simulations suggest that rotational energy dissipation in the linear response regime is ultrafast with time constants on the order of 100 fs.31 In that case, any rotational excitation that may be generated through impulsive bond breakage of the parent HgI2 is fully relaxed even before the fragments are spatially separated (i.e. all interactions between the HgI and I fragments have subsided and the fragments have reached the asymptotic limit of the reaction).
In this paper, we present new results with improved time resolution (<50 fs) on the rotational dynamics that follow the impulsive bond breakage of mercuric diiodide in ethanol solution to obtain more accurate information on the inertial component to the orientational correlation function of the HgI fragments. In addition, the experiments reported here provide a more precise picture of the initial stages of bond fission that preceed the rotational, translational, and vibrational motion of the fragments in their asymptotic limit of the dissociation reaction. In particular, the dynamics in the vicinity of the transition state have to be determined unambiguously before any conclusions regarding fragment rotational motion in the asymptotic limit can be drawn. As will be shown, however, monitoring transition state dynamics in the photodissociation of mercuric diiodide requires ultrahigh time resolution of well below 100 fs.
II Experiment
Femtosecond transient absorption/anisotropy measurements were carried out with an entirely home-built Ti: sapphire laser/regenerative amplifier system whose technical details have been described elsewhere.7 Briefly, the output of the laser system is 30 fs pulses centered at 800 nm with energies as high as 0.5 mJ at a repetition rate of 1 kHz. These pulses were frequency doubled to 400 nm in a 100 µm thick type-I-BBO crystal without sacrificing their temporal width. To generate ultraviolet photolysis pulses at 266 nm, the fundamental and second harmonic radiation pulses were spatially separated and were sent to individual optical delay lines. After polarization rotation of the second harmonic using a zero-order half-wave retardation plate (mica), the pulses were made collinear and were temporally overlapped in another 100 µm thick type-I-BBO crystal phase-matched for sum-frequency generation at the third harmonic (266 nm). According to cross correlation measurements with the fundamental, the pulse duration of the 266 nm pulses was also 30 fs.Probe pulses tunable from 400 to 1000 nm were generated by focusing less than 1 µJ of the fundamental pulses into a sapphire substrate with a thickness of 1 mm. Owing to its Gaussian beam profile and excellent pulse-to-pulse stability throughout the entire visible spectral range, the emerging single filament white-light continuum could be used without additional parametric amplification. Pump and probe pulses were temporally and spatially overlapped in the sample using optical delay lines (Nanomover, Melles Griot) and Ag-coated concave mirrors with a radius of curvature of 1 m. Reflective optics were used to minimize GVD and to maintain a high time-resolution.
The relative pump and probe polarizations were set at 45° using zero-order half-wave retardation plates (mica, K. Lambrecht) and Glan-Taylor polarizers (K. Lambrecht). Wavelength selection with a resolution of approximately 10 nm was achieved by using interference filters placed in the probe beam path behind the sample to retain the ultrahigh time resolution. A Wollaston prism polarizer (Spindler and Hoyer) behind the sample was used to separate those components of the probe light which were polarized parallel and perpendicular with respect to the E-field vector of the pump pulse. For each laser shot, the intensities Ipar and Iperp of both components were detected simultaneously together with the reference intensity Io of the probe light in front of the sample. The transient anisotropy at pump–probe time delay τ was calculated from successive laser shots according to
 | (1) |
Here, ΔODpar,perp denotes the pump-induced optical density detected parallel/perpendicular with respect to the pump pulse polarization:
 | (2) |
The index W indicates a measurement of the optical density in the absence of the pump pulse. The simultaneous detection of both parallel and perpendicular components of the optical density has the great advantage that shot-to-shot fluctuations automatically cancel in eqn. (1). This is not the case if r(τ) is calculated from independent scans of the parallel and perpendicular components of the pump-induced optical density (e.g. through rotation of the probe pulse polarization in front of the sample).
Pump pulse energies were always kept well below 1 µJ to avoid saturation effects. Saturation was tested by monitoring the maximum anisotropy while continuously decreasing the excitation intensity until the pump-induced optical density has completely disappeared. The sample of mercuric diiodide in ethanol with a concentration of 1 mM was pumped through a flow cell with an optical pathlength of 100 µm. All chemicals were obtained from Aldrich and were used without further purification.
III Results
A. Magic angle transients
Before focusing our attention to the anisotropic response, it is instructive to survey the scalar properties and the associated time scales of the photodissociation dynamics of HgI2 as observed through conventional femtosecond time resolved pump–probe experiments. Mercuric diiodide in ethanol solution is characterized by a linear absorption spectrum in the ultraviolet spectral region which peaks around 215 and 275 nm.39 The latter resonance is dissociative leading to ground state HgI and iodine radicals. It is commonly believed that the low energy absorption band is a superposition of two dissociation pathways leading to spin–orbit ground and excited state iodine radicals.40 The actual mechanism for bond breakage, i.e. whether the dissociation is a direct process or involves nonadiabatic transitions, is not entirely understood.38–42 In the gas phase, both mechanisms have been extensively dis cussed.43,44 In any case, the diatomic product is formed in its electronic ground state HgI(2Σ+) whose absorption spectrum in ethanol solution has been measured for delays as long as 25 ns after photolysis of HgI2.45 It peaks around 400 nm and has a half width of more than 100 nm. The nature of this transition in solution is not entirely clear, but it is believed that photoexcitation of this band leads to a mixture of excited HgI electronic states of both Σ- and Π-symmetry.31 In the gas phase, the pure X 2Σ+←B2Σ+ transition has been investigated in emission to extract information about the potential energy function of HgI in the electronic ground state.46Fig. 1 shows probe wavelength dependent transient absorption measurements recorded with relative pump and probe polarizations set to the magic angle (54.7°) to remove all rotational contributions from the signal. At all probe wavelengths, the signal consists of an ultrafast feature well below 200 fs, which is reminiscent of nuclear wavepacket motion in the vicinity of the transition state for the bimolecular reaction of HgI molecules with iodine radicals.47,48 The first unambiguous signature of the HgI fragments can be identified as subsequent oscillatory modulations of the transient absorption. These modulations arise from HgI being born in a coherent superposition of vibrational eigenstates.47,48 Fragment vibrational wavepacket motion originates from the ultrashort excitation pulse that triggers the bond breakage in the HgI2 parent molecule.6–8,47 In addition, the initial bond breakage is impulsive compared to the fragment vibrational period and faster than dephasing of nuclear coherence due to random interactions of the reactive system with the solvent environment. Between 400 and 600 nm, the fragments are preferentially probed at the outer turning point of the HgI ground state potential. Therefore, the HgI bond appears to be extended for the first time at approximately 500 fs after bond fission in HgI2. The product vibrational coherence dephases on a time scale of several hundred femtoseconds with a probe wavelength dependent dephasing time constant. This probe wavelength dependence is due to a specific selection of vibrational eigenstates from the overall distribution of eigenstates that compose the product nuclear coherence.8,47
 | ||
| Fig. 1 Wavelength dependence of the magic angle transient absorption of HgI2 in ethanol solution induced at 266 nm. The probe wavelengths are 400, 420, 440, 450, 470, 490, 510, 530, 550, 570, and 590 nm (from back to front). | ||
Furthermore, an underlying slowly varying contribution to the transient absorption is observed which corresponds to a rise of the transient absorption when the probe pulse is tuned to the near-ultraviolet (toward 400 nm). In contrast, when the probe pulse is tuned into the visible spectral region (toward 600 nm), this background contribution displays a distinct decay. Both rising and decaying components reflect the same dynamics of solvent induced energy relaxation of the fragments which are initially born vibrationally excited.49 In addition, the process of geminate recombination of the products may also contribute to these incoherent transient absorptions.
B. Transient anisotropy
The transient anisotropy, r(τ), is related to the time correlation function of the second Legendre polynomial of pump and probe electronic transition dipole moment according to50 | (3) |
Here, θ(τ) is the angle between the transition dipole of the pump transition at time delay τ=0 and that of the probe transition at time delay τ. In the case of a dissociation reaction with the probe pulse being sensitive to the diatomic fragment, θ(τ) denotes the angle between the reactant dipole at τ=0 and the fragment dipole at time delay τ.30,51 At early times, however, the probe transition dipole connects the reactive potential energy surface with higher lying electronic configurations of the system located in the Franck–Condon region for the pump transition and the transition state region for the bimolecular encounter of HgI with I. In other words, for τ=0, the probe transition accesses the next higher lying optically allowed electronic state of the HgI2 parent molecule and, for τ→∞, the probe transition couples the ground and excited states of the HgI fragment. The ensemble average denoted by the angular brackets is an intrinsic property of the experiment and is performed by detection of the probe pulse irradiating a macroscopic sample. It should be mentioned that this ensemble average is not to be mistaken by an equilibrium average. Thus, the experiments described here are capable of measuring a nonequilibrium time correlation function of pump and probe transition dipole during the course of a chemical reaction.
Fig. 2 shows parallel and perpendicular (pump-induced) optical densities for a probe wavelength of 400 nm. The corresponding anisotropy calculated according to eqn. (1) is also shown in Fig. 2. There are several features which are worth pointing out. First, for a pump–probe time delay τ of zero, the anisotropy is negative with an amplitude of almost 0.2. Then, it rises steeply to a value of almost 0.3. This rise coincides with the appearance of the ultrafast feature associated with dynamics in the vicinity of the transition state. However, the maximum of the anisotropy does not coincide with the maximum of the early time transient absorption spike. Instead, r(τ) reaches a maximum on the trailing edge of this feature. Subsequently, the anisotropy decays on a time scale of several picoseconds. This decay is highly non-exponential as visualized more clearly by a semilogarithmic representation of r(τ) (cf. Fig. 2). Finally, distinct coherent oscillations contribute to the anisotropy at delay times below 3 ps. They are characterized by a frequency of 125 cm−1 corresponding to the vibrational frequency of the HgI fragment.
 | ||
| Fig. 2 Experimental pump–probe transient and calculated anisotropy at a probe wavelength of 400 nm. Left column: long-time behavior. Right column: short-time behavior. | ||
On long time scales, the decay can be represented appropriately by an exponential with a time constant of 7.5 ps and an amplitude of 0.065. Inspection of the residuals reveals an additional exponential component with a time constant of 1.5 ps and a corresponding amplitude of 0.06. Yet, at early times below 1 ps, these two exponential components are still unable to reproduce the data satisfactorily. An additional Gaussian component with a correlation time of 300 fs and an amplitude of 0.12 is necessary to account for the early time behavior. In this fitting procedure, the coherent oscillations have not yet been considered explicitly. The origin of these periodic modulations will be addressed later in the discussion. We point out that no physical significance to the functional form of this fitting procedure exists.
IV Discussion
A. Nature of the electronic transitions
The nature of the electronic transitions involved in the photolysis have been assessed by means of magnetic circular dichroism spectra of HgI2 in the gas phase as well as in n-hexane solution.39 An assignment of pump and probe electronic resonances has been recently made by Volk et al. through femtosecond transient anisotropy measurements with a pump pulse centered at 270 nm.31 The data we report in this paper were obtained at a photolysis wavelength of 266 nm. Since the low energy absorption band of HgI2 has a bandwidth of more than 6000 cm−1, these two pump wavelengths are close enough in energy to be directly compared. At 270 nm, the anisotropy displayed a maximum value of 0.15 which is a factor of two smaller than the value observed here with excitation at 266 nm. It was furthermore concluded that the pump transition involved a mixture of electronic transitions that carried 40% 1Πu←1Σg+ and 60% 1Σu−←1Σg+ character.31 Apparently, the time resolution of the experiments reported in ref. 31 was too low and the rather small value of 0.15 seems to result from a distortion of r(τ) due to convolution effects with the finite duration instrument response. In fact, the initial rise of the anisotropy we observe here is characterized by a time constant of 70 fs, which is significantly shorter than the pump pulse duration of 140 fs employed by Volk et al. Further evidence for an insufficient time resolution of these previous experiments can be obtained from the anisotropy at a pump probe time delay of zero. In ref. 31 an initial anisotropy of 0.1 was reported whereas here an r(τ=0) of almost −0.2 is observed. More importantly, the negative anisotropy gives direct evidence for pump and probe transition dipoles which are oriented almost perpendicular to each other. If the resonance associated with the pump were predominantly Πu←Σg+ in nature, then the probe transition at the earliest times must have Πg←Πu symmetry. On the other hand, if the photolyis process involved mainly Σu←Σg+ character, then the probe pulse at vanishing pump–probe time delay connects the Πg and Σu states of HgI2 . Even in the case of a mixed pump transition, a negative anisotropy can be readily explained as resulting from the individual perpendicular probe transitions mentioned above. However, the fact that the maximum anisotropy is 0.3 rather than 0.15 would suggest that, at later times, the probe transition is oriented mainly parallel with respect to the original transition dipole for photolysis. Assuming that, at the maximum anisotropy, the process of bond breakage is complete and the HgI fragment is probed exclusively through its 2Σ←2Σ transition, the pump transition on the parent molecule cannot carry more than 16% 1Πu←1Σg+ symmetry. Such an assignment would be fully consistent with magnetic circular dichroism spectra of HgI2 in liquid solution reported by Savas and Mason.39 However, as was pointed out by Volk et al., if total fragmentation occurs, these estimates can significantly change.31Finally, before we turn to fragment rotational dynamics, we address the issue of reactive wavepacket motion away from the Franck–Condon region initially accessed by the pump. An ultrafast rise of the transient anisotropy was observed which is characterized by a time constant of 70 fs when fitted to an exponential. This rise is caused by the gradual evolution of reactant electronic states into those of the fragments. The initial evolution of the system is directed preferentially toward the transition state region until an asymmetric interaction with the solvent environment leads to motion along the antisymmetric stretching coordinate of the triatomic system, and ultimately, to two-body dissociation. Starting with a Πg←Σu− transition for probing of the HgI2 parent species at τ=0, this initial motion mixes increasingly more 2Σ←2Σ character of the diatomic fragment into the detection resonance thereby effectively rotating the apparent transition dipole by almost 90°. Consequently, the anisotropy rises sharply from −0.2 which is indicative of perpendicular pump and probe transition dipoles at τ=0 to a value of +0.3, signaling almost parallel pump and probe transition dipoles once the transient absorption arises from the pure product resonances uncontaminated from reactant electronic transitions. Therefore, the system spends a characteristic lifetime of 70 fs in the Franck–Condon region and the transition state region. The spatial uncertainties and exact location of the latter are essentially defined by the spectral bandwidth and center frequency of the probe laser in combination with the electronic energy gap associated with detection of the dynamically evolving system.
B. Stretch–bend coupling
As mentioned above, the experimental anisotropy contains distinct coherent oscillations whose frequency is consistent with the vibrational frequency of the product diatom. Such coherent oscillations connected with r(τ) have been observed before in the photodissociation of HgI2 in ethanol, as well as for the triiodide ion in polar protic solvents.30 Interestingly, Volk et al. have observed these oscillations in the time derivative of the transient anisotropy. These have been interpreted as rotation–vibration coupling resulting from the coherent vibrational wavepacket motion of the HgI product.31 As the diatomic fragment stretches, its effective volume increases, thereby increasing the effective moment of inertia of the rotor. As a result, the angular velocity of the rotor is modulated by its own vibrational motion. Such an interpretation was further substantiated by molecular dynamics simulations of the orientational dynamics of the harmonic and anharmonic vibrational wavepackets.31,52The observations reported in this paper are somewhat different in that these coherent oscillations are not only detected in the time derivative of r(τ), but rather in the transient anisotropy directly. This indicates that not only the moment of inertia and, correspondingly, the magnitude of the angular velocity are modulated by the vibrational motion of the fragment. Instead, the sense of the HgI rotation may even be modulated as the diatom undergoes its vibrational motion. Between 400 and 600 nm, the probe pulse is particularly sensitive to the outer turning point along the HgI internuclear distance. In particular, the transient anisotropy exhibits a maximum when the wavepacket moves away from the outer turning point, and a minimum when the vibrational wavepacket approaches its most extended configuration. In other words, whenever the HgI bond becomes compressed (extended), the transition dipole essentially located on the future HgI fragment is slightly rotated towards (away from) the original pump transition dipole which was oriented preferentially along the long axis of the triatomic parent molecule. Such a complex motion can only arise if residual interactions between the fragments exist. Although the overall motion resembles the motion of the free diatomic product, some residual interactions between the fragments lead to coupling between the product vibrational coordinate and the bending coordinate of the reactive triatomic system. In the asymptotic limit of the reaction, this bending vibration correlates with the free rotation of the diatomic product. As a result, coherent oscillations due to these stretch–bend interactions are superimposed on the overall decay of r(τ).
To obtain the pure rotational motion of the fragments freed from stretch–bend motion, the experimental anisotropy is analyzed by performing a linear-prediction singular value decomposition (LPSVD) in terms of exponentially damped cosinusoids:
 | (4) |
Maintaining only those components with frequencies significantly below the vibrational frequency of the HgI fragment results in an anisotropic response which is shown in Fig. 3 together with the raw data.
 | ||
| Fig. 3 Experimental anisotropy at a probe wavelength of 400 nm (open circles) and singular value decomposition (dashed curve) according to eqn. (4). The solid line represents the stretch–bend coupling corrected anisotropy obtained by removing all frequency components oscillating at the HgI vibrational frequency. | ||
Finally, it should be mentioned that an assignment of these coherent vibrational contributions to stretch–bend interaction or to vibration–rotation coupling is not as ambiguous as it might appear. It is also possible that additional electronic transitions contribute to the observed pump-induced optical density which may not be sensitive to the potential energy surface in the asymptotic limit of two-body dissociation. For example, if there is a finite quantum yield for total fragmentation and, furthermore, additional probe resonances are located in the asymptotic limit for this process, then pump-induced parallel and perpendicular optical densities may become unbalanced. Consider, for instance, the system embedded in a solid matrix such that the dissociation is constrained to the collinear geometry and the rotational motion is fully frozen. In such a case, the transient anisotropy should be constant and the vibrational contribution to r(τ) should vanish. If the system is probed through a single resonance only, whose transition dipole is oriented parallel with respect to the pump transition moment, then the ratio of parallel to perpendicular optical densities (containing the coherent wavepacket contribution) is equal to three and is independent of the pump–probe time delay, i.e. the wavepacket contribution cancels exactly. However, an additional perpendicular probe resonance which is not localized in the exit channel for two- body dissociation contributes a non-oscillatory background to ΔODpar and ΔODperp in the proper ratio of 1:2. Thus, parallel and perpendicular optical densities are no longer balanced and the wavepacket contribution no longer cancels. Consequently, oscillations shows up in r(τ). However, the magnitude of the early time anisotropy is consistent with the diatomic fragment being probed exclusively through its 2Σ←2Σ resonance as discussed in Section IVA.
C. Fragment rotational dynamics in the Langevin description
In Section IIIA modifications of the system's electronic structure were found that are caused by the reactive motion in the vicinity of the transition state. Once the system has passed through this critical region of the dissociative potential energy surface, the electronic transition moment for detection is essentially localized on the diatomic fragment. Stretch–bend interactions aside, the subsequent dynamics observed in the transient anisotropy essentially reflects the rotational motion of the HgI fragment in the exit channel for two-body dissociation. Therefore, in the remainder of this paper, only this non-reactive portion of the anisotropy will be discussed. It is assumed that the reactive portion of the anisotropy is completed for delays τ>τmax, where τmax is the time delay at which the anisotropy reaches its maximum.It was shown that the decay of r(τ) cannot be described by a single exponential. Instead a sum of two exponentials and a Gaussian was necessary to quantitatively reproduce the global data from infinite delays back to a delay at which the anisotropy exhibits a maximum. Although such a fitting procedure has no physical significance, it serves as a robust and reliable method for data representation. As mentioned above, the dipole correlation functions must exhibit an inertial component which constitutes 100% of their initial decay at early times. This inertial decay gradually evolves into a purely diffusive, exponential decay on longer time scales. Obviously, a fitting function composed of a sum of two exponentials and a Gaussian at all times is in contradiction with such constraints since both exponential components extrapolate back to zero time delay.
Several models have been proposed to describe this gradual evolution from inertial to diffusive decay of the dipole correlation functions.34 In a Langevin description, the rotating molecule with moment of inertia I (i.e. 1.012×10−44 kg m2 for HgI) is subject to a frictional force proportional to its angular velocity Ω and a stochastically fluctuating torque Q(t)
 | (5) |
In the Markovian limit, the friction coefficient, ζ, is related to the spectral density of the δ-correlated random torques at zero frequency. As a consequence, the angular velocity correlation function decays exponentially with a time constant inversely proportional to the friction coefficient:
 | (6) |
The orientational (Raman) correlation function defined in eqn. (3) can be related to the angular velocity correlation function (AVCF) using a second order cumulant expansion:53,54
 | (7) |
Thus, upon integration, one finds for the anisotropy the expression
 | (8) |
which has the correct functional forms on short as well as long time scales. For t<1/ς, the anisotropy decays as r(t)=2/5 exp(−t2/τc2) where τc=√I/3kBT is the free-rotor correlation time (i.e. 900 fs for HgI at 298 K). In the opposite case where t>1/ς, the anisotropy decays as an exponential r(t)∝ exp(−6kBTt/Iς) and a connection with the well known Stokes–Einstein expression for rotational diffusion can be made.50
Eqn. (8) with different values for the inverse friction coefficient is shown in Fig. 4, together with the experimentally determined decay of r(t) of the HgI fragments generated through the impulsive photolysis of HgI2 in ethanol solution. It is obvious that this Langevin description is unable to reproduce the global decay. Neither the short time nor the long time response can be reproduced even qualitatively. In particular, the inertial decay is much slower than the experimental data.
 | ||
| Fig. 4 Comparison of the experimental anisotropy corrected for stretch–bend coupling (solid curve) with predictions from the Langevin model. The numbers indicate the inverse friction coefficient. | ||
There are in principle two possibilities that may explain the failure of this model: (a) the fragments are formed rotationally excited and are not in thermal equilibrium with their solvent bath at early times, or (b), the Markovian approximation does not hold for this system. The effect of rotational excitation is not so easy to account for within this theoretical framework. This aspect will, however, be addressed later in the discussion. A breakdown of the Markovian approximation can be fully incorporated using a generalized Langevin equation with a time-dependent friction coefficient introduced through a memory function formalism.32–34 Such a treatment will then provide angular velocity correlation functions which do not decay as a simple exponential. Instead, they may go through zero, thereby indicating librational motion of the HgI fragments embedded in the strongly hydrogen bonded solvent cage. In fact, when eqn. (7) is applied to the stretch–bend coupling corrected experimental data, such a behavior is indeed observed (see Fig. 5). However, a closer inspection of the AVCF shows that it does decay roughly exponentially at early times with a time constant of about 100 fs. A more quantitative LPSVD fit to the angular velocity correlation function according to eqn. (4) returns two librational components with frequencies of 28 and 56 cm−1 which are phase shifted by 90° with respect to each other. In addition, an exponential decay with a time constant of 145 fs and an exponential rise with a time constant of 450 fs are necessary to account for the underlying slowly varying background of the AVCF.
 | ||
| Fig. 5 Normalized angular velocity correlation function in a linear representation (upper panel) and semilogarithmic representation of the short-time behavior (lower panel). The inset emphasizes features characteristic for librational motion. | ||
D. Fragment rotational dynamics and extended diffusion models
Before addressing the issue of fragment rotational excitation, two different but related approaches to rotational motion in liquids (called extended diffusion models) shall be discussed which were originally developed by Gordon.24,34,55 In these treatments, the rotor undergoes free rotations which are perturbed by uncorrelated, instantaneous hard-core collisions with the solvent molecules. These collisions do not change the orientation of the rotor, however, they do randomize the direction of the angular momentum vector (m-diffusion model) or, both, the direction and the magnitude of the angular momentum (J-diffusion model). For these extended diffusion models, Gordon has shown that the full time correlation functions (e.g. eqn. (3)) can be expressed in terms of the dipole or Raman correlation functions for an ensemble of free rotors as shown in the Appendix.We applied both models to the transient anisotropy of HgI fragments generated through impulsive photodissociation of HgI2 . Fig. 6 compares the experimental data (corrected for their stretch–bend coupling contribution) with predictions of the m- and J-diffusion model according to eqns. (A10) and (A11) using different values of the mean free rotation time, τcoll . Qualitatively, it can be noticed that both models exhibit the correct functional behavior in both the short and long time regimes. Both models predict an exponential decay of the dipole correlation function in the long time limit indicating diffusively damped rotational motion of the molecules. On short times, the decay resembles the motion of an ensemble of free-rotors with the typical inertial decay. Quantitatively, however, neither model is capable of reproducing the data satisfactorily over the entire time range spanned by the experiment. Both short and long time behavior cannot be fitted simultaneously by either model. Only in the m-diffusion model, it is possible to reproduce the long time tail. In general, the short time decays are again consistently too slow regardless of the mean free collision time chosen. As mentioned before, in applying the Langevin model for rotational motion in liquids, this observation can be interpreted as a breakdown of the Markovian assumption or by the existence of substantial rotational excitation of the diatomic fragments.
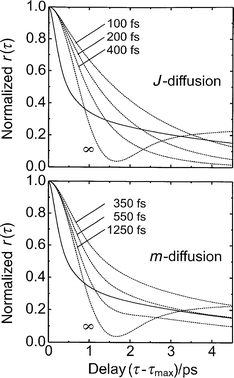 | ||
| Fig. 6 Comparison of the experimental anisotropy corrected for stretch–bend coupling with predictions from the extended diffusion models. Upper panel: J-diffusion model. Lower panel: m-diffusion model. The numbers indicate the mean free rotation time. | ||
E. Fragment rotational excitation
It was shown in the previous sections that both a Langevin type description and an extended diffusion-type description of rotational motion in dense media fail in explaining the entire anisotropy decay of the HgI fragments from the inertial to the diffusive regime. Therefore, it seems reasonable to inspect both limits independently. In the following, only the short time regime of the anisotropy decay is discussed. Here an exact expression is needed that was derived without any constraints with respect to the correlation properties of subsequent collisions or the underlying mechanisms randomizing the spatial components and the magnitude of the angular momentum vector.Although rigorously derived only for equilibrium systems at canonical temperature T, a functional form which describes the decay of the Raman correlation function (i.e. transient anisotropy) at early times exactly is a Taylor series expansion22–24
 | (9) |
where kB is Boltzmann's constant and 〈Q2〉 is the mean squared torque exerted by the solvent onto the rotor with moment of inertia I. The quadratic term represents the inertial contribution to the anisotropy and is determined only by the free-rotor correlation time, τc=√ I/3kBT. Although this functional form seems rather inconvenient, it can be used to extract the free-rotor correlation time of the fragments if they were born in thermal equilibrium with their surrounding solvent:
 | (10) |
By plotting the normalized anisotropy, r(τ)norm, vs. the squared time delay, the slope of the anisotropy extrapolated backward to τ2→0 is inversely proportional to τc2.29,30 The effect of the solvent is to decelerate this free rotational flow of molecules in the fourth power of τ through solvent frictional forces represented by 〈Q2〉. Calculating the residuals, r(τ)−[1−(τ2/τc2)], and plotting them vs. τ4 gives access to these torques, again, through the slope extrapolated back to τ4→0.
In a nonequilibrium situation, as in the case of a dissociation reaction yielding rotationally excited fragments, the initial anisotropy should still decay inertially since this contribution is only determined by the rotational kinetic energy of the rotors. Thus, regardless of the exact shape of the energy distribution in which the fragments are born, their free-rotor correlation time can still be determined by plotting the anisotropy vs. the squared time delay. This free-rotor time constant can then be compared with the correlation time expected for the free rotor at thermal equilibrium with its solvent environment (e.g. at 298 K). On the other hand, the free-rotor time constant expected for the equilibrium system sets an upper limit for the correlation time with which the anisotropy at early times can decay. A considerably faster decay of r(τ) gives immediate evidence for either simple rotational excitation of the fragments, or a pronounced evolution of the system along bending degrees of freedom which rotate the transition dipole at a rate faster than √ 3kBT/I. A clear distinction between these two cases is not at all straightforward as the precise moment of bond fission during the dissociation process has to be identified experimentally in an unambiguous fashion. In the HgI2 system, the transition moment for probing is essentially localized on the diatomic fragment after 200 fs corresponding to the delay of maximum r(τ). This delay may be defined as the moment of bond breakage such that the subsequent dynamics of the anisotropy reveal the inertial component and the free-rotor correlation time of the unperturbed HgI product. Ultimately, the rate with which interfragment interactions decay and the time scale on which the fragments appear in the asymptotic limit of the reaction (i.e. the extent of spatial separation) define such terms as rotational excitation and excited state bending motion.29,30
Fig. 7 shows a plot of the anisotropy of the HgI fragments (corrected for stretch–bent coupling contributions) as a function of the squared time delay (τ−τmax)2 where τmax corresponds to the time delay at which the anisotropy exhibits a maximum. Thus, only the non-reactive portion of r(τ) is shown. From the slope extrapolated to zero time delay, one finds a free-rotor time constant of 0.45 ps. This value is a factor of two smaller than the free-rotor time constant expected for HgI at room temperature, indicating that the diatomic fragments detected at early times rotate significantly faster than at thermal equilibrium with their solvent environment at 298 K. Calculating the residuals and plotting them vs. the time delay raised to the fourth power, yields the mean squared torques, 〈Q2〉, through the slope extrapolated back to (τ−τmax)4→0. Here, we find a value of 6×10−39 J2.
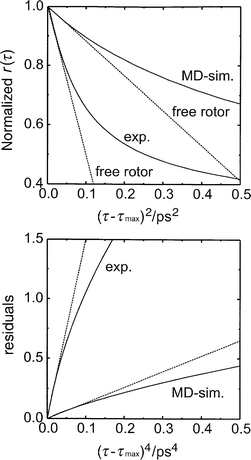 | ||
| Fig. 7 Early-time behavior of the anisotropy. Upper panel: Experimental anisotropy and Raman correlation function from MD-simulation (ref. 31) plotted as a function of the squared time delay. Lower panel: Residuals of the experimental anisotropy and the free-rotor contribution at the rotational temperature TROT and corresponding residuals from MD-simulations at T=298 K (ref. 31). | ||
In photodissociation experiments, the fragments are often born in a Boltzmann distribution characterized by a rotational temperature TROT. In this special case, a free-rotor time constant τc=√ I/3kBTROT of 0.45 ps corresponds to a rotational temperature of the HgI fragments of 1200 K. This temperature will then be distinctly different from the canonical temperature, T, of the liquid solvent bath. Accordingly, the quadratic term of eqn. (10) has to be modified by replacing T with TROT. The next higher term scaling with the fourth power of τ still damps the rotational motion but now contains the rotational temperature of the fragments and the temperature of the solvent bath through the temperature dependence of the mean squared solvent torques. Eqn. (10) can also be rewritten in terms of reduced time units τ*=τ/√ I/kBTROT
 | (11) |
thereby eliminating the rotational kinetic energy dependence of the inertial contribution to the anisotropy decay. Nevertheless, this dependence still remains in higher order terms.
F. Comparison with equilibrium molecular dynamics simulations
Detailed molecular dynamics simulations have been reported by Hochstrasser and co-workers on HgI in liquid ethanol solution.31,52 Equilibrium studies have been used to explore the dynamics of pure rotational motion under bond length constraints for the rotating molecule. Insight into the dynamics of rotational energy dissipation in the linear response regime have been gained through explicit calculations of the angular momentum and rotational energy correlation functions. The former gives evidence for strong torques imparted by the surrounding liquid resulting in pronounced librational motion of the HgI in the hydrogen-bonded solvent cage. The rotational kinetic energy correlation function was found to decay extremely rapidly with a typical time constant of the order of 160 fs. Therefore, it was concluded that any rotational excitation will be relaxed very efficiently by the solvent.31 Nonequilibrium studies, on the other hand, have mostly addressed the effect of coherent vibrational motion on the rotational dynamics in solution.52 It was found that vibrational motion and the concurrent modulation of the charge distribution of the HgI rotor strongly affect the pure dephasing rate of the vibrational coherence through nonadiabatic solvation. Furthermore, the wavepacket motion does not alter the time scale of overall rotational motion although its presence is evident through oscillations in the time derivative of the anisotropy. However, nonequilibrium simulations of rotationally excited HgI were not performed.In Fig. 8, the product portion (i.e. for τ>τmax where τmax is the time delay at which r(τ) reaches a maximum) of the normalized experimental anisotropy is compared with the Raman correlation function obtained from equilibrium MD simulations on HgI in ethanol. In contrast to the observation made by Volk et al., it seems obvious that our experiment is not at all in good agreement with the calculations. The better time resolution of our experiments clearly reveals an inertial decay which is much faster than expected for equilibrated HgI molecules in ethanol solution at room temperature.
 | ||
| Fig. 8 Comparison of the stretch–bend coupling corrected experimental anisotropy (solid curve) with equilibrium MD-simulations from ref. 31 performed at room temperature (short dash). The long dashed curve shows the anisotropy of an ensemble of free rotors at room temperature. Upper panel: Anisotropy plotted as a function of time. Lower panel: Anisotropy plotted as a function of reduced time units √ I/kBTROT, where TROT=1200 K for the experimental data and TROT=298 K for the MD-simulation, respectively. | ||
A comparison of the early time portion is emphasized in Fig. 7 where both curves are plotted as a function of the squared time delay. Of course, the MD simulation must exhibit a slope at zero time delay which corresponds to the free rotor time constant at room temperature. The mean squared torques obtained by plotting the residuals of the MD Raman correlation function and its free-rotor contribution vs. (τ−τmax)4 have a value of 6×10−40 J2 indicating strong solute–solvent coupling expected for a system which is dominated by long-range dipole–dipole interactions.
In the long time limit, an exponential component with a time constant of 7.5 ps was found experimentally and was identified as the rotational diffusion time constant. In ref. 31, a time constant of 8 to 10 ps was reported which is in qualitative agreement with our results. The MD simulation exhibits a long time tail which has only been calculated for delay times up to 5 ps. This is certainly not sufficient to accurately extract rotational diffusion time constants that are larger than 2 ps. However, when fitted to an exponential, this long time tail reveals a time constant of roughly 6 ps. In any case, the relative amplitude of this long time tail is much larger than the diffusive contribution to the experimental anisotropy. Therefore, even in the long time limit (τ≈5 ps), the agreement between MD simulation and experiment is not at all satisfactory. By using rotational temperatures of 1200 K for the experiment and 298 K for the MD simulation, both quantities can be plotted as a function of reduced time units according to eqn. (11). In such a representation, a very good agreement is found for the early time behavior which demonstrates again that the HgI fragment indeed rotates faster than at room temperature. Due to a different temperature dependence of higher terms in the series expansion, this agreement should disappear with increasing delay.
G. Fragment rotational excitation and dissociative potential surface
It was demonstrated above that, at early times after the process of bond breakage is completed, the fragments rotate significantly faster than at room temperature. Fragment rotational excitation can arise from either of the following three sources:56 (a) overall rotational excitation of the ground-state parent molecule (before impulsive excitation and bond breakage has taken place) results in an increase of the total angular momentum of the fragments. (b) Excitation of the bending vibration of the ground-state parent molecule translates into rotational excitation of the diatomic product in the asymptotic limit for two-body dissociation. Since motion along the bending coordinate essentially corresponds to a hindered rotation of the future diatomic fragment, bending excitation translates into rotational motion of the diatomic product about its own center-of-mass. Finally, (c) anisotropic gradients of the dissociative potential energy surface can generate torques on the diatom during its recoil motion away from the monatomic fragment. In this case, the final rotational state distribution mainly reflects the topology of the upper excited electronic state of the parent molecule.Especially, the latter possibility has to be taken into account since it is known from quantum chemical calculations using effective core potentials that, at least under isolated molecule conditions, the excited states of mercury dihalides are significantly bent.38 Further support for a pronounced evolution along the bending coordinates at early times after ultraviolet irradiation stems from gas phase linear absorption spectra of HgI2.39 Long progressions in the bending vibration can be observed that structure the high energy resonance of the parent molecule and provide a strong indication of excited states which are bent and therefore Franck–Condon shifted relative to the linear ground states.
Femtosecond transient anisotropy measurements of the 308 nm photolysis of mercury diiodide in supersonic jet expansions have been performed by Zewail and co-workers.43,44 In these studies, it was found that the HgI fragment is also born with a substantial amount of excess rotational energy.51 In particular, rotational product distributions were reported whose functional form can be described by a Gaussian with a central rotational quantum number of jmax=80 and a corresponding half width at 1/e of Δj=90. In turn, such a distribution would be consistent with a free-rotor time constant of 700 fs which lies between the room temperature value of 900 fs and the liquid phase value of 450 fs reported in this paper. Obviously, in the gas phase, excitation into the low energy resonance leads to molecular excited states of HgI2 which have strong gradients along the bending coordinate. It seems highly unlikely that these anisotropic gradients are eliminated upon solvation by the condensed environment and a purely symmetric evolution away from the Franck–Condon region is favored in liquid solution. Instead, a further distortion along the bending coordinate can be expected in going from the gas phase into the highly dense liquid. Increased gradients and, consequently, a more rapid evolution along the bending degrees of freedom then rationalize a further decrease of the free-rotor time constant in solution and an increased fragment rotational excitation as compared to the gas phase. Whether this rotational excitation persists until the fragments have reached the asymptotic limit of the reaction still remains an open question.
V Conclusions
Femtosecond transient anisotropy measurements have been performed in order to elucidate the nature of the electronic states, the reactive motion, and the rotational dynamics involved in the ultrafast 266 nm photodissociation of HgI2 in liquid ethanol solution. The early time reactive motion involving bond breakage can be observed in real time through an increasing anisotropy due to an effective rotation of the probe transition dipole by almost 90° in the molecular frame of the parent molecule. After this reactive portion is completed, the orientational distribution of the diatomic fragment randomizes in a highly complex fashion. In contrast to previous investigations, the product anisotropy was found to be in remarkable disagreement with corresponding molecular dynamics simulations of solvated HgI equilibrated with its solvent environment. At very early times, an inertial component to the product Raman correlation function can be observed which reveals a high degree of fragment rotational excess energy consistent with complementary studies of the dissociation reaction in supersonic jet expansions. It is argued that rotational excitation of the diatomic fragment originates from pronounced anisotropic gradients of the reactive potential energy surface in the transition state region and the Franck–Condon region for photolysis. Further nonequilibrium molecular dynamics simulation on rotationally excited HgI are necessary in order to explore the time scales and the nature for rotational energy dissipation in liquid solution. Such calculations are currently in progress in our group.The Raman correlation function of the free diatomic rotor can be evaluated numerically according to | (A1) |
from the equilibrium canonical distribution, p(Ω0), of angular velocities, Ω0:
 | (A2) |
Suppose that during time t, a set of molecules will be perturbed by n−1 collisions. Therefore, each of these molecules will then undergo n number of free rotations and the n−1 collisions will take place at different instants in time. In the J-diffusion limit, the average dipole correlation function for those molecules having undergone n free rotational steps is defined as56
 | (A3) |
In the case of n=1, this expression is simply given by the free-rotor dipole correlation function weighted by the probability, exp(−t/τcoll), that a molecule has not suffered a collision in time t.
 | (A4) |
Therefore, τcoll represents the mean free rotation time. Since subsequent collisions are assumed to be uncorrelated, one can express multiple collision correlation functions as convolution integrals56
 | (A5) |
where the fraction of those molecules having suffered one collision between t′ and t′+dt′ is inversely proportional to the
mean free rotation time. These convolution integrals can be solved by defining the complex Laplace transform, ![[L with combining circumflex]](https://www.rsc.org/images/entities/i_char_004c_0302.gif) (s), the cosine transform, Ĉ(ω) and the sine transform, Ŝ(ω),
(s), the cosine transform, Ĉ(ω) and the sine transform, Ŝ(ω),
 | (A6) |
where s=iω is the Laplace variable and the angular brackets denote the specific average over Ω0 (according to the m- and J-diffusion constraints). Calculating the Laplace transform of eqns. (A4) and (A5) yields
 | (A7) |
and iterating over n, results in
 | (A8) |
Calculating the Laplace transform of eqn. (3) can finally be performed by summing over n explicitly
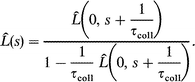 | (A9) |
Since the dipole correlation function is a real and even function, its spectral density Î(ω) is easily calculated for the J-diffusion
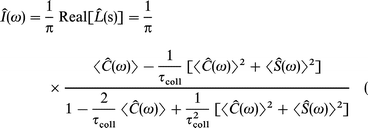 | (A10) |
and for the m-diffusion, respectively
 | (A11) |
The full dipole correlation function according to eqn. (3) is then recovered by simple inverse Fourier transformation of eqns. (A10) and (A11). It should be noted that expressions for rotational correlation times in the m- and J-diffusion limit are readily obtained from the normalized spectral density at zero frequency (see. eqn. (A9), i.e. for s=0).34,55
Acknowledgements
Financial support by the Deutsche Forschungsgemeinschaft (SFB 357: ‘‘Molekulare Mechanismen Unimolekularer Reaktionen,’’ SFB 195: ‘‘ Elektronen in Mikroskopischen und Makroskopischen Systemen,’’ and Schwerpunktprogramm ‘‘Femtosekundenspektroskopie elementarer Anregungen in Atomen, Molekülen und Clustern’’) is gratefully acknowledged.References
- J. Chesnoy and G. M. Gale, Adv. Chem. Phys., 1988, 70, 297 Search PubMed.
- J. C. Owrutsky, D. Raftery and R. M. Hochstrasser, Annu. Rev. Phys. Chem., 1994, 45, 519 CrossRef CAS.
- D. E. Smith and C. B. Harris, J. Chem. Phys., 1990, 92, 1312 CrossRef CAS.
- J. Z. Zhang and C. B. Harris, J. Chem. Phys., 1991, 94, 5586 CrossRef CAS.
- U. Banin, R. Kosloff and S. Ruhman, Isr. J. Chem., 1993, 33, 141 Search PubMed.
- T. Kühne and P. Vöhringer, J. Chem. Phys., 1996, 105, 10788 CrossRef.
- T. Kühne, R. Küster and P. Vöhringer, Chem. Phys., 1998, 233, 161 CrossRef CAS.
- J. A. Poulsen, C. L. Thomsen, S. R. Keiding and J. Thogersen, J. Chem. Phys., 1998, 108, 8461 CrossRef.
- D. Schwarzer, J. Troe and M. Zerezke, J. Chem. Phys., 1997, 107, 8380 CrossRef CAS.
- D. Schwarzer, J. Troe, M. Votsmeier and M. Zerezke, J. Chem. Phys., 1996, 105, 3121 CrossRef CAS.
- P. Hamm, M. Lim and R. M. Hochstrasser, J. Chem. Phys., 1997, 107, 10523 CrossRef CAS.
- M. Lim, S. Gnanakaran and R. M. Hochstrasser, J. Chem. Phys., 1997, 106, 3485 CrossRef CAS.
- K. E. Schultz, D. J. Russell and C. B. Harris, J. Chem. Phys., 1992, 97, 5431 CrossRef CAS.
- R. M. Whitnell, K. R. Wilson and J. T. Hynes, J. Phys. Chem., 1990, 94, 8625 CrossRef CAS.
- R. M. Whitnell, K. R. Wilson and J. T. Hynes, J. Chem. Phys., 1992, 96, 5354 CrossRef CAS.
- V. S. Vikhrenko, C. Heidelbach, D. Schwarzer, V. B. Nemtsov and J. Schroeder, J. Chem. Phys., 1999, 110, 5273 CrossRef CAS.
- M. Tuckerman and B. J. Berne, J. Chem. Phys., 1993, 98, 7301 CrossRef CAS.
- S. A. Egorov and J. L. Skinner, J. Chem. Phys., 1996, 105, 7047 CrossRef CAS.
- M. Cho., J. Chem. Phys., 1996, 105, 10755 CrossRef CAS.
- I. Benjamin and R. M. Whitnell, Chem. Phys. Lett., 1993, 204, 45 CrossRef CAS.
- P. Hamm, S. M. Ohline and W. Zinth, J. Chem. Phys., 1997, 106, 519 CrossRef CAS.
- R. G. Gordon, J. Chem. Phys., 1965, 43, 1307 CrossRef CAS.
- R. G. Gordon, J. Chem. Phys., 1965, 42, 3658 CrossRef CAS.
- R. G. Gordon, J. Chem. Phys., 1966, 44, 1830 CrossRef CAS.
- A. von Jena and H. E. Lessing, Chem. Phys. Lett., 1976, 42, 213 CrossRef.
- A. von Jena and H. E. Lessing, Chem. Phys., 1979, 40, 245 CrossRef CAS.
- A. von Jena and H. E. Lessing, Ber. Bunsen-Ges. Phys. Chem., 1979, 83, 181 Search PubMed.
- A. B. Myers, M. A. Pereira, P. L. Holt and R. M. Hochstrasser, J. Chem, Phys., 1987, 86, 5146 CrossRef CAS.
- S. Hess, H. Hippler, T. Kühne and P. Vöhringer, J. Phys. Chem. A, 1999, 103, 5623 CrossRef CAS.
- T. Kühne and P. Vöhringer., J. Phys. Chem. A, 1998, 102, 4177 CrossRef.
- M. Volk, S. Gnanakaran, E. Gooding, Y. Khodolenko, N. Pugliano and R. M. Hochstrasser, J. Phys. Chem., 1997, 101, 638 CrossRef CAS.
- W. A. Steele, J. Chem. Phys., 1963, 38, 2404 CrossRef CAS.
- W. A. Steele, J. Chem. Phys., 1963, 38, 2411 CrossRef CAS.
- W. A. Steele, Adv. Chem. Phys., 1976, 34, 1 Search PubMed.
- A. E. Johnson and A. B. Myers, J. Phys. Chem., 1996, 100, 7778 CrossRef CAS.
- H. Sato, F. Hirata and A. B. Myers, J. Phys. Chem. A, 1998, 102, 2065 CrossRef CAS.
- T. Koslowski and P. Vöhringer, in preparation..
- W. R. Wadt, J. Chem. Phys., 1980, 72, 2469 CrossRef CAS.
- M. M. Savas and W. R. Mason, Inorg. Chem., 1988, 27, 658 CrossRef CAS.
- H. Hofmann and S. R. Leone, J. Chem. Phys., 1978, 69, 3819 CrossRef CAS.
- J. Maya, J. Chem. Phys., 1977, 67, 4976 CrossRef CAS.
- J. Maya, IEEE J. Quantum Electron., 1979, QE-15, 579 CrossRef.
- M. Dantus, R. M. Bowman, M. Gruebele and A. H. Zewail, J. Chem. Phys., 1989, 91, 7437 CrossRef CAS.
- M. Gruebele, G. Roberts and A. H. Zewail, Philos. Trans. R. Soc. London, Ser. A, 1990, 332, 223 Search PubMed.
- N. Pugliano, D. K. Palit, A. Z. Szarka and R. M. Hochstrasser, J. Chem. Phys., 1993, 99, 7273 CrossRef CAS.
- K. S. Viswanathan and J. Telinghuisen, J. Mol. Spectrosc., 1983, 98, 185 CrossRef CAS.
- N. Pugliano, A. Z. Szarka and R. M. Hochstrasser, J. Chem. Phys., 1996, 104, 5062 CrossRef CAS.
- N. Pugliano, S. Gnanakaran and R. M. Hochstrasser, J. Photochem. Photobiol. A, 1996, 102, 21 Search PubMed.
- N. Pugliano, A. Z. Szarka, S. Gnanakaran, M. Treichel and R. M. Hochstrasser, J. Chem. Phys., 1995, 103, 6498 CrossRef CAS.
- G. R. Fleming, Chemical applications of ultrafast spectroscopy, Oxford University Press, New York, 1986. Search PubMed.
- M. Dantus, R. M. Bowman, J. S. Baskin and A. H. Zewail, Chem. Phys. Lett., 1989, 159, 406 CrossRef CAS.
- S. Gnanakaran and R. M. Hochstrasser, Int. J. Quantum Chem., 1999, 72, 451 CrossRef CAS.
- R. Kubo, J. Phys. Soc. Jpn., 1962, 17, 1100 Search PubMed.
- J. S. Baskin, M. Gupta, M. Chachisvilis and A. H. Zewail, Chem. Phys. Lett., 1997, 275, 437 CrossRef CAS.
- B. J. Berne and R. Pecora, Dynamic light scattering, John Wiley, New York, 1976. Search PubMed.
- R. Schinke, Photodissociation dynamics, Cambridge University Press, Cambridge, 1993. Search PubMed.
| This journal is © the Owner Societies 2000 |