Phase transfer catalysts between polar and non-polar media: a molecular dynamics simulation of tetrabutylammonium iodide at the formamide/hexane interface
Received 20th September 1999, Accepted 12th November 1999
First published on UnassignedUnassigned22nd December 1999
Abstract
A molecular dynamics simulation of tetrabutylammonium iodide (TBAI) in the free liquid surface of
formamide (FA) and in the interface of formamide and hexane (HX) was performed. TBAI was treated as 18
sites in a flexible model, five sites were employed for formamide and six for hexane. The simulation lasted 425
ps for each system at 300 K. Dynamic and orientational properties of both systems are discussed. The
thickness of the polar/non-polar interface amounts to 10–14 Å. Furthermore, the anion moves over large
distances in the polar phase whereas the cation remains in the interface. Penetration into the non-polar liquid
is not observed for either ionic species. Only a minor influence of the salt on the orientation of formamide,
which is preferential at the surface compared with the bulk, is observed and a minor effect on the length
distribution of the hexane as a measure of the coiled or elongated arrangement is found.
1 Introduction
In synthetic organic chemistry, transfer reactions between
organic and inorganic phases often have to be catalysed. The
basic concepts in this field of phase transfer catalysis (PTC)
have been described by Makosza and Serafinowa,1 Starks2
and Brändström.3 Different catalysts differ in their efficiency,
i.e., the ionic transfer rate; an overview was given by
Dehmlow and Dehmlow.4 One class of reagents regarded as
most effective is the tetraalkylonium salts, and extensive
studies have been carried out of different properties such as
activity coefficients,5 osmotic coefficients,6 solution behaviour,7 surface tension8 and Raman9
and NMR spectra.10The fact that the anions are hydrophilic and the cations are
hydrophobic owing to their CH2/CH3 groups in polar solvents
was described in terms of electric double layers, a
concept based on the work of Helmholtz,11 Gouy,12,13
Chapman14 and Stern.15 It gave rise to the question in which
phase the catalytic process itself would take place. Some
studies2,16 suggested the cation as phase transferring whereas
this was attributed to the anion in others.17,18
In PTC, two substances each in one separate phase
(polar⇌non-polar) react with each other in the presence of a catalytic
reagent. The place of interest is therefore the phase boundary
between the polar and non-polar solvent with an embedded
salt.
Experimental
methods sensitive for the interphase region
were therefore applied for clarification. Electron spectroscopy
fulfils this demand because of the low mean free path of the
electrons of up to only a few nanometres. This technique was
adapted for liquid surfaces in 1973 by Siegbahn and Siegbahn
[X-ray photoelectron spectroscopy (XPS), electron spectroscopy
for chemical analysis (ESCA)].19 A first investigation of
phase transfer catalysts was performed by Ballard et al. using
ultraviolet photoelectron spectroscopy (UPS),20 and subsequently
more detailed studies were carried out by Siegbahn
and co-workers.21–25
Another electron spectroscopic technique
was presented by Keller et al. in 1986,26viz., metastable
induced electron spectroscopy (MIES), which is highly surface
sensitive owing to the repulsive interaction potential, meaning
that excited helium atoms (having thermal kinetic energies
and an electronic energy of 19.8 eV in the triplet state) cannot
penetrate into the liquid. The spectra therefore yield information
on the outermost surface layers. The PTC reagent tetrabutylammonium
iodide has been investigated using
MIES.27,28 A summary of results on all phase transfer catalysts
explored with MIES so far was recently given by Oderbrodhage.29
This high surface sensitivity of electron spectroscopy means
in this case that an interface between two solvents cannot be
accessed because the polar liquid is covered by the second
liquid with a macroscopic thickness. All studies applying electron spectroscopy therefore have to be carried out at a liquid/vacuum interface which serves as a model system for the real
situation.
Owing to this experimental restriction, the aim of the
present study was to use molecular dynamics computer simulation
to study the behaviour of one phase transfer catalyst
between two different solvents. This was performed in two
main steps. In the first, the surface of formamide (HCONH2)
(FA) enriched with tetrabutylammonium iodide [(C4H9)4NI]
(TBAI) was simulated. Subsequently hexane (C6H14) (HX)
molecules were adsorbed from the gas phase. This configuration
was kept together by two compressing walls below the
formamide and above the hexane for equilibration. The
second step was performed by removing the restricting walls,
simulating a free slab of this two-phase system. Different
properties of all three conditions were then compared.
In Section 2, details of the simulation and potential parameters
are outlined, Section 3 deals with results on different
orientational and dynamic properties of the two systems and
these are discussed in Section 4.
2 The model
system and simulation parameters
2.1 Simulation parameters
The
interaction potentials used consist of two parts, intermo
lecular and intramolecular. The parameters for the respective
molecules
listed in Tables 1–4 were adapted from the GROMOS
force field.30 The interaction within one molecule is
constituted by bending, stretching and dihedral contributions.
Furthermore, Lennard-Jones interaction between different
atomic sites can explicitly be rejected and a specific Coulomb
term can be taken into account:
Table 1
Parameters of formamide moleculea
| Atoms: 5 |
|---|
| |
|---|
| Atom | na | Mass/u | Charge (e) | √
C12/(eV Å12)1/2 | √
C6/(eV Å6)1/2 |
|---|
| |
|---|
| C | 1 | 13 | 0.50 | 425.38 | 7.752 |
| O | 2 | 16 | −0.50 | 128.41 | 4.951 |
| N | 3 | 14 | −0.85 | 202.42 | 5.897 |
| H2 | 4 | 1 | 0.425 | 0.00 | 0.0 |
| H3 | 5 | 1 | 0.425 | 0.00 | 0.0 |
| Stretching: 4 |
|---|
| |
|---|
| na 1 | na 2 | b0/Å | kb/eV Å−2 |
|---|
| |
|---|
| 1 | 2 | 1.229 | 52.07 |
| 1 | 3 | 1.335 | 43.39 |
| 3 | 4 | 0.960 | 38.83 |
| 3 | 5 | 0.960 | 38.83 |
| Bending: 4 |
|---|
| |
|---|
| na 1 | na 2 | na 3 | Θ0 (°) | kΘ/eV°−1 |
|---|
| |
|---|
| 2 | 1 | 3 | 122.90 | 5.207 |
| 1 | 3 | 4 | 119.80 | 3.037 |
| 1 | 3 | 5 | 119.80 | 3.037 |
| 4 | 3 | 5 | 120.40 | 3.471 |
| Dihedrals: 2 |
|---|
| |
|---|
| na 1 | na 2 | na 3 | na 4 | a0 | a1 | a2 | a3 | a4 | a5 |
|---|
| |
|---|
| na=number of atoms. |
|---|
| 2 | 1 | 3 | 5 | 0.4339 | 0 | −0.4339 | 0 | 0 | 0 |
| 2 | 1 | 3 | 4 | 0.4339 | 0 | −0.4339 | 0 | 0 | 0 |
Table 2
Parameters of tetrabutylamoniumiodide moleculea
| Atoms: 18 |
|---|
| |
|---|
| Atom | na | Mass/u | Charge (e) | √
C12/(eV Å12)1/2 | √
C6/(eV Å6)1/2 |
|---|
| |
|---|
| N+ | 1 | 14 | −0.56 | 202.43 | 5.897 |
| CH2 | 2 | 14 | 0.39 | 507.35 | 8.520 |
| CH2 | 3 | 14 | 0 | 507.35 | 8.520 |
| CH2 | 4 | 14 | 0 | 507.35 | 8.520 |
| CH3 | 5 | 15 | 0 | 618.08 | 10.380 |
| o | o | o | o | o | o |
| I− | 18 | 127 | −1 | 4795 | 30.970 |
| Stretching: 22 |
|---|
| |
|---|
| na 1 | na 2 | b0/Å | kb/eV Å−2 | na 1 | na 2 | b0/Å | kb/eV Å−2 |
|---|
| |
|---|
| Parameters are listed for only one of the four alkyl branches. na=number of atoms. |
|---|
| 1 | 2 | 1.51 | 70 | 3 | 4 | 1.52 | 34.703 |
| 2 | 3 | 1.52 | 34.703 | 4 | 5 | 1.54 | 34.703 |
Table 3
Parameters of tetrabutylamonium iodide molecule (second part)a
| Bending: 12, parameters apply for all bending interactions |
|---|
| |
|---|
| na 1 | na 2 | na 3 | Θ0 (°) | kΘ/eV°−1 |
|---|
| |
|---|
| 1 | 2 | 3 | 109.47 | 2.601 |
| Dihedrals: 8, parameters apply for all dihedral interactions |
|---|
| |
|---|
| na 1 | na 2 | na 3 | na 4 | a0 | a1 | a2 | a3 | a4 | a5 |
|---|
| |
|---|
| 1 | 2 | 3 | 4 | 0.09617 | −0.125986 | −0.135982 | 0.031712 | 0.271965 | 0.3264265 |
| Excluded Lennard-Jones J: 12 |
|---|
| |
|---|
| na 1 | na 2 | na 1 | na 2 | na 1 | na 2 |
|---|
| |
|---|
| 2 | 7 | 2 | 11 | 2 | 15 |
| 6 | 3 | 6 | 11 | 6 | 15 |
| 10 | 3 | 10 | 7 | 10 | 15 |
| 14 | 3 | 14 | 7 | 14 | 11 |
| Included Coulomb: 6 |
|---|
| |
|---|
| na 1 | na 2 | na 1 | na 2 | na 1 | na 2 |
|---|
| |
|---|
| na=number of atoms. |
|---|
| 18 | 1 | 18 | 2 | 18 | 6 |
| 18 | 10 | 18 | 14 | |
Table 4
Parameters of hexane moleculea
| Atoms: 6 |
|---|
| |
|---|
| Atom | na | mass/u | charge (e) | √
C12/(eV Å12)1/2 | √C6/(eV Å6)1/2 |
|---|
| |
|---|
| CH3 | 1 | 15 | 0 | 618.08 | 10.380 |
| CH2 | 2 | 14 | 0 | 507.35 | 8.520 |
| Stretching: 5, parameters apply for all stretching interactions |
|---|
| |
|---|
| na 1 | na 2 | b0/Å | kb/eV Å−2 |
|---|
| |
|---|
| 1 | 2 | 1.54 | 34.703 |
| Bending: 4, parameters apply for all bending interactions |
|---|
| |
|---|
| na 1 | na 2 | na 3 | Θ0 (°) | kΘ/eV °−1 |
|---|
| |
|---|
| 1 | 2 | 3 | 109.47 | 2.601 |
| Dihedrals: 3, parameters apply for all dihedral interactions |
|---|
| |
|---|
| na 1 | na 2 | na 3 | na 4 | a0 | a1 | a2 | a3 | a4 | a5 |
|---|
| |
|---|
| 1 | 2 | 3 | 4 | 0.09617 | −0.125986 | −0.135982 | 0.031712 | 0.271965 | 0.326426 |
| Excluded Lennard-Jones: 2 |
|---|
| |
|---|
| na 1 | na 2 |
|---|
| |
|---|
| na=number of atoms. |
|---|
| 1 | 5 |
| 2 | 6 |
Table 5
Diffusion constants (Å2 ps−1)
| bx | by | bz | isx | isy | isz | osx | osy | osz |
|---|
| |
|---|
| FA— |
| System 1 | 0.1345 | 0.1378 | 0.1284 | 0.1496 | 0.1621 | 0.1318 | 0.1840 | 0.2523 | 0.1604 |
| System 2 | 0.3413 | 0.3074 | 0.3273 | 0.3208 | 0.2986 | 0.2901 | 0.5461 | 0.5541 | 0.3912 |
| HX— |
| System 2 | 0.3549 | 0.3632 | 0.2973 | 0.3633 | 0.3186 | 0.2681 | 0.6604 | 0.5658 | 0.6033 |
| TBAI— |
| System 1 | 0.0728 | 0.1188 | 0.0544 |
| System 2 | 0.1401 | 0.1354 | 0.1142 |
| N(TBAI)— |
| System 1 | 0.1485 | 0.1685 | 0.0702 |
| System 2 | 0.1366 | 0.1132 | 0.0893 |
| I(TBAI)— |
| System 1 | 0.0785 | 0.0870 | 0.0450 |
| System 2 | 0.2020 | 0.1704 | 0.1090 |
 |
| | Scheme 1 | |
Formamide, shown in Fig. 1, is represented by a five-site model.
H1 is condensed into the carbon atom and not treated explicitly.
For the TBAI molecule (Fig. 2) CH3 and CH2 g
roups of the alkyl chains are also taken as one site each. Between
the I− and the remaining cation, no preferential distance
is given. It can move freely, only coupled by Coulomb forces.
This is important in order to investigate the behaviour of
both ionic species seperately. In the case of hexane (Fig. 3) the
same applies as for the butyl tetrahedron: CH3 and CH2 groups are represented as one site.
 |
| | Fig. 1 Formamide,
the polar solvent simulated. | |
 |
| | Fig. 2 Tetrabutylammonium iodide (TBAI), the PTC catalyst studied as reference system with MIES. | |
 |
| | Fig. 3 The hexane molecule simulated as a non-polar phase. | |
The support planes used to keep the system in a planar
geometry during the equilibration are mirror planes with
Lennard-Jones centers at the (x, y, −z)-position of the respective
simulated site. Simulation of a free liquid surface was
realized with periodic boundary conditions in x and y (the
surface plane) with a size of (25.8 Å)2. The walls in z perpend
icular to the surface have a distance of 1000 Å. Since this geometry
is in principle periodic in z, an Ewald summation was not
carried out because the number of k-vectors to be calculated would have been high. Instead, a shiftet force algorithm
was used with a cut-off distance of 9.5 Å for van der Waals interaction
and 11.5 Å for the Coulomb part, respectively. A 0.5 fs time step and neighbour list updated every tenth step
were used. The final runs were all performed with a fixed temperature
of 300 K.
2.2 Setting up the
ensembles
In
system 1, the slab of formamide contains 256 molecules.
Four TBAI molecules were adsorbed from the gas phase via a
start velocity in the −z direction towards the formamide/vacuum
interface. This two-component system was then equilibrated
for 200 ps. Subsequently, three runs of 142 ps each
were performed to evaluate the data presented in the next
section. They reveal information of a free surface of FA (named
FA/vacuum interface) and FA with embedded salt (named
FA–TBAI/vacuum interface).The
three-component system of FA, TBAI and HX was built
up from system 1 by adding 256 hexanes as a grid of 8×8×4
above the FA+TBAI surface. Below the formamide slab, i.e. the FA/vacuum interface without salt, a support
plane was installed in order to keep the lower boundary fixed.
A second support plane above the hexane was lowered
with a velocity of 0.7 Å ps−1 condensing the gas-phase hexane
until both planes had a distance of 96 Å. With fixed support
planes an equilibration of 177 ps was performed before the
system was compressed further to a thickness (better:
distance of the support planes) of 77 Å. As for system 1, three runs
of 142 ps duration each were used for further equilibration.
In
order to simulate a free liquid bilayer with enclosed salt
in system 2, the support planes were set to a distance of 109 Å and
equilibrated for further 282 ps. Subsequently the planes were
removed totally and in a test run of 35 ps the stability of the system was found to be satisfactory. No evaporation or broadening
was observed. In three runs of 142 ps each different
results presented in the next section were obtained for three
different interfaces: formamide/vacuum (lower surface), th
e FA–TBAI/hexane interface with embedded salt (inner surface)
and the hexane/vacuum interface (upper suface).
In
addition to the interfaces mentioned above, we also
looked at the behaviour of the liquid bulk phases of FA and
HX not influenced by either the interface with vacuum or by
embedded TBAI.
3 Results
3.1 System 1: formamide+tetrabutylammonium
iodide
Fig.
4 shows the depth profile of the solution of TBAI in formamide.
Since we are especially interested in the salt behaviour,
only the interface region is enlarged in the plot. The line
labeled FA represents the formamide contribution. TBAI
denotes the sum over all 18 sites of the salt, N+ the nitrogen contribution
representing the central atom of the cation and I−
the anion depth distribution. The signals for TBAI, N+ and
I− are enlarged in the y-direction for clarity.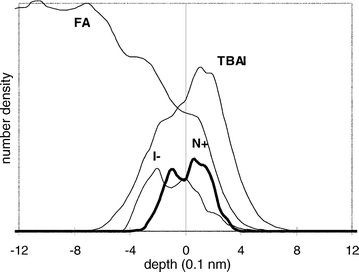 |
| | Fig. 4 Particle
number density for the FA–TBAI/vacuum interface. | |
The density profile of the complete salt which is dominated
by the hydrocarbon chains (16 of 18 sites) reflects the hydrophobicity
of the cation: the butyl tetrahedron has a tendency
to be positioned in the outermost surface layer. N+ and I− show
slightly different behaviour. As the central atom of the cation,
the nitrogen more or less resembles the number density profile
of the entire molecule. In contrast, the centre of the anion distribution is shifted away from the surface towards the
bulk phase of formamide.
The
mobility of the different species was the next value to
be analysed. As a measure for the translational dynamics the
mean square displacement in all three directions was used,
defined by
| |  | (1) |
Fig.
5 shows the mean square displacement for the solvent
formamide. For t→∞ the slope equals the diffusion constant. The
three different lines represent the motion in the three Cartesian directions. The resulting diffusion values are listed in Table
5. The rows bx, by, bz represent bulk values in the x-, y- and
z-directions, isxyz denotes the inner surface and osxyz denotes the outer surface values. Diffusion constants are given for FA,
HX, TBAI and for the central cation atom and the anion
separately. System 1 is the case without hexane and system
2 is the free liquid slab with polar and non-polar phases.
 |
| | Fig. 5 Mean
square displacement. | |
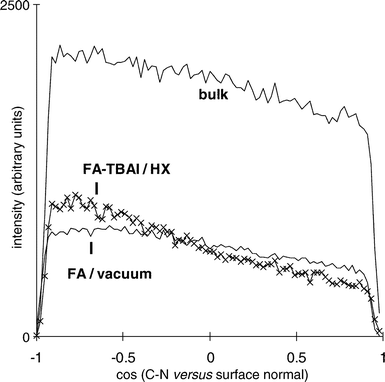
The orientation of the formamide molecule depending on its
location (bulk or surface) was the next feature to be evaluated.
As representive of the C–N bond, the FA backbone, was taken.
Fig. 6 shows its orientation with respect to the surface normal, the z-axis. The values for the interfaces are normalized
to each other for better comparison. For the bulk region an
equal angular distribution is found. The molecules which are
affected neither by the liquid/vacuum interface nor by the presence
of the salt in the other surface are randomly oriented. Formamide
in the interfacial regions deviates from the equal distribution
and reveals a preferential orientation. A cosine of −1 on
the left on the abscissa denotes a C–N bond perpendicular
to the surface with nitrogen pointing towards the liquid
and the C-atom exposed to vacuum and vice versa for a cosine
of 1 on the right. In both interfaces the formamide shows
a tendency to point the HCO group out of the liquid wherea
s the NH2 group is closer to the liquid. In a simulation of pure formamide31 the same behaviour could be seen. This tendency
is found both for the outer salt free surface and for the so-called
inner surface enriched with salt. The effect is more pronounced
in the FA–TBAI/vacuum interface. Both distributions
also differ for molecules lying more or less parallel in the
surface plane (cosine≈0). Their amount in the FA–TBAI/vacuum
interface is lower compared with the FA/vacuum interface.
 |
| | Fig. 6 Orientation
of the C–N bond of formamide with respect to the surface normal (z-axis). Values for the interfaces are normalized to each other. | |
3.2 System 2: formamide+tetrabutylammonium iodide+hexane
The free liquid slab without confinements exhibits a depth
profile as shown in Fig. 7. The interfacial region with co-existence
of FA and HX extends over ∽14 Å. The TBAI and central
cation atom distribution are located at the same position,
whereas the anion behaviour shows drastic changes compared
with the other systems investigated: I− is traced over distances
of more than 20 Å and shows a clear tendency to move
from the interface towards the bulk region of the polar solvent.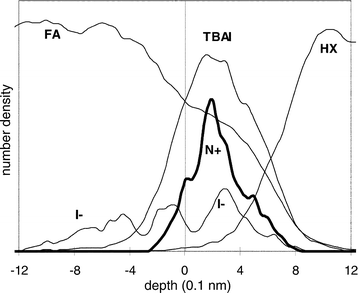 |
| | Fig. 7 Particle
number density for the FA–TBAI/hexane interface. | |
The presence of the anion has an influence on the molecular
orientation (Fig. 8). In both inner and outer surfaces the formamide
HCO group protrudes from the liquid. Again this
effect is stronger in the salt enriched interface. In contrast to
system 1, a preferential orientation can also be found for bulk
formamide.
 |
| | Fig. 8 Orientation of the C–N bond of formamide with respect to the surface normal (z-axis). Values for the interfaces are normalized to each other. | |
The relaxed situation in the free liquid slab is reflected by
the length distribution of the hexane as shown in Fig. 9. The
favoured configuration is elongated hexane molecules. Only
the interface with FA contains a larger amount of coiled
hexane. The number of trans configurations within one hexane
molecule shown in Fig. 10 also indicates the highest percentage
of stretched HX in the surface exposed to vacuum.
 |
| | Fig. 9 Length
distribution of hexane. | |
 |
| | Fig. 10 Number of trans configurations in the hexane molecules. | |
4 Discussion
This study was aimed at elucidating the behaviour of tetrabutylammonium
ions and the respective anion located at the
interface of a polar (formamide) and a non-polar (hexane) liquid.
For system 1 with FA+TBAI, one finding is that the molecular
mobility of the formamide in the free surface region is
between 25 and 83% higher than in the bulk phase for the three
Cartesian coordinates. Within the salt enriched surface FA
moves with only 64–82% of the value for the salt free region.
For the salt it can be stated that the mean square displacement
is roughly 20% of the formamide value. The comparatively
large TBAI molecule is slow compared to the solvent.
This might be due to the H-bonded network which is known to
exist for this solvent.The
situation is changed by the presence of the alkane in
the second system investigated: the mean square displacement
of formamide is enhanced by a factor between 1.8 and 2.9.
This is interpreted as being due to a disturbance of the H-bonded formamide network by the alkane.
The
depth profiles demonstrate several facets. The overlap
of organic and inorganic phases that can be interpreted as the
interface thickness amounts to about 10–14 Å. A molecular dynamic
study of ion transfer over a water/1,2-dichloroethane interface
reported by Benjamin32 provides values of ∽10 Å. The second
feature is a different centre of the cationic and anionic
distribution. This finding is in line with models treating platinum
catalysts in terms of electric double layers.
Neither
ionic species protrudes into the non-polar phase. This
is in accordance with Benjamin's result32 that the ion transport
across the interface of two immiscible liquids is an activated
rather than a simple diffusive process. The present simulation
cannot clarify whether diffusion never occurs owing
to the limited time and volume taken into account in the
calculations. However, the probability is clearly low compared
with ion movement within the non-polar medium.
In
a molecular dynamics study of tetramethylammonium
chloride in aqueous solutions,33 the authors found only minor
influences of salt molecules on the structure of the solvent. In
the present work it is shown that the preferential orientation
of formamide is slightly pronounced by TBAI molecules
which strengthen the ordering of the formamide surface. In
the FA–TBAI/HX interface one finds a higher percentage of co
iled hexane molecules than in the bulk phase, their amount being even lower in the XH/vacuum interface.
References
- M. Makosza and B. Serafinowa, Rocz.
Chem., 1965, 39, 1223 Search PubMed.
- C. M. Starks, J. Am. Chem. Soc., 1971, 93, 195 CrossRef CAS.
- A. Brändström, Preparative Ion Pair Extraction, an Introduction
to Theory and Practice, Apotekorsocieteten, Hässle Läkemedel, Stockholm,
1974. Search PubMed.
- E. V. Dehmlow and S. S. Dehmlow, Phase Transfer
Catalysis, Verlag
Chemie, Weinheim, 3rd edn., 1993. Search PubMed.
- H. S. Frank, J. Phys. Chem., 1963, 67, 1554 CAS.
- S. Lindenbaum and G. E. Boyd, J. Phys.
Chem., 1964, 68(4), 911.
- R. M. Diamond, J. Phys. Chem., 1963, 67(4), 2513.
- K. Tamaki, Bull. Chem. Soc. Jpn., 1974, 47, 2764 CAS.
- S. Koda, J. Goto, T. Chikusa and H. Nomura, J. Phys. Chem., 1989, 93, 4959 CrossRef CAS.
- M. Krell, M. C.
R. Symons and J. Barthel, J. Chem. Soc., Faraday Trans. 1, 1987, 83, 3419 RSC.
- H. Helmholtz, Wied. Ann. Phys., 1879, 7, 337 Search PubMed.
- G. Gouy, J. Phys., 1910, 9, 457 Search PubMed.
- G. Gouy, Ann.
Phys., 1917, 7, 129 CAS.
- D. L. Chapman, Philos. Mag., 1913, 25, 475 Search PubMed.
- O. Stern, Z. Electrochem., 1924, 30, 508 Search PubMed.
- C. M. Starks and R.
M. Owens, J. Am. Chem. Soc., 1973, 95, 3613 CrossRef CAS.
- A. Brändström, Adv.
Phys. Org. Chem., 1977, 15, 267 Search PubMed.
- D. Landini, A. Maia and F. Montanari, J. Chem. Soc., Chem.
Commun., 1977, 112 RSC.
- H. Siegbahn and K. Siegbahn, J.
Electron Spectrosc. Relat. Phenom., 1973, 2, 319 CrossRef CAS.
- R.
E. Ballard, J. Jones and E. Sutherland, Chem. Phys. Lett., 1984, 112(4), 310 CrossRef.
- S. Holmberg, R. Moberg, Z. Cai Yuan and H. Siegbahn, J. Electron Spectrosc.
Relat. Phenom., 1986, 41, 337 CrossRef CAS.
- S. Holmberg, Z. Cai Yuan, R. Moberg and H. Siegbahn, J. Electron Spectrosc.
Relat. Phenom., 1988, 47, 27 CrossRef CAS.
- R. Moberg, F. Bökman, O. Bohman and H. O. G. Siegbahn, J. Am. Chem. Soc., 1991, 113, 3663 CrossRef CAS.
- F. Bökman, O. Bohman and H. O. G. Siegbahn, J. Phys. Chem., 1992, 96, 2278 CrossRef.
- F. Bökman, O. Bohman and H. O.
G. Siegbahn, Acta Chem. Scand., 1992, 46, 403 Search PubMed.
- W. Keller, H. Morgner and W. A. Müller, Mol. Phys., 1986, 57, 623 CAS.
- H. Morgner, J. Oberbrodhage, K. Richter and K. Roth, J. Phys.: Condens. Matter, 1991, 3, 5639 Search PubMed.
- H. Morgner and J. Oberbrodhage, J. Phys.: Condens. Matter, 1995, 7, 7427 Search PubMed.
- J. Oberbrodhage, J. Electron Spectrosc. Relat. Phenom., 1998, 95, 171 CrossRef CAS.
- W.
F. van Gunsteren and H. J. Berendson, GROMOS Library Manual, Biomos, Groningen, 1987. Search PubMed.
- J. Oberbrodhage, H. Morgner, O. Tapia and H. Siegbahn, Int. J. Quantum Chem., 1997, 63, 1123 CrossRef CAS.
- I. Benjamin, Science, 1993, 261, 1558 CAS.
- E. Hawlicka and T. Dlugoborski, Chem. Phys. Lett., 1997, 268, 325 CrossRef CAS.
|
| This journal is © the Owner Societies 2000 |
Click here to see how this site uses Cookies. View our privacy policy here.