Overpotential-induced lability of the electronic overlap factor in long-range electrochemical electron transfer: charge and distance dependence
Alexei A. Kornyshevab, Alexander M. Kuznetsovb, Jens U. Nielsenc and J. Ulstrupc
aInstitut für Werkstoffe und Verfahren in der Energietechnik, Forschungszentrum Jülich, D-52425, Jülich, Germany
bThe A.N. Frumkin Institute of Electrochemistry of the Russian Academy of Sciences, Leninskij prospect 31, Moscow, 117071, Russia
cDepartment of Chemistry, Technical University of Denmark, DK-2800, Lyngby, Denmark
First published on UnassignedUnassigned22nd December 1999
Abstract
Long-distance electrochemical electron transfer exhibits approximately exponential dependence on the electron transfer distance. On the basis of a jellium model of the metal surface we show that the slope of the logarithm of the current vs. the transfer distance also depends strongly on the electrode charge. The slope is smaller the more negative the charge density due to enhanced extension of the surface electronic density profile on the solution side, and thereby better electronic overlap with the reacting molecule. The effect is sensitive to the bulk electron density of the metal and the localization of the electronic state at the molecular reactant site. Effects similar to these have been observed experimentally and could be common for electronically light metals.
1. Introduction
The electronic tunnel factor in homogeneous long-range electron transfer (ET) processes has been in strong focus over the last decade.1–7 Attention to the tunnel factor in interfacial electrochemical ET and in situ scanning tunnel microscopy (STM) has been less intense primarily due to the exclusive electronic and molecular structure of the electrode/electrolyte interface. Well characterized long-range electrochemical ET systems have, however, been reported recently. Systems based on self-assembled monolayers of functionalized aliphatic thiols8–14 are central, where the length and chemical nature can be varied, to give currents spanning many orders of magnitude. This has also warranted new theoretical efforts in the area of long-range electrochemical ET.Following an early suggestion15 we have investigated the variation of the electrochemical tunnel factor at jellium-like metals with the excess electrode charge density.16 The electronic jellium cloud at a given distance was found to follow the charge of the electrode, increasing on the solution side when charging is negative relative to the potential of zero charge (pzc), and contracting into the metal on positive charging. This lability is reflected in the electron exchange factor, facilitating tunnelling on the negative side of the pzc and impeding tunnelling on the positive side. The effects were found to be insignificant for contact ET distance but significant compared to the potential or charge dependence of the nuclear activation factor for longer-range ET and lower-electron density metals such as silver. The effect is small for electronically high-density metals such as gold and mercury.
The overpotential-induced electron tunnel lability effect has recently been addressed experimentally.17,18 The electrochemical reduction of Zn2+ at In- and Tl-amalgam electrodes,17 where the excess surface charge density can be controlled by the amalgam composition, is composed of two steps, i.e. Zn2+ is first reduced to Zn+ on the solution side, followed by reductive amalgamation of Zn+. The electro chemical rate constant of the first step displays excess surface charge dependence following qualitatively the views in ref. 16. This system is not, however, a case for long-range ET and the observed effect is likely to have a different origin. The [Cr(EDTA)]−→[Cr(EDTA)]2− reduction at Hg-, Bi- and Cd-electrodes has also been reported to depend exponentially on the excess negative electrode surface charge, after correction for double layer effects.18 This system is closer to the notion of long-range electrochemical ET as the metal centre is here spatially separated from the electrode by the voluminous ligand group.
In the light of such new perspectives for observation of quantum mechanical electrochemical charge lability, we provide some new theoretical results, addressing particularly the distance variation of the electrochemical current at jellium-like metals at different surface charge densities. We also rectify a few formal inconsistencies in the previous report.16
2. Jellium charge lability and electrochemical currents
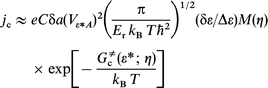
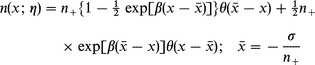
The cathodic diabatic current density at the overvoltage η is4–7,16,19,20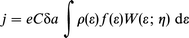 | (1) |
where C is the concentration of the discharging (oxidized) molecule, e the electronic charge, δa a narrow distance range perpendicular to the surface, and ρ(ε) the metallic electronic level density at the energy ε, f (ε)=[1+exp(ε−εF)/kBT]−1 is the Fermi function, εF the Fermi energy, kB Boltzmann's constant and T the temperature. W(ε; η) is the quantum mechanical transition probability per unit time for ET from a given level ε to the molecule. In terms of the widely used representation where nuclear reorganization involves displacement in a set of harmonic molecular and linear solvent modes W(ε; η) takes the form4–7,16,20
 | (2) |
where Er is the nuclear reorganization Gibbs free energy, TεA(ε; η) the electron exchange factor coupling the level ε to the molecular acceptor level ‘‘A ’’, and 2πħ Planck’s constant.
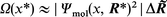
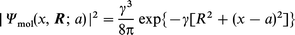
TεA(ε; η) incorporates the electronic wavefunctions of the metallic, ψε(x, R; ε; η), and molecular levels Ψmol(x, R)
 | (3) |
where x is the space coordinate perpendicular to the electrode and R the lateral coordinate, VεA is the physical perturbation which induces the transition.
Following ref. 16 the overlap integral can be recast in terms of the electronic densities
 | (4) |
where Ω(x*) is the density (length−1) of the molecular electronic structure
 | (5) |
x* in eqn. (4) is the value of x where the integrand is maximum and Δx (approximately coinciding with δa in eqn. (1)) the effective width of the x-integration. The definitions of R* and ΔR
are analogous regarding the lateral coordinate while Δ![[R with combining tilde]](https://www.rsc.org/images/entities/b_i_char_0052_0303.gif) is the extension of the molecular electronic distribution. Altogether the electronic factor [TεA(ε; η)]2 is
is the extension of the molecular electronic distribution. Altogether the electronic factor [TεA(ε; η)]2 is
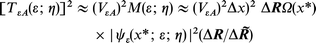 | (6) |
A measure of the metallic electronic density at the energy ε (energy−1 length−3) is
 | (7) |
The total density (length−3), to be represented by a density functional such as jellium, is
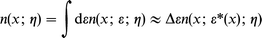 | (8) |
where ε* is the maximum of n(x; ε; η) and a principal ε*-dependence on x is indicated. Δε is the width of n(x; ε; η) around the maximum.
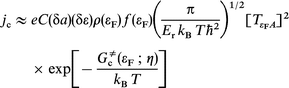
The current is then
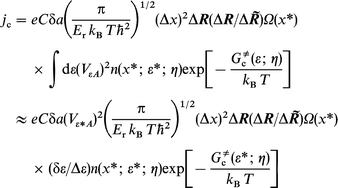 | (9) |
where δε is the effective interval in the ε-integration. In general, ε*≠εF and δε≠Δε. Conversion back to integral form gives
 | (10) |
The density overlap function M(η) (dimensionless) now takes the form
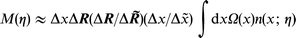 | (11) |
where Δ![[x with combining tilde]](https://www.rsc.org/images/entities/b_i_char_0078_0303.gif) is the effective extension of the x-integration in eqns. (10) and (11). In terms of the original electron exchange integral the current is
is the effective extension of the x-integration in eqns. (10) and (11). In terms of the original electron exchange integral the current is
 | (12) |
Eqns. (9), (10) and (12) represent the general current–voltage form and eqn. (11) the electronic density overlap. These forms rectify eqns. (12)–(16) in ref. 16.
M(η) can be given a simple form by using specific electronic density representations. The following exponential form is suitable for the molecular part
 | (13) |
corresponding to
 | (14) |
where a is the centre of localization of the reacting molecule and γ the orbital decay factor. The metallic density is suitably represented by jellium density functionals of which the simplest is16,21
 | (15) |
where n+ is the bulk density and σ the electrode charge
density.†θ(x) is the step function, i.e. θ(x)=1 for x>1 and 0 for x<1. In the following we use atomic units (e=me=ħ=1, me being the electron mass). Both the jellium front, ![[x with combining macron]](https://www.rsc.org/images/entities/i_char_0078_0304.gif) , and the widthβ−1 depend, moreover on the electrode charge or overpotential, by expansions such as22
, and the widthβ−1 depend, moreover on the electrode charge or overpotential, by expansions such as22
| β=β0+aσ+bσ2+dσ3 | (16) |
which give a much stronger jellium lability than the constant term β0 alone. Analytical expressions for β0 and the expansion coefficients a, b and d for metal/vacuum are available22 but the procedure can be brought to incorporate dielectric screening, pseudopotentials, etc.23,24
Eqns. (14) and (15) give, finally for M(η)
 | (17) |
This form replaces eqn. (20) in the previous report.16
3. Charge and distance dependence of the electrochemical electronic density overlap
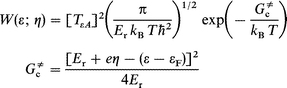
Overvoltage variation affects the activation Gibbs free energy in eqns. (2), (9) and (12). The tunnel factor is also affected, via the jellium response to the surface charge density variation. The latter effect is summarized in Fig. 1. Ag and Hg are chosen as representatives of two common electrode materials of intermediate (8.73×10⁻³ au) and high (12.8×10⁻³ au) electron density, respectively, while the density corresponding to Cs (1.33×10⁻³ au) is the lowest jellium density available. Jellium lability is insignificant for Hg, i.e. less than an order of magnitude over 10 µC cm−2 variation of σ. The variation corresponds to ≈0.3 V for an inner layer capacitance of 30 µF cm−2. The effect is significant for Ag even at the fairly small ET distance of 10 Å, increasing by up to two orders of magnitude over the same σ-range, and still more for the low-density metal. These effects approach the activation Gibbs free energy variation which would be three or four orders of magnitude over a 0.3 V overvoltage range.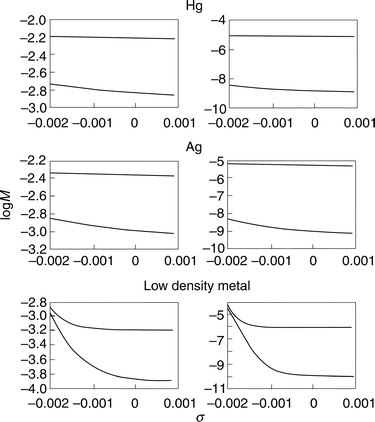 | ||
| Fig. 1 Dependence of the electron density overlap M(η)/ΔxΔR (ΔR=ΔR and Δx=Δx in all the figures) on the electrode surface charge density σ (1 au=5.695×10³ µC cm−2), calculated from eqn. (17) for three metals (the low density corresponds to caesium). The lability coefficients are taken from ref. 22. Left column: ‘‘ short-range’’: a=4.5 a0 (≈2.2 Å). Right column: ‘‘long-range: a=20 a0 (≈10 Å). Upper lines: electronic localization at the metal (γ=0.5 au). Lower lines: electronic localization at the molecule (γ=1.0 au). | ||
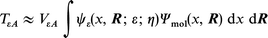
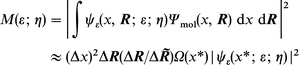
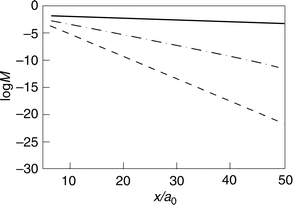
The investigation of ref. 16 did not extend to charge lability effects on the distance variation of the density overlap. The distance dependence is approximately exponential but depends sensitively on the electrode charge or overvoltage. The distance dependence at different electrode charge densities is displayed in Figs. 2 and 3. Coulomb field and image charges25–29 of the molecule surface interaction also depend on the distance but these effects are much smaller. The distance range 5–50 a0 (2–20 Å) and a density corresponding to Ag are used, with different combinations of the decay factors β and γ. The lability coefficients are taken from ref. 22. Some observations follow from the figures.
 | ||
| Fig. 2 The dependence of the electron density overlap M(η)/ΔxΔR (eqn. (17)) on the ET distance for uncharged silver for different degrees of localization of the wavefunction on the site of the discharging molecule. (———): γ=0.1 au; (– ·–·–): γ=0.5 au (– – – –): γ=1 au. | ||
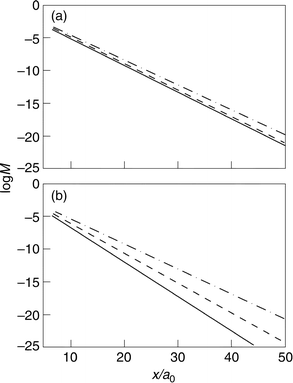 | ||
| Fig. 3 The effect of excess electrode surface charge density on the distance relation for different localization degrees at the discharging molecule. The charge density corresponds to silver. (———): σ=0. (– – – –): σ=−1×10⁻³ au. (–·– ·–): σ=−2×10⁻³ au. (a) γ=1 au. (b) γ=2 au. | ||
(A) The distance relations are close to exponential, cf. eqn. (17).
(B) The decay factor, however, depends on both the molecular and jellium decay factors, where the smaller decay factor dominates. The smaller factor is mostly associated with the discharging molecule (Fig. 2). The effect of the metal is therefore most significant when negative electrode charging has brought the jellium decay length close to the molecular decay length.
(C) Following the observation in (B), the tunnel distance decay depends strongly on the electrode charge. This effect is larger, the more localized the charge distribution on the reactant (Fig. 3).
(D) The charge effect is notably nonlinear: charge variation from −0.001 to −0.002 au leads to a larger change of the slope of the log jevs. distance dependence than from 0 to −0.001 au. The effect is also notably asymmetric around zero electrode charge (Fig. 4). Negative electrode charging and spatial electron density expansion lower the decay factor significantly for (electronically) lighter metals but positive charging and electron density contraction give a weaker effect.
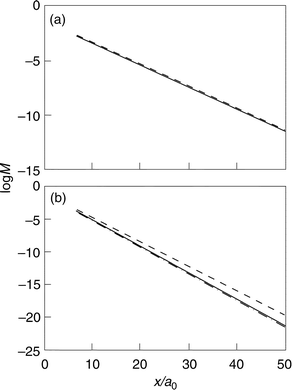 | ||
| Fig. 4 The electron density overlap M(η)/ΔxΔR (eqn. (17)) as a function of the ET distance for different electrode charges. (– – – –): σ=−2×10⁻³ au. (———): σ=0. (– ·–·–): σ=2×10⁻³ au. The charge density corresponds to silver. The wavefunction localization on the reactant site: (a) γ=0.5 au. (b) γ=1 au. | ||
(E) The calculations in Figs. 1–4 rest on eqn. (17) and x-integration of the density overlap in eqn. (11) from −∞ to +∞. These limits overestimate the charge lability effects for weakly decaying molecular wavefunctions due to unphysical molecular wavefunction penetration into the metal.
4. Concluding remarks
The results above are of interest in the context of recent experimental data, particularly the strong (exponential) excess charge dependence of [Cr(EDTA)]− reduction at Cd, Bi, and Hg.18 They hold, however, a broader perspective in the context of electron tunnelling across organized self-assembled films of alkane thiols and related compounds.8–14 Electronic lability effects in these systems so far seem to be small. This could be associated with the high electron density of the gold substrates used, or the low capacitance of the films, leading to a need for large overvoltage ranges to induce sufficient excess surface charge variation. Lower-density metals such as silver, and distance variation at different charges or overpotentials might disclose these effects.The results, however, need consolidation. The calculations so far rest on jellium at metal/vacuum interfaces. Inclusion of the solvent imposes both attractive and repulsive forces on the jellium density. The former are represented by solvent polarization or positively charged ions, the latter, for example, by pseudopotential forces or negatively charged ions. More composite jellium functionals including Friedel oscillations, dielectric screening, pseudopotential interactions, etc., can, however, be treated by the same procedure.24,29–31 Such calculations are voluminous but frame the different physical effects transparently. Electronic polarization, for example, enhances jellium expansion whereas retraction is induced by pseudopotential forces. The vacuum jellium representation is therefore a good starting point. Major steps forward should be associated with conversion of the density functionals to wavefunctions, either by Kohn–Sham schemes for jellium32 or by full band structure calculations for low-density metals and semi-metals.
Acknowledgements
We wish to thank Professor J. M. Sluyters-Rehbach, Utrecht University, for discussions and helpful comments. Financial support from Volkswagenstiftung, The Danish Technical Science Council, The EU programme INTAS, and Novo Nordisk Fond is acknowledged.References
- Metal Ions in Biological Systems, ed. H. Sigel and A. Sigel, Marcel Dekker, New York, 1991, vol. 27. Search PubMed.
- T. J. Meyer, M. D. Newton, Chem. Phys., 1993, 176, 289. Special Issue on Electron Transfer. Search PubMed.
- M. A. Fox, Chem. Rev., 1992, 92, 365. Special Issue on Electron Transfer. Search PubMed.
- A. M. Kuznetsov, Charge Transfer in Physics, Chemistry, and Biology, Gordon and Breach, Reading, 1995. Search PubMed.
- A. M. Kuznetsov and J. Ulstrup, Electron Transfer in Chemistry and Biology. An Introduction to the Theory, Wiley, Chichester, 1999. Search PubMed.
- G. Iversen, Yu. I. Kharkats, A. M. Kuznetsov and J. Ulstrup, Adv. Chem. Phys., 1999, 106, 543 Search PubMed.
- A. M. Kuznetsov and J. Ulstrup, Electrochim. Acta, in the press. Search PubMed.
- C. E. D. Chidsey, Science, 1991, 251, 919 CrossRef CAS.
- H. O. Finklea and D. D. Hanshew, J. Am. Chem. Soc., 1992, 114, 3173 CrossRef CAS.
- A. M. Becka and C. J. Miller, J. Phys. Chem., 1992, 96, 2657 CrossRef CAS.
- (a) S. Song, R. A. Clark, E. F. Bowden, M. J. Tarlov, J. Phys. Chem., 1993, 97, 6564; Search PubMed; (b) E. F. Bowden, in Proceedings of the ESF Workshop on Bioelectrochemistry, ed. M. F. Nielsen and J. Ulstrup, Technical University of Denmark and University of Copenhagen, Copenhagen, 1996. Search PubMed.
- J. F. Smalley, S. W. Feldberg, C. E. D. Chidsey, M. R. Lindford, M. D. Newton and Y.-P. Liu, J. Phys. Chem., 1995, 99, 13141 CrossRef CAS.
- H. A. Finklea, in Electroanalytical Chemistry, ed. A. J. Bard and I. Rubinstein, Marcel Dekker, New York, 1996, vol. 19, p. 109. Search PubMed.
- K. Weber, L. Hockett and S. E. Creager, J. Phys. Chem. B, 1997, 101, 8286 CrossRef CAS.
- A. M. Kuznetsov and J. Ulstrup, in Proceedings of the International Conference on Structure and Dynamics of Solid Electrolyte Interfaces, ed. H. Gerischer and D. M. Kolb, Fritz-Haber-Institut der Max-Planck-Gesellschaft, Berlin, 1986, Abstr. No. D3. Search PubMed.
- A. A. Kornyshev, A. M. Kuznetsov and J. Ulstrup, J. Phys. Chem., 1994, 98, 3832 CrossRef CAS; A. A. Kornyshev, A. M. Kuznetsov and J. Ulstrup, J. Phys. Chem., 1994, 98, 6664 CrossRef CAS.
- L. Koene, M. Sluyters-Rehbach and J. H. Sluyters, J. Electroanal. Chem., 1996, 402, 57 CrossRef CAS.
- M. L. Khrushcheva, G. A. Tsirlina and O. A. Petrij, Russ. J. Electrochem., 1998, 34, 325 Search PubMed.
- R. R. Dogonadze and Yu. A. Chidzmadzhev, Dokl. Akad. Nauk SSSR, Ser. Fiz. Khim., 1963, 153, 333 Search PubMed; R. R. Dogonadze, A. M. Kuznetsov and Yu. A. Chidzmadzhev, Zh. Fiz. Khim., 1964, 68, 1135 Search PubMed.
- R. R. Dogonadze, in Reactions of Molecules at Electrodes, ed. N.S. Hush, Wiley, New York, 1971, p. 135. Search PubMed.
- J. R. Smith, Phys. Rev., 1969, 181, 522 Search PubMed.
- P. G. Dzhavakhidze, A. A. Kornyshev and G. J. Tsitsuashvili, Solid State Commun., 1984, 52, 401 CrossRef CAS.
- P. G. Dzhavakhidze, A. A. Kornyshev, A. Liebsch and M. A. Urbakh, Phys. Rev. B, 1992, 45, 9339 CrossRef.
- J.. Ulstrup, unpublished results..
- A. A. Kornyshev, A. I. Rubinstein and M. A. Vorotyntsev, Phys. Status Solidi B, 1977, 84, 125 CAS.
- A. A. Kornyshev and M. A. Vorotyntsev, J. Phys. C: Solid State Phys., 1978, 11, L691 Search PubMed.
- M. A. Vorotyntsev, in The Chemical Physics of Solvation. Part C. Solvation in Specific Physical, Chemical and Biological Systems, ed. R. R. Dogonadze, E. Kálmán, A. A. Kornsyhev and J. Ulstrup, Elsevier, Amsterdam, 1988, p. 401. Search PubMed.
- Yu. I. Kharkats, H. Nielsen and J. Ulstrup, J. Electroanal. Chem., 1984, 169, 47 CrossRef CAS.
- A. A. Kornyshev, in The Chemical Physics of Solvation. Part C. Solvation in Specific Physical, Chemical and Biological Systems, ed. R. R. Dogonadze, E. Kálmán, A. A. Kornyshev and J. Ulstrup, Elsevier, Amsterdam, 1988, p. 355. Search PubMed.
- A. A. Kornyshev, A. M. Kuznetsov, G. Makov and M. V. Vigdorovich., J. Chem. Soc., Faraday Trans., 1996, 92, 3997 RSC; A. A. Kornyshev, A. M. Kuznetsov, G. Makov and M. V. Vigdorovich, J. Chem. Soc., Faraday Trans., 1996, 92, 4005 RSC.
- W. Schmickler and D. Henderson, Prog. Surf. Sci., 1986, 22, 323 CrossRef CAS.
- W. Kohn and L. J. Sham, Phys. Rev., 1965, 140, A1133 Search PubMed; L. J. Sham and W. Kohn, Phys. Rev., 1966, 145, 561 Search PubMed.
Footnote |
| † 1 au=5.695×10³ µC cm−2. |
| This journal is © the Owner Societies 2000 |