Kinetics of phase transformations between lyotropic lipid mesophases of different topology: a time-resolved synchrotron X-ray diffraction study using the pressure-jump relaxation technique
J. Erbesa, A. Gabkea, G. Rappb and R. Wintera
aUniversity of Dortmund, Department of Chemistry, Physical Chemistry I, Otto-Hahn-Strasse 6, D-44227, Dortmund, Germany
bEuropean Molecular Biology Laboratory, Hamburg Outstation at DESY, Notkestr. 85, D-22603, Hamburg, Germany
First published on UnassignedUnassigned22nd December 1999
Abstract
By using the pressure-jump relaxation technique in combination with time-resolved synchrotron X-ray diffraction, the kinetics of different lipid phase transformations under conditions close to and far from equilibrium were investigated. The inter-lamellar gel–fluid [Lβ′(Pβ′)–Lα] main transition of different phosphatidylcholine systems, the lamellar to hexagonal Lα–HII transition of dioleoylphosphatidylethanolamine and egg phosphatidylethanolamine and the lamellar to hexagonal–cubic phase transformation of fatty acid–phospholipid mixtures were studied. The time constants for completion of the transitions vary from seconds to many minutes, depending on the direction of the transition, the symmetry of the lipid structures involved, the temperature and the pressure-jump amplitude. The technique also proved to be a powerful tool to study mesophase transitions of lipids showing structural intermediates under non-equilibrium conditions, which are not seen in transitions close to equilibrium, i.e., under slow scan conditions. In most cases the rate of the transition is probably limited by the transport and redistribution of water into and in the new phase, rather than being controlled by the time required for a rearrangement of the lipid molecules. In addition, nucleation phenomena and domain size growth of the structures evolving might play a significant role. The results are compared with data obtained from other relaxation techniques.
1 Introduction
Amphiphilic lipid molecules, which provide valuable model systems for lyotropic mesophases and biomembranes, display a variety of polymorphic phases, depending on their molecular structure and on environmental conditions, such as the water content, pH, ionic strength, temperature and pressure.1–6 The basic structural element of biological membranes consists of a lamellar phospholipid bilayer matrix. Saturated phosphatidylcholines often exhibit two thermotropic lamellar phase transitions, a gel–gel (Lβ′–Pβ′) pretransition and a gel–liquid-crystalline (Lα) main transition at a higher temperature Tm. In the fluid-like Lα phase, the acyl chains of the lipid bilayers are conformationally disordered, whereas in the gel phases, the chains are more extended and ordered. The phospholipid chain melting at Tm is a first-order phase transition, albeit one that is already approaching second order.7 In excess water, phospholipids self-assemble into multilamellar vesicles (MLVs) consisting of concentric, stacked bilayers each separated by a layer of water. The repetition of the structure lends itself well to diffraction studies. In addition to the thermotropic phase transitions, pressure-induced phase transformations have also been studied.8–21It is now well known that many isolated biological lipid molecules also form non-lamellar liquid-crystalline phases.1–6,22–28 It is generally assumed that the non-lamellar lipid structures, such as the inverted hexagonal (HII) and cubic lipid phases, are of significant biological relevance. They probably play an important functional role in some cell processes,25–28 such as endo- and exocytosis, membrane recycling, protein trafficing, fat digestion, membrane budding and fusion. However, a detailed understanding of the molecular mechanisms and the dynamic processes which govern these transitions is still lacking,29 and this is also one reason for the rather speculative roles attributed to lipid mesomorphism in biological membrane systems.
The inverted hexagonal (HII) phase is periodic in two dimensions and consists of hexagonally packed water cylinders of indefinite length with an outer lining of lipid molecules oriented with their acyl chains facing radially away from the cylinder axis and with the head groups buried in the inner aqueous channel. The lipid cubic phases can be sorted into two main classes: bicontinuous and micellar.1,2,22,23,30–37 The bicontinuous cubic phases of type II (QII) can be visualized in terms of a highly convoluted lipid bilayer, which subdivides three-dimensional space into two disjointed polar labyrinths separated by an apolar septum. The structures of three of these phases, Q230, Q224 and Q229, are closely-related to the Schoen Gyroid (G), the Schwarz D and the Schwarz P infinite periodic miminal surfaces (IPMS), respectively. An IMPS is an intersection-free surface periodic in three dimensions with a mean curvature that is everywhere zero. The surface, that sits at the lipid bilayer midplane, separates two interpenetrating but not connected water networks. A prerequisite for the formation of the HII or inverse cubic phases is that the opposing monolayers wish to bend towards the water region. This desire arises because of differential lateral pressures which are present through the monolayer films. It increases, for instance, if the lateral chain pressure increases owing to an increase in trans–gauche isomerisations of the acyl chains at high temperatures or if the level of head group hydration decreases (e.g., owing to Ca2+ adsorption at the polar/apolar interface). In the fluid-like state there lies the source for the extraordinary polymorphism of lipid systems. The fluid state is a state permitting topology changes through the variation of the number of the first neighbours of a molecule and, when two amphiphiles of different character are present, it permits their relative concentrations to fluctuate, extending the polymorphism by the possibility of inhomogeneous interfacial curvatures.
Most of the experimental work so far has relied on temperature and sample composition as the tools to attack physico-chemical properties of lyotropic lipid mesophases. A further important thermodynamic and kinetic variable is pressure. In addition to the general physico-chemical interest in using high pressure as a tool for understanding phase behaviour, structure and energetics of amphiphilic molecules,6 pressure changes can also be used as a kinetic probe to study their phase transformations. Furthermore, high pressure is also of considerable physiological and biotechnological interest (e.g., deep sea diving, high pressure food processing).38,39 Although the static structure and phase behaviour of many lipid systems are now well established, a considerable lack of knowledge exists regarding the understanding of the kinetics and mechanisms of lipid phase transformations. We have used the synchrotron X-ray diffraction technique to record the temporal evolution of the structural changes after induction of the phase transition by a pressure jump across the phase boundary.40–44 So far, mainly temperature-jump relaxation studies have been performed to study biomolecular phase transformation.45–58 By changing the pressure-jump amplitude, transitions close to and far from equilibrium, where deviations from linearity of response functions are expected and new structures and processes might be observed, can be studied. In this paper we discuss several kinds of phase transformations between lyotropic lipid mesophases for both one- and two-component lipid systems in excess water.
2 Materials and methods
2.1 Materials and sample preparation
The phospholipids DMPC, DPPC and DSPC (see Abbreviations at the end of the paper) were obtained from Sygena Lipids (Liestal, Switzerland), monoolein (MO), myristic acid (MA) and palmitic acid (PA) from Sigma Chemical (Deisenhofen, Germany) and DEPC, egg-PE and DOPE from Avanti Polar Lipids (Alabaster, AL, USA). The lipids were used without further treatment. Lipid mixtures were prepared by first dissolving the required amounts of lipids in chloroform. The solvent was then completely removed under vacuum using a Speed Vac Sc 110 (Savent, Farmingdale, NY, USA) before adding doubly distilled water to give dispersions. The dispersions were homogenized by applying five freeze–thaw–vortex cycles.2.2 X-ray diffraction
Small- and wide-angle X-ray diffraction experiments were performed at beam line X13 of the EMBL outstation at DESY. One-dimensional diffraction patterns in the small- and wide-angle regime were recorded simultaneously using two sealed linear detectors with delay line readout connected in series.59 Information on the short- and long-range order has thus been obtained simultaneously. From this information the lattice and chain-packing parameters in the various lyotropic lipid phases were determined. With the silicon monochromator used, the wavelength was fixed to 1.5 Å. Sets of tungsten slits were used to adjust the beam size at the sample (0.5 mm in height and 1.5 mm in width) and to reduce parasitic scattering. To avoid radiation damage, a small selenoid-driven lead shutter protected the samples from excess radiation within the periods where no data were recorded. Additional information, such as temperature, pressure, time and X-ray flux measured with an ionisation chamber in front of the sample, was stored in the local memory.The reciprocal spacings s=1/dhkl=(2/λ)sin θ (dhkl=lattice spacing, 2θ=scattering angle, λ=wavelength of radiation) were calibrated in the small-angle region by the diffraction pattern of rat-tail collagen (long spacing: 640 Å). The absolute calibration is accurate to within 1.7%. This means that in a measurement of a d-spacing of 60 Å, which is typical for the repeat distance of a lamellar lipid structure, we might expect d with an accuracy of about ±1 Å. The relative accuracy is better than 0.1 Å, however. Small-angle peak ratios of 1, 2, 3, ... indicate a lamellar phase (due to the one-dimensional stack of lipid bilayers); ratios of 1, √3, 2, √7, 3, ... are indicative of a hexagonal phase (two-dimensional lattice of densely packed micellar rods), ratios of √2, √3, 2, √6, √8, 3, ... for a QIID cubic phase, √2, 2, √6, √8, ... for a QIIP cubic phase and √6, √8, ... for a QIIG cubic structure. The wide-angle peaks relate to the translational order over short distances, here to the lateral in-plane packing of the acyl chains in the lipid mesophase. In the fluid-like state, the diffraction signal is broad and diffuse, and centred around 1/4.5 Å−1. Sharper wide-angle peaks are observed with lipids below the gel–fluid transition, around 1/4.0–1/4.2 Å−1, and the peak positions can be used to infer the crystallographic subcell dimensions and the mutual positions of the acyl chains, which is often difficult, however, owing to the lack of multiple Bragg reflections in these soft matter structures.
For the investigation of the structures of the lipid systems at elevated pressures and for the study of the kinetics of lipid phase transitions using the pressure-jump technique, we built high pressure X-ray cells suitable for studies up to pressures of 2 kbar (using Be windows) or of 8 kbar (using flat diamond windows) at temperatures ranging up to 140°C.39,41,60 The pressure vessels are made from stainless steel of high tensile strength, and they contain two high pressure connections perpendicular to each other and a bore for a thermocouple. Temperature control is achieved by circulating water from a thermostat through the outside jacket of the pressure vessel. The temperature is controlled to within 0.2°C. The sample of about 40 µL volume is held in a PTFE ring that is closed with Mylar foils glued on both sides of the ring to separate the sample from the pressurizing medium (doubly distilled water). The Be or diamond window holders are sealed with Viton O-rings and are kept by closure nuts.
In our relaxation kinetic measurements, we used the pressure-jump technique, which is sometimes advantageous over the temperature-jump approach: first, pressure propagates rapidly so that sample homogeneity is less of a problem; second, pressure jumps can be performed bidirectionally, i.e., in the pressurization and depressurization directions, and third, the amplitude of the pressure jump can be easily and repeatedly varied to a level of high accuracy (here ±5 bar), thus also allowing to average sets of diffraction data to improve the counting statistics in the case of fully reversible phase transitions, if needed. These advantages yield a potential to study the mechanisms of many biomolecular kinetic processes,39,41,60 among the most important of which are the mesomorphic lipid phase transitions. The pressure jumps are performed by a computer controlled opening of an air operated valve between the high pressure cell and a liquid reservoir container. With the pressure-jump apparatus used, rapid (<5 ms) and variable amplitude pressure jumps are possible. With sufficient primary beam intensity and the present detector technology, the time resolution of the instrument is on the millisecond time-scale. To minimize the effect of an adiabatic temperature change in the course of the pressure jump, the high pressure cell was constructed to hold only a very small volume of the pressurizing medium. No adiabatic temperature change was detected in these experiments within the accuracy of our temperature measurements (±0.2°C).
The diffraction intensities were normalized for the incoming intensity using an ionisation chamber. To obtain the d-spacing, intensity and full width at half-maximum of the Bragg peaks, we used a least squares fit routine based on a modified paracrystal model,61 the simplest model to account for disorder in multilamellar vesicles. Use of a more sophisticated scattering theory, such as the Caillé theory,62 is not necessary here, as only the first-order Bragg peaks are observed and thus no electron density profiles can be determined. The calculated area of Bragg reflections of the different phases was used to monitor the progress of the phase transitions.
3 Experimental results
3.1 Lamellar to lamellar phase transitions of one-component lipid systems
Lamellar lipid phases exhibit crystalline, gel and liquid-crystalline bilayer structures, denoted by the subscripts c, β and α, respectively, and are the most common phases observed in phospholipid systems. We consider gel–liquid-crystalline lamellar transitions of different kinds in the following section.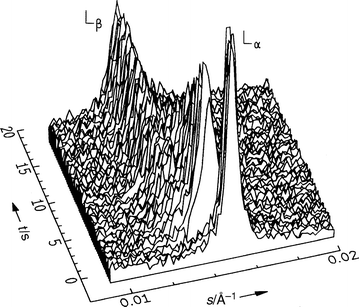 | ||
| Fig. 1 Diffraction patterns of DEPC–excess water after a p-jump from 200 to 370 bar at T=18°C (raw data; the p-jump, of less than 5 ms duration, occurs at t=0). | ||
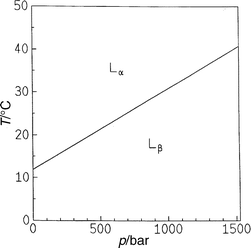 | ||
| Fig. 2 T,p phase diagram of DEPC in excess water. | ||
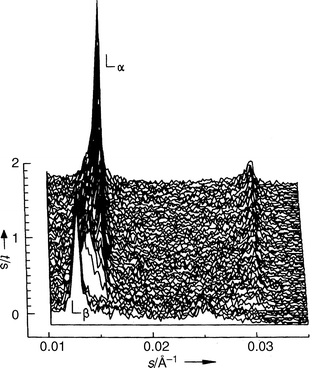 | ||
| Fig. 3 Diffraction patterns of DEPC–excess water after a p-jump from 250 to 70 bar at T=15°C. | ||
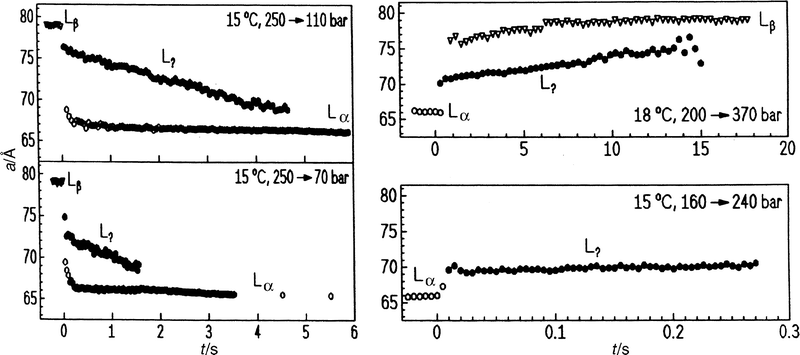 | ||
| Fig. 4 Lamellar lattice constants of DEPC–excess water after pressure jumps (a) into the Lα phase and (b) into the Lβ phase using different pressure-jump amplitudes. | ||
As a demonstration of the information that can be resolved by the experiment, we show in Fig. 5 a moderately slow temperature scan at 1°C min−1 for DPPC in excess water between 10 and 60°C. The first two or three orders of the one-dimensional lamellar lattices are clearly resolved. The small-angle pattern also shows the loss of long-range order between the pre- and the main transition, which is due to the absence of sharp reflections, in a similar way to that reported previously.66,67 The structure of the phase Pβ′(mst) was solved recently.69 The d-spacings in the Lβ′, Pβ′ and Lα phases are about 63, 73 and 64.5 Å, respectively. No Lc phase has been observed here.
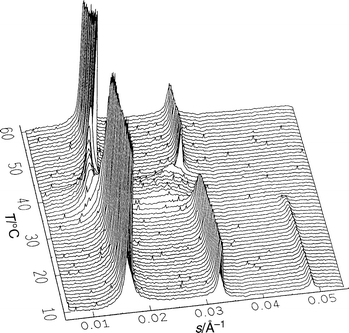 | ||
| Fig. 5 Series of small- and wide-angle diffraction patterns during a heating scan of fully hydrated DPPC from 10 to 60°C with a scan rate of 1°C min−1. | ||
Representative results of a p-jump experiment for studying the Pβ′–Lα main transition of fully hydrated DPPC are shown in Fig. 6. In the depressurizing direction (Pβ′→Lα), from 410 to 195 bar at T=45°C, the overall transition is relatively slow. Within 1 s after the p-jump, the new phase has appeared and no intermediate structure seems to occur. The two lattices co-exist only in the first second. The lattice constant a of the new phase relaxes slowly, and a constant a-value is reached after about 20 s. At that time, the intensity of the Lα phase has reached its plateau value (Fig. 6). The lattice constant is slightly larger than that of the corresponding phase at ambient pressure, which is due to a pressure-induced lengthening of the acyl chains.6,7 In the pressurizing direction (Lα→Pβ′), from 205 to 360 bar at T=45°C (Fig. 7), the transit time is faster; a (Pβ′) reaches its plateau value after about 3 s. Reducing the p-jump amplitude (205 to 255 bar) leads to an increase in the transit time by a factor of about seven.
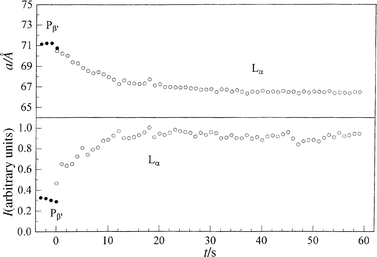 | ||
| Fig. 6 Lamellar lattice constants a and Bragg peak intensities I of fully hydrated DPPC after a p-jump from 410 to 195 bar at T=45°C. | ||
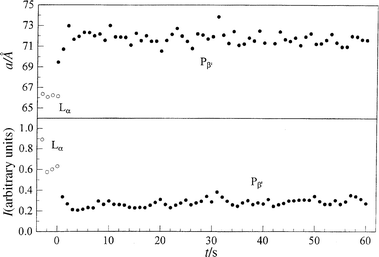 | ||
| Fig. 7 Lamellar lattice constants a and Bragg peak intensities I of fully hydrated DPPC after a p-jump from 205 to 360 bar at T=45°C. | ||
Kinetic data on the Pβ′–Lα transition have also been obtained in DMPC dispersions using a similar technique, with much longer p-jumps, however.40 In a slow (2.5 s) 113 bar p-jump study on the Lα to Pβ′ main transition of DMPC at 25°C (main transition temperature of DMPC: Tm=24°C) it was found that the transition takes place in two stages. The lamellar repeat spacing initially increases from a value of 66 Å in the Lα phase to a maximum value of 70.3 Å in the Pβ′ phase after 10 s and after a further 100–150 s decreases slightly to 68.5 Å. The reverse transition also takes place in two stages. Following a 5.5 s p-change from 113 to 1 bar, the repeat spacing steadily decreases from an initial value of 68.5 Å to 66.6 Å after 50 s, and then increasing by about 0.5 Å over a period of 100 s. In this investigation it has also been found that the transition appears to proceed by a two-state mechanism, in the sense that only the Pβ′ and Lα phases are observed during the transition.
As indicated in the Introduction, to date the most extensively used trigger in lipid phase transition kinetics has been a temperature jump. It is therefore worth briefly summarizing these results and comparing them with those obtained using pressure as a trigger. We should emphasize that on changing the temperature, the density and thermal energy are changed at the same time, whereas on changing pressure, only density (volume) changes occur. A temperature jump can be effected through the use of a temperature-regulated fluid stream, by resistance (Joule), microwave or by laser heating.
The transition from the metastable Pβ′ rippled to Lα phase of DPPC has also been studied by an approximately 5°C T-jump within 2 ms using erbium glass laser heating.55,56 To attain 5 ms time resolution, 100 T-jumps had to be averaged. Within 5 ms the transition is almost completed, indicating that the transition is only slightly slower than the time for heating. At that time resolution also no further intermediate structure could be detected. For comparison, the temperature-jump induced SAXS patterns of the Lβ′–Pβ′ pretransition of DPPC reveal at least three kinetic components. In an initial, fast step which occurs simultaneously on the millisecond time-scale, the time resolution of the experiment, the appearance of a peak at the high-s side of the first-order reflection of the initial Lβ′ phase (lattice constant 67 Å) indicates the formation of an intermediate lamellar lattice of narrower spacings (58 Å). For a variable length of time, depending upon the T-jump amplitude, these two lattices co-exist. The two lattices then merge in times of 10 ms–1 s to form a single, broader peak around 65 Å. In a third step, with half-lives between 0.5 and 3 s, this peak transforms into an asymmetric pattern which is similar to that seen under isothermal conditions in the Pβ′ phase. Further subsequent slower annealing processes are not ruled out. In the near equilibrium experiment (see Fig. 5), no such intermediate structure can be seen. It seems evident, therefore, that the pathway of the transition differs qualitatively between the near-equilibrium and an extreme non-equilibrium case. It appears that under non-equilibrium conditions the system is driven through an ordered dissipative structure by the large free-energy difference between the unstable state just after the T-jump and the final equilibrium state.
Corresponding time-resolved X-ray diffraction studies using microwave-induced sample heating for studying the pre- and main transitions of DPPC lead to the following findings.51 The transit times for the main transition at constant (15 W) microwave power were 3 s in the heating and 8 s in the cooling direction. The transit times recorded for the combined Lβ′–Pβ′ and Pβ′–Lα transition varies from 38 s to less than 1 s, depending drastically on the sample heating rate (up to 29°C s−1, maximum 120 W microwave power). The transit times given here also include the time required to raise the sample temperature through a 5–7°C range.
Many ethanolamine phospholipids (PEs) also show a transition from the lamellar Lβ phase, with its all-trans acyl chains oriented perpendicular to the bilayer plane, to the Lα phase, with fluid-like chains. T-jump experiments on the transition of 1-palmitoyl-2-oleoyl-PE (POPE) show that the transformation proceeds on the same time-scale as the duration of the laser pulse, i.e., in much less than 2 ms in that case.56,70 In contrast to DEPC (Fig. 1), the transition appears to be two-state, and there is no sign of an intermediate structure.
The lamellar Lβ′ gel–Lα and Lα–inverted hexagonal (HII) transition of dihexadecylphosphatidylethanolamine (DHPE) was also studied using the microwave heating technique. Regardless of the direction, both phase transitions appear to be two-state with no accumulation of intermediates to within the sensitivity limits of the method, and the transitions have an upper bound on the time required to complete the transition of <3 s. At the maximum power input of 120 W, the Lβ′–Lα and Lα–HII transit times were 2.1 and 2.6 s, respectively.45
3.2 Lamellar to non-lamellar phase transitions of one-component lipid systems
Experiments for investigating the lamellar–HII transition kinetics have been performed, for example, on DOPE dispersions. The T,p phase diagram of DOPE in excess water is depicted in Fig. 8.63Fig. 9 shows the diffraction patterns at 20°C after a pressure jump from 300 to 120 bar. Clearly, the (001) reflection of the Lα phase and the (10) reflection of the developing HII phase can be identified. In this case, a two-state mechanism is observed. Interestingly, we find that successive temperature jumps lead to an acceleration of the phase transition kinetics. The half-transit time decays from 8.5 s for the first pressure jump to 5.3 s after the fourth jump [Fig. 10(a)]. An induction period of several seconds is observed after the pressure jump before the first Bragg reflections of the newly formed HII phase appear. Upon successive pressure cycles, this induction period decreases, whereas the rate of phase transformation, as obtained from the intensity curves, remains essentially constant. An explanation for this phenomenon might be the formation of defect structures, such as inverted intermicellar intermediates (IMIs), which are formed during the pressure cycles and which have not healed out between successive pressure cycles. This observation also shows that the history of sample preparation plays an essential role in these kind of studies.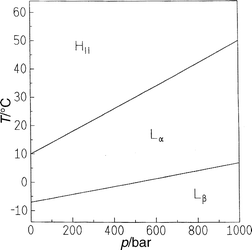 | ||
| Fig. 8 T,p phase diagram of DOPE in excess water. | ||
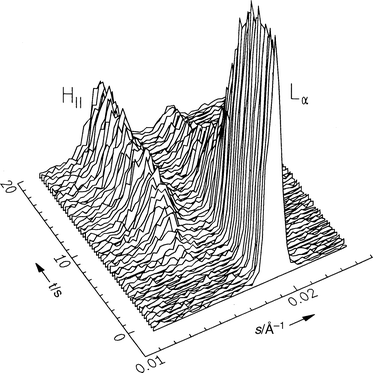 | ||
| Fig. 9 Selected diffraction patterns of DOPE in excess water after a pressure jump from 300 to 120 bar at 20°C. | ||
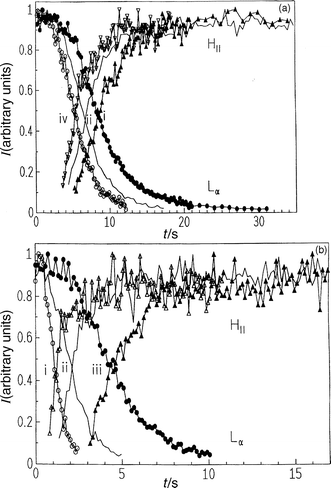 | ||
| Fig. 10 Intensities of Bragg reflections of the Lα and HII phase of DOPE–excess water, (a) after the first (i), second (ii) and fourth (iv) p-jump from 300 to 120 bar at T=20°C and (b) after p-jumps from 300 to (i) 1, (ii) 60 and (iii) 110 bar at T=20°C. | ||
In Fig. 10(b) it is shown that with increasing pressure-jump amplitude, the induction period decreases and the rate of phase transformation increases [e.g., 10%/0.6 s phase change for a 300→110 bar jump (induction period 5 s) and 10%/0.15 s phase change for a 300→1 bar pressure jump (induction period 0.5 s)].
Fig. 11 exhibits the lattice constants and half-widths of the Bragg reflections of the Lα and HII phase at 20°C after a pressure jump from 300 to 110 bar. After 20 ms the lattice constant of the Lα phase has decreased by 0.2 Å, owing to fast conformational changes (probably on the nanosecond time- scale) of the lipid molecules. After 250 ms a(Lα) decreases slowly to 50.6 Å. Following an induction period, the Bragg reflection of the HII phase appears, a(HII) first decreases slightly and then increases again owing to water uptake by 0.5 Å up to 73.9 Å after about 30 s. At the same time when the HII phase is formed, a(Lα) decreases rapidly. The decrease in half-width of the (10) reflection of the HII phase with time might be due to the formation of an elongation and a denser packing of the micellar tubes forming the hexagonal structure. As the fully hydrated HII phase needs much more water than the lamellar phase, and the lattice constant a(HII) does not change significantly with time, one can assume that the necessary water uptake occurs within the defect structures being formed during the induction period. These structures do not lead to coherent scattering patterns, however.
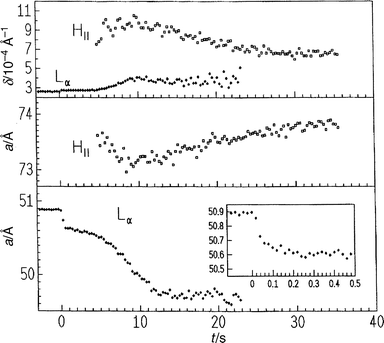 | ||
| Fig. 11 Lattice constants a and half-widths δ of the first-order Bragg reflections of the Lα phase and the HII phase of DOPE in excess water after a pressure jump from 300 to 110 bar at T=20°C. | ||
As a second example of a lamellar Lα to HII transition, we focused on the egg-PE system. Dispersions of egg-PE in excess water spontaneously form lamellar Lβ and Lα (at Tm=15°C) phases and an HII structure is found at 55°C. We carried out a pressure-jump experiment from 360 to 120 bar at T=62°C (Fig. 12). Clearly, the (001) Bragg reflection of the Lα phase and the (10), (11) and (20) reflections of the developing HII phase are seen. Also in this case no intermediate structures are detectable. The lattice constant a and half-widths of the first-order Bragg reflections of the Lα phase (a=d, d lattice spacing) and the HII phase (a=2d/√3) of egg-PE are shown in Fig. 13. The lattice constant of the lamellar Lα phase decreases by 0.2 Å immediately after the p-jump, and then decreases slowly to 49 Å. The corresponding lattice constant of the HII phase increases by 0.4 Å and reaches a value of 71.7 Å after about 5 s. It can be clearly seen that the Lα phase decreases rapidly at the beginning, and much more slowly after 3–4 s. After an induction period of about 1 s the HII phase evolves. We observe a slight increase in the half-width δ of the lamellar reflection and a concomitant decrease in δ of the (10) reflection of the nascent HII phase. Up to a degree of transition of about 80%, the intensities of Bragg peaks change linearly with time (ca. 10%/0.35 s), and decrease much more slowly at the end of the transition, from 4 to 9 s. The relative intensities of the Bragg peaks at the beginning of the transition reveal that the transition is highly cooperative and probably follows a two-state process, at least at the experimental time resolution. The slower time-scale at the end of the transition might be caused by domain size effects.
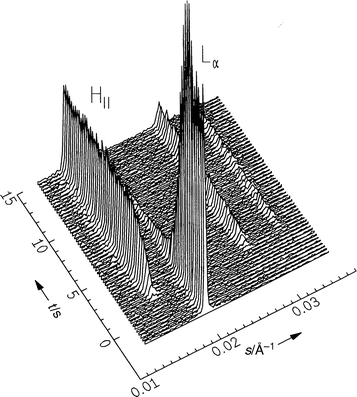 | ||
| Fig. 12 Selected diffraction patterns of egg-PE in excess water after a pressure jump from 360 to 120 bar at T=62°C. | ||
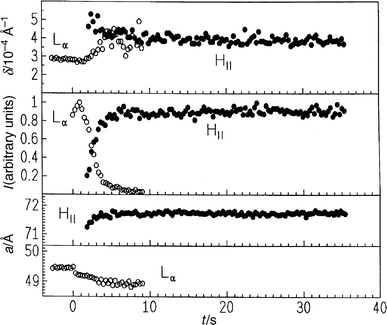 | ||
| Fig. 13 Lattice constants a, intensities I and half-widths δ of first-order Bragg reflections of the Lα and HII phase of egg-PE after a p-jump from 360 to 120 bar at T=62°C. | ||
Interestingly, T-jump experiments on SOPE dispersions reveal an intermediate thin Lα phase in the course of the Lα–HII transition.56 The formation of the thinner Lα phase occurs within the first 5 ms. After a lag period of approximately 20 ms, the first sign of the HII lattice becomes visible. The HII reflection grows in intensity at the expense of the co-existing Lα (thin) signal, and gradually shifts to its final equilibrium position within at least 10 s. Kinetic studies of the Lβ to inverse hexagonal HII phase transition of glycolipids using T-jump techniques can also be described by a sequential mechanism where intermediate thinner lamellar structures might be involved.58
3.3 Lamellar and non-lamellar phase transitions of binary lipid systems
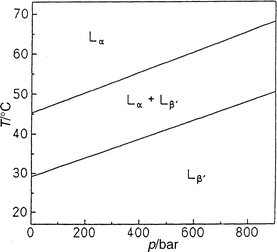 | ||
| Fig. 14 T,p phase diagram of a DMPC–DSPC (1:1 mol/mol) dispersion in excess water. | ||
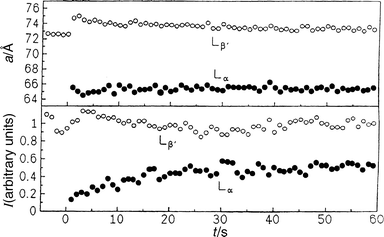 | ||
| Fig. 15 Lattice constants a and intensities I of the first-order Bragg reflections of the Lα and Lβ′ gel phases of DMPC–DSPC (40 wt.%) in excess water after a pressure jump from 400 to 180 bar at T=40°C. | ||
![T,p
phase diagram of DMPC–MA (1:2 mol/mol) in excess water [at low temperature, co-crystallization of pure crystalline myristic acid (Lc phase) and a crystalline lamellar lipid mixture, Lccom, which denotes a crystalline compound phase, occurs].](/image/article/2000/CP/a907613a/a907613a-f16.gif) | ||
| Fig. 16 T,p phase diagram of DMPC–MA (1:2 mol/mol) in excess water [at low temperature, co-crystallization of pure crystalline myristic acid (Lc phase) and a crystalline lamellar lipid mixture, Lccom, which denotes a crystalline compound phase, occurs]. | ||
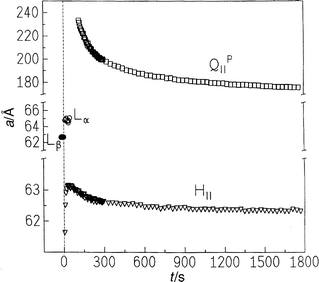 | ||
| Fig. 17 Lattice constants of the Lβ, Lα, HII and QIIP phase of DMPC–MA (1:2, 25 wt.%) after a p-jump from 400 to 110 bar at T=58°C. | ||
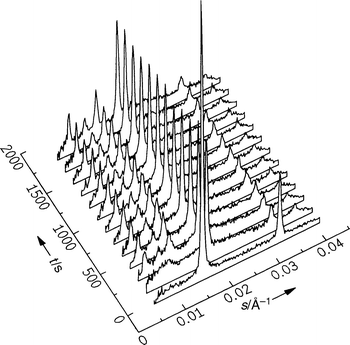 | ||
| Fig. 18 Selected diffraction patterns of DMPC–MA (1:2 mol/mol) in excess water (75 wt.%) after a pressure jump from 400 to 110 bar at T=58°C (only the data at low time resolution are shown here). | ||
The Bragg reflections of the HII phase appear immediately after the pressure jump. It is remarkable that the lattice constant of the hexagonal structure first increases by about 1.5 Å before it decreases again to reach an equilibrium value of about 62.6 Å. The lattice constant of the cubic phase decreases from an initial high value of about 233 Å slowly to its equilibrium value of 176 Å within 30 min. The rates of both decay processes are similar. The unusual pressure dependence of the HII lattice constant might be due to the co-existence of phases with different levels of hydration or, more likely, to a partial dissociation of the 1:2 lecithin–fatty acid complex, which would be in accordance with the Gibbs phase rule. A detailed analysis of the intensities of the Bragg peaks as a function of time indicates that the amount of the HII phase runs through a broad maximum. While the intensity of the Lβ peak decreases, first the HII peaks appear and begin to increase before the Lα peak sets in. As the Lβ phase vanishes, the intensity of the Bragg peak belonging to the Lα phase passes through a maximum and decreases afterwards while the intensity of the HII peaks grow further. Around 50 s after the pressure jump and after the Lα phase has disappeared, the amount of HII phase decreases slightly at the expense of the QIID phase, which is formed after about 2 min. The transition is completed after about 30 min.
Fig. 19 gives the SAXS intensities of the DMPC–MA (1:2) mixture at 61°C after pressure jumps Δp starting at 660 bar in the Lβ phase and ending at a final pressure of (i) 300, (ii) 365 and (iii) 430 bar, respectively. As can be clearly seen, the lifetime of the Lβ phase increases significantly with decreasing pressure-jump amplitude Δp, and the transient Lα phase starts to develop later. The decay of the intensity of the Lβ lattice is linear with time within the accuracy of the measurements. The intensity has decayed to zero after 6.5 s for Δp=360 bar, after 10 s for Δp=295 bar and after 30 s for Δp=230 bar. The time of the first observation of the Lα phase increases correspondingly with decreasing pressure amplitude, from 1.5 s at Δp=360 bar and 4.5 s at Δp=295 bar to about 12 s at Δp=230 bar. The intensity of the Lα peak increases as long as the Lβ phase co-exists, and then begins to decay. Zero intensity is reached after about 28 and 34 s, respectively, for the first two p-jump amplitudes. The HII intensity reaches its plateau value after about 30–40 s, and then decays again after about 1–2 min when the cubic phase QIIP starts to build up.
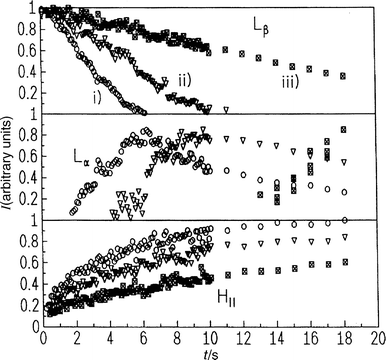 | ||
| Fig. 19 Intensities of Bragg reflections of the Lβ , Lα and HII phase of DMPC–MA (1:2, 25 wt.%) after a p-jump from 660 bar to (i) 300, (ii) 365 and (iii) 430 bar at T=61°C. | ||
The p-jump amplitude has thus been found to have a significant influence on the kinetics of the phase transformation, the mechanism remaining the same. An increase in amplitude leads to an increase in chemical potential difference between phases and thus a faster decay of the Lβ phase and the more rapid formation of the HII phase. Indeed, it seems that the rate of the Lβ–HII phase transformation depends on the distance of the final pressure pend from the pressure of the phase transition boundary ptr. For the differences pend−ptr of 80, 145 and 210 bar, the initial formation of the Lα phase is observed about 13, 5 and 2 s after the pressure jump, respectively.
In the initial step the Lβ phase probably transforms to the HII phase (Lβ→HII) without forming a long-lived intermediate phase, because the water content of the phases is low. When enough water has diffused into the lamellar structure, another transformation pathway probably opens, the transformation to the HII phase with the Lα phase as an intermediate state (Lβ→Lα→HII). The first Bragg peaks of the cubic structure QIIP are observed about 1–2 min after the lamellar phases have disappeared. The formation of the cubic structure therefore does not seem to be involved in the primary phase transformation process. Precursors of the cubic structure might be formed at an earlier stage, however.
Recently, the rate of phase transformation between the lamellar Lβ gel phase and the fluid HII phase of the binary lipid mixture DPPC–PA (1: 2) has also been investigated.41 Pressure-jump experiments across the Lβ→HII transition of DPPC–PA (1: 2) in 75 wt.% water were carried out at, e.g., 71°C from 520 to 200 bar. The intensity of the lamellar Bragg reflection decreases almost linearly and vanishes 20 s after the pressure jump, and no indication of the existence of an intermediate Lα phase has been found. The lattice constant of the HII phase increases from 62 to 67 Å within 20 s. The linewidth of the (001) Bragg reflection of the disappearing Lβ phase increases by about 30%, and that of the initially formed hexagonal phase decreases slightly (by ca. 10–20%) until completion of the phase transformation. The intensity of the (10) Bragg reflection of the hexagonal structure reaches a plateau value after about 25 s. In contrast to DMPC–MA (1:2) dispersions, no cubic phase is formed in the DPPC–PA (1: 2) system, and the Lβ to HII conversion seems to be a simple two-state process.
3.4 Lattice relaxation studies
To prove that the water flow into and in the new phase with its different equilibrium level of hydration is a rate determining step in the transition kinetics of many lipid mesophase transformations, we performed lattice relaxation experiments within the different lipid phases.As an example, Fig. 20(a) shows the lattice constant of the HII phase of DOPE in both pressure directions, from 90 to 310 bar and from 335 to 100 bar. The intensities of Bragg reflections and their half-widths do not change within the accuracy of the experiment (data not shown), indicating that the water exchange is a highly cooperative and uniform process, only a(HII) being time dependent. The observed temperature and pressure dependences are as expected from equilibrium measurements, da(HII)/dT=−0.2 Å°C−1 and da(HII)/dp ≈5.5 Å kbar−1 at, e.g., T=50°C. The lattice relaxation a(t) exhibits a non-exponential time dependence. At T=50°C it is about 0.5 s faster than at 37°C. The total transition times for the hexagonal lattice relaxation are in the range 10–20 s.
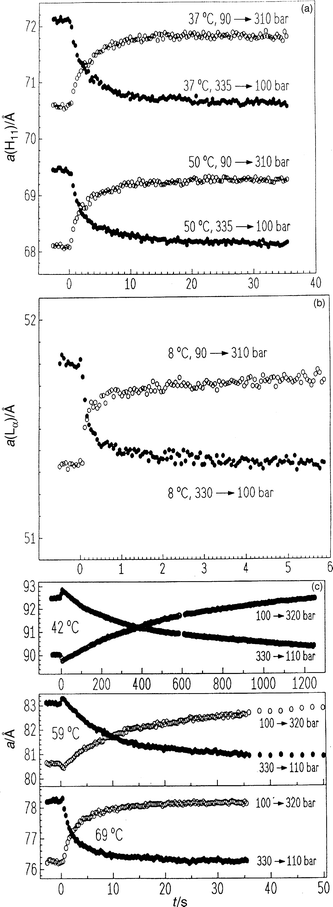 | ||
| Fig. 20 (a) Lattice constant a(HII) of the HII phase of DOPE in excess water after p-jumps from 90 to 310 bar and from 335 to 100 bar at T=37 and 50°C, respectively; (b) lamellar lattice constant a(Lα) of the Lα phase of DOPE in excess water after a p-jump from 90 to 310 bar and from 330 to 100 bar at T=8°C; (c) lattice constant a of the QIID phase of MO–excess water after p-jumps from 100 to 320 bar and from 330 to 110 bar at three selected temperatures (42, 59 and 69°C). | ||
Fig. 20(b) shows the lamellar lattice constant of DOPE–excess water at T=8°C for p-jumps from 90 to 310 bar and from 330 to 100 bar. Also here, no changes in intensities and half-widths of the Bragg reflections are observed after the p-jumps. The pressure dependence of the lamellar lattice constant is smaller (1.8 Å kbar−1) than that of the HII structure. Also here a non-exponential time evolution of a(t) is observed. The total relaxation time is about a factor of 10 faster than that in the hexagonal phase at corresponding p-jump amplitudes.
For studying the lattice relaxation of a simple bicontinuous cubic system, we performed diffraction studies on the cubic phase QIID of MO (for the phase diagram, see refs. 17 and 74). The diffraction pattern of the cubic phase in MO-excess water after a p-jump from 330 to 110 bar at T=59°C was measured (data not shown). Also in this case, the intensities and half-widths of the Bragg peaks do not change after the p-jump. Fig. 20(c) exhibits the time evolution of the cubic lattice constant. Directly after the p-jump, the lattice constant has changed owing to the abrupt pressure change and to a slightly different temperature, which is due to a small adiabatic temperature change in the course of the p-jump shown here. The relaxation of the lattice constant to its new equilibrium value is comparably slow and is also non-exponential. The curves in the pressurization and depressurization directions are symmetrical with each other. Characteristic relaxation times, determined here by the point of intersection of the two curves, depend drastically on the temperature; they are 370 s at 42°C, 9.5 s at 59°C and 1.9 s at 69°C.
A precise theoretical description of the water flow in these systems using classical hydrodynamics is difficult, as the continuum theory for these small mesoscopic dimensions is not exactly applicable, interactions of water molecules with the bilayer surface are neglected and the lattice parameters change slightly as a function of time after the p-jump. Also, the domain sizes of the crystallites and their size distribution can only crudely be estimated. Calculations based on a Gaussian distribution of sizes, and taking into account the corresponding tortuosity factor of the lattice structure, show, however, that the kinetic lattice relaxation curves can, at least qualitatively, be described by a simple water diffusion model.75 We shall not consider this point in detail here and present one example only. The relaxation curves a(t) for the lattice relaxation of the HII phase of DOPE–water [Fig. 20(a)] can be fitted by a water diffusion model using Fick's second law at the appropriate boundary conditions75,76 using the following parameters: D(37°C)=3.4×10⁻⁹ m2 s−1, D(50°C)=4.0×10⁻⁹ m2 s−1 and mean crystallite dimensions=240±60 µm. From the temperature dependence of a(t), as determined from the measurements at 37 and 50°C, an apparent activation energy of 18.2 kJ mol−1 can be calculated, which coincides with the activation energy for bulk water diffusion (18.8 kJ mol−1). Other cases are observed, however (in particular for the polycrystalline cubic phases), where the temperature dependence cannot be described in simple terms, e.g. assuming an Arrhenius type of activation energy for the water flow. This leads us to the conclusion that other kinetic processes cannot be neglected, such as lipid diffusion (the lateral diffusion coefficient of the lipid molecules is about two orders of magnitude smaller than that of bulk water), nucleation processes and domain size growth. This might be a reason for the metastability of phases often observed in these systems, the understanding of which requires the introduction of the phenomena of nucleation and growth. In general, these contributions seem to play a minor role, however.
4 Conclusions
By using the pressure-jump relaxation technique in combination with time-resolved synchrotron X-ray diffraction, the kinetics of different lipid phase transformations under conditions close to and far from equilibrium have been determined. So far, almost exclusively temperature-jump relaxation studies have been performed. The two techniques are based on different kinetic parameters that do not necessarily probe the same pathway and can thus lead to different results. Several examples (e.g., DPPC, PEs) have been discussed.Generally, the results show that the relaxation behaviour and the kinetics of pressure-induced lipid phase transformations depend drastically on the topology of the lipid mesophase, and also on the temperature and the driving force, i.e., the applied pressure-jump amplitude Δp. Often multicomponent kinetic behaviour is observed, with short relaxation times (probably on the nanosecond to microsecond time-scale) in a ‘burst phase ’ referring to the relaxation of the lipid acyl chain conformation in response to the pressure change, which leads to the small changes in the observed lattice constants right after the pressure jump. The longer relaxation times measured here are due to the kinetic trapping of the system. In most cases the rate of the transition is limited by the transport and redistribution of water into and in the new lipid phase, rather than being controlled by the time required for a rearrangement of the lipid molecules. This can be inferred from the lattice relaxation experiments performed in the lipid one-phase regions and by modelling the data using simple hydrodynamics. The tortuosity (obstruction) factor of the different structures, especially in cases where non-lamellar (hexagonal and cubic) phases are involved, controls the different kinetic components. Nucleation phenomena and domain size growth of the structures evolving play a minor role.
In many cases (e.g., DEPC, DMPC–MA) a disgression of the mechanism of phase transformation observed under slow-scanning equilibrium conditions appears under high free energy gradients (here large pressure-jump amplitudes). The high driving force drives the system through a correlated ordered intermediate state, which provides a new and efficient pathway for the relaxation process. These kinds of ordered structures are probably examples of the concept of dissipative structures well-known in non-linear thermodynamics. Interestingly, ordered structures are involved as intermediates not only in symmetry-heterologous but also in symmetry-homologous transitions where the equilibrium phases do not differ in their structural symmetries (e.g., lamellar–lamellar transitions).
A memory effect in repeatedly passing the lipid phase transition has been observed in several lipid systems (e.g., DOPE, egg-PE). This is due to the existence of long-lived defect states which do not heal during successive cycles across the transition.
Kinetic studies on more-component lipid systems have also been presented. Phase segregation and lipid complex dissociation phenomena have been shown to play an important role in these systems. In more-component systems, such as DMPC–MA, multiple pathway mechanisms are also possible.
With most of the basic technical problems for performing time-resolved synchrotron X-ray diffraction experiments in combination with the pressure-jump relaxation technique having been sorted out, the stage is now well set for further work addressing more questions in the field of soft condensed matter and biomolecular phase transformations, such as unfolding/refolding reactions of proteins.60
Abbreviations
PC, phosphatidylcholine; PE, phosphatidylethanolamine; PS, phosphatidylserine; FA, fatty acid; SA, stearic acid; LA, lauric acid; MA, myristic acid; PA, palmitic acid; MO, monoolein; ME, monoelaidin; DMPC, 1,2-dimyristoyl-sn-glycero-3-phosphatidylcholine (di-C14:0); DPPC, 1,2-dipalmitoyl-sn-glycero-3-phosphatidylcholine (di-C16:0); DSPC: 1,2-distearoyl-sn-glycero-3-phosphatidylcholine (di-C18:0); DOPC: 1,2-dioleoyl-sn-glycero-3-phosphatidylcholine (di-C18:1,cis); DOPE, 1,2-dioleoyl-sn-glycero-3-phosphatidylethanolamine (di-C18:1,cis); POPC, 1-palmitoyl-2-oleoyl-sn-glycero-3-phosphatidylcholine (C16:0, C18:1,cis); DEPC: 1,2-dielaidoyl-sn-glycero-3-phosphatidylcholine (di-C18:1,trans); SOPE, 1-stearoyl-2-oleoyl-phosphatidylethanolamine (C18:0, C18:1,cis); egg-PE, egg-yolk phosphatidylethanolamine; DHPE, dihexadecylphosphatidylethanolamine.Acknowledgements
Financial support from the Deutsche Forschungsgemeinschaft (DFG) and the Fonds der Chemischen Industrie is gratefully acknowledged.References
- J. M. Seddon, Biochim. Biophys. Acta, 1990, 1031, 1 CAS.
- J. M. Seddon and R. H. Templer, Philos. Trans. R. Soc. London Ser. A, 1993, 344, 377 Search PubMed.
- Phospholipids Handbook, ed. G. Cevc, Marcel Dekker, New York, 1993. Search PubMed.
- Lipid Polymorphism and Membrane Properties, Current Topics in Membranes, vol. 44, ed. R. M. Epand, Academic Press, San Diego, 1997. Search PubMed.
- Structure and Dynamics of Membranes, vols. 1A, 1B, ed. R. Lipowski and E. Sackmann, Elsevier, Amsterdam, 1995. Search PubMed.
- R. Winter, A. Landwehr, Th. Brauns, J. Erbes, C. Czeslik and O. Reis, in High Pressure Effects in Molecular Biophysics and Enzymology, ed. J. L. Markley, D. B. Northrop and C. A. Royer, Oxford University Press, Oxford, 1996, p. 274. Search PubMed.
- J. F. Nagle, H. I. Petrache, N. Gouliaev, S. Tristram-Nagle, Y. Liu, R. M. Suter and K. Gawrisch, Phys. Rev. E: Stat. Phys., 1999, 58, 7769 Search PubMed.
- R. Winter and W. C. Pilgrim, Ber. Bunsen-Ges. Phys. Chem., 1989, 93, 708 Search PubMed.
- L. F. Braganza and D. L. Worcester, Biochemistry, 1986, 25, 2591 CrossRef CAS.
- M. Böttner, D. Ceh, U. Jacobs and R. Winter, Z. Phys. Chem., 1994, 184, 205 Search PubMed.
- P.-L. G. Chong and G. Weber, Biochemistry, 1983, 22, 5544 CrossRef CAS.
- P. T. T. Wong, D. J. Siminovitch and H. H. Mantsch, Biochim. Biophys. Acta, 1988, 947, 139 CAS; D. Carrier and P. T. T. Wong, Eur. J. Solid State Inorg. Chem., 1997, 34, 733 CAS.
- D. A. Driscoll, J. Jonas and A. Jonas, Chem. Phys. Lipids, 1991, 58, 97 CrossRef CAS.
- A. Landwehr and R. Winter, Ber. Bunsen-Ges. Phys. Chem., 1994, 98, 214 Search PubMed.
- P. T. C. So, S. M. Gruner and E. S. Shyamsunder, Phys. Rev. Lett., 1993, 70, 3455 CrossRef CAS.
- O. Reis, R. Winter and T. W. Zerda, Biochim. Biophys. Acta, 1996, 1279, 5 CrossRef CAS.
- C. Czeslik, R. Winter, G. Rapp and K. Bartels, Biophys. J., 1995, 68, 1423 Search PubMed.
- A. Cheng, A. Mencke and M. Caffrey, J. Phys. Chem., 1996, 100, 299 CrossRef CAS.
- P. M. Duesing, J. M. Seddon, R. H. Templer and D. A. Mannok, Langmuir, 1997, 13, 655.
- B. B. Bonev and M. R. Morrow, Biophys. J., 1995, 69, 518 Search PubMed.
- C. Czeslik, O. Reis, R. Winter and G. Rapp, Chem. Phys. Lipids, 1998, 91, 135 CrossRef CAS.
- G. Lindblom and L. Rilfors, Biochim. Biophys. Acta, 1989, 988, 221 CAS.
- M. W. Tate, E. F. Eikenberry, D. C. Turner, E. Shyamsunder and S. M. Gruner, Chem. Phys. Lipids, 1991, 57, 147 CrossRef CAS.
- J. Erbes, C. Czeslik, W. Hahn, M. Rappolt, G. Rapp and R. Winter, Ber. Bunsen-Ges. Phys. Chem., 1994, 98, 1287 Search PubMed.
- V. Luzzati, R. Vargas, P. Mariani, A. Gulik and H. Delacroix, J. Mol. Biol., 1988, 229, 540 CrossRef CAS.
- V. Luzzati, J. Phys. II, 1995, 5, 1649 Search PubMed.
- P. Mariani, V. Luzzati and H. Delacroix, J. Mol. Biol., 1988, 204, 165.
- V. Luzzati, Curr. Opin. Struct. Biol., 1997, 7, 661 CrossRef CAS.
- D. P. Siegel, Biophys. J., 1993, 65, 2124 Search PubMed.
- S. T. Hyde, J. Phys. Chem., 1989, 93, 1458 CrossRef CAS.
- The Language of Shape. The Role of Curvature in Condensed Matter: Physics, Chemistry and Biology, ed. S. Hyde, S. Andersson, K. Larsson, Z. Blum, T. Landth, S. Lidin and B. W. Ninham, Elsevier, Amsterdam, 1997. Search PubMed.
- R. H. Templer, J. M. Seddon and N. A. Warrender, Biophys. Chem., 1994, 49, 1 Search PubMed.
- R. H. Templer, D. C. Turner, P. Harper and J. M. Seddon, J. Phys. II, 1995, 5, 1053 Search PubMed.
- R. H. Templer, Langmuir, 1995, 11, 334 CrossRef CAS.
- R. H. Templer, J. M. Seddon, P. M. Duesing, R. Winter and J. Erbes, J. Phys. Chem., 1998, 102, 7262 CrossRef CAS; R. H. Templer, J. M. Seddon, N. A. Warrender, A. Syrykh, Z. Huang, R. Winter and J. Erbes, J. Phys. Chem., 1998, 102, 7251 CrossRef CAS.
- H. Chung and M. Caffrey, Biophys. J., 1994, 66, 377 Search PubMed.
- H. Chung and M. Caffrey, Nature (London), 1994, 368, 224 CrossRef CAS.
- High Pressure and Biotechnology, ed. C. Balny, R. Hayashi, K. Heremans and P. Masson, Colloque Inseram, vol. 224, John Libbey Eurotext, Montrouge, 1992. Search PubMed.
- High Pressure Molecular Science, ed. R. Winter and J. Jonas, NATO ASI E 358, Kluwer, Dordrecht, 1999. Search PubMed.
- M. Caffrey, J. Hogan and A. Mencke, Biophys. J., 1991, 60, 456 Search PubMed.
- J. Erbes, R. Winter and G. Rapp, Ber. Bunsen-Ges. Phys. Chem., 1996, 100, 1713 Search PubMed.
- K. Elamrani and A. Blume, Biochemistry, 1993, 22, 3305.
- B. Gruenewald, A. Blume and F. Watanabe, Biochim. Biophys. Acta, 1980, 597, 41 CAS.
- M. Steinhart, M. Kriechbaum, K. Pressl, H. Amenitsch and P. Laggner, Rev. Sci. Instrum., 1999, 70, 1540 CrossRef CAS.
- M. Caffrey, Biochemistry, 1985, 24, 4826 CrossRef CAS; M. Caffrey, R. L. Magin, B. Hummel and J. Zhang, Biophys. J., 1990, 58, 21 Search PubMed.
- A. Genz, J. F. Holzwarth and T. Y. Tsong, Biophys. J., 1986, 50, 1043 Search PubMed.
- M. L. Johnson, W. W. Van Osdol and S. G. Frasier, Comments Mol. Cell Biophys., 1985, 3, 77 Search PubMed; W. W. Van Osdol, R. L. Biltonen and M. L. Johnson, J. Biochem. Biophys. Res. Methods, 1989, 20, 1 Search PubMed.
- M. Caffrey, Biochemistry, 1987, 26, 6349 CrossRef CAS.
- P. Laggner, Top. Curr. Chem., 1988, 145, 173 Search PubMed.
- P. Laggner, M. Kriechbaum and G. Rapp, J. Appl. Crystallogr., 1991, 24, 836 CrossRef.
- M. Caffrey, G. Fanger, R. L. Magin and and J. Zhang, Biophys. J., 1990, 58, 677 Search PubMed.
- P. Laggner and M. Kriechbaum, Chem. Phys. Lipids, 1991, 57, 121 CrossRef CAS.
- P. J. Quinn and L. J. Lis, Mol. Cryst. Liq. Cryst., 1989, 167, 109 Search PubMed.
- R. L. Biltonen and Q. Ye, Prog. Colloid Polym. Sci., 1993, 93, 112 Search PubMed.
- G. Rapp, M. Rappolt and P. Laggner, Prog. Colloid Polym. Sci., 1993, 93, 25 Search PubMed.
- P. Laggner and M. Kriechbaum, in Modern Aspects of Small-Angle Scattering, ed. H. Brumberger, Kluwer, Dordrecht, 1995, pp. 387–407. Search PubMed.
- M. Clerc, P. Laggner, A.-M. Levelut and G. Rapp, J. Phys. II, 1995, 5, 901 Search PubMed.
- M. Köberl, H.-J. Hinz, M. Rappolt and G. Rapp, Ber. Bunsen-Ges. Phys. Chem., 1997, 101, 789 Search PubMed.
- G. Rapp, A. Gabriel, M. Dosière and M. H. J. Koch, Nucl. Instrum. Methods Phys. Res., Sect. A, 1995, 357, 178 Search PubMed.
- G. Panick, R. Malessa, R. Winter, G. Rapp, K. J. Frye and C. Royer, J. Mol. Biol., 1998, 275, 389 CrossRef CAS.
- M. Kotlarchyk and S. M. Ritzau, J. Appl. Crystallogr., 1991, 24, 753 CrossRef CAS.
- R. Zhang, S. Tristram-Nagle, W. Sun, R. L. Headrick, T. C. Irving, R. M. Suter and J. F. Nagle, Biophys. J., 1996, 70, 349 Search PubMed.
- R. Winter, J. Erbes, C. Czeslik and A. Gabke, J. Phys.: Condens. Matter, 1998, 10, 11499 Search PubMed.
- Phospholipid Bilayers, ed. G. Cevc and D. Marsh, John Wiley & Sons, New York, 1997. Search PubMed.
- M. J. Ruocco and G. G. Shipley, Biochim. Biophys. Acta, 1982, 684, 59 CAS; M. J. Ruocco and G. G. Shipley, Biochim. Biophys. Acta, 1982, 691, 309 CAS.
- S. Tristam-Nagle, R. M. Suter, W.-J. Sun and J. F. Nagle, Biochim. Biophys. Acta, 1994, 1191, 14.
- B. G. Tenchov, H. Yao and I Hatta, Biophys. J., 1989, 56, 757 Search PubMed.
- P. C. Mason, B. D. Gaulin, R. M. Epand, G. D. Wignall and J. S. Lin, Phys. Rev. E: Stat. Phys., 1999, 59, 921 Search PubMed.
- M. Rappolt and G. Rapp, Eur. Biophys. J., 1996, 24, 381 CrossRef CAS.
- G. Rapp and R. S. Goody, J. Appl. Crystallogr., 1991, 24, 857 CrossRef.
- A. Landwehr and R. Winter, Ber. Bunsen-Ges. Phys. Chem., 1994, 98, 1585 Search PubMed.
- C. Czeslik, J. Erbes and R. Winter, Europhys. Lett., 1997, 37, 577 Search PubMed.
- R. Winter, J. Erbes, R. H. Templer, J. M. Seddon, A. Syrykh, N. A. Warrender and G. Rapp, Phys. Chem. Chem. Phys., 1999, 1, 887 RSC.
- O. Reis and R. Winter, Langmuir, 1998, 14, 2903 CrossRef CAS.
- Diffusion, ed. W. Jost, Academic Press, New York, 1960. Search PubMed.
- J. Erbes, PhD Thesis, University of Dortmund, Shaker-Verlag, Aachen, 1996..
| This journal is © the Owner Societies 2000 |
