 Open Access Article
The freezing tendency towards 4-coordinated amorphous networks causes an increase in the heat capacity of supercooled Stillinger–Weber silicon†
Pankaj A.
Apte
*a,
Nandlal
Pingua
a,
Arvind Kumar
Gautam
a,
Uday
Kumar
a,
Soohaeng Yoo
Willow
b,
Xiao Cheng
Zeng
c and
B. D.
Kulkarni
d
aDepartment of Chemical Engineering, Indian Institute of Technology Kanpur, Kanpur, Uttar Pradesh, India. E-mail: papte@iitk.ac.in; nlpingua@iitk.ac.in; akgautam@iitk.ac.in; udayiitian2007@gmail.com
bDepartment of Chemistry, University of Illinois, Urbana-Champaign, 600 South Mathews Avenue, Urbana, Illinois 61801, USA. E-mail: willow@illinois.edu
cDepartment of Chemistry, University of Nebraska-Lincoln, Lincoln, Nebraska 68588, USA. E-mail: xzeng1@unl.edu
dCSIR-National Chemical Laboratory, Pashan Road, Pune 411008, India. E-mail: bd.kulkarni@ncl.res.in
First published on 18th May 2015
Abstract
Supercooled liquid silicon (Si), modeled by the Stillinger–Weber (SW) potential, has been shown to undergo transition to low density amorphous phases at 1060 K in previous studies. Furthermore, the constant pressure heat capacity Cp has been found to exhibit a large increase as the liquid is cooled to 1060 K. In this work, we examine the nature of the equilibrium and the relaxation process of supercooled SW Si in the temperature range of 1060 K to 1070 K at zero pressure. We find that the relaxation of the supercooled liquid leads to a sharp irreversible decrease in the fluctuation of the two body energy of the largest connected network of 4-coordinated particles. Such a process implies a tightening of the bonds (i.e. freezing or jamming) of the network, and is accompanied by a sharp increase in the fraction of the 4-coordinated particles in the system. We find that the jamming (or freezing) process shows a sudden acceleration across a dynamical instability point that occurs at a unique potential energy state of the network. Further, we find that the occurrence of the dynamical instability is associated with the appearance of a straight line region in the cumulative potential energy distributions with a configurational temperature close to 1060 K. We conclude that the supercooled liquid state must be regarded as a constrained equilibrium state, since the accessible microstates are constrained by the inherent tendency of the system to approach the dynamical instability point. Thus all properties of supercooled liquid SW-Si, including the rise in Cp at 1060 K, can be attributed to the freezing tendency of the 4-coordinated particle network.
1 Introduction
Many commonly found alloys and materials are known to undergo “lambda” transitions (also known as order–disorder transitions) at a certain temperature at which the constant pressure heat capacity displays a maximum.1 The shape of the Cp–T curve around the maximum resembles that of the Greek letter λ. Such transitions differ from first-order transitions in that no known discontinuity in volume or enthalpy exists at the transition point. As the transition point is approached, there is a large increase in Cp and, after the transition, there is a sharp drop to a value which is characteristic of the vibrations of molecules around their lattice sites. The β-brass (copper–zinc) alloy is an example of this kind.1 The supercooled silicon (Si), modeled by the Stillinger–Weber (SW) potential2 (a commonly used computationally tractable model of silicon with a melting temperature of Tm ≈ 1678 K), displays a Cp maximum (around 1060 K at zero pressure) that is reminiscent of a lambda transition3,4 (see Fig. 1 of ref. 3 and Fig. 6 of ref. 4). In this work, we examine the nature of the equilibrium of the supercooled state and the relaxation process at and just above 1060 K, where Cp shows a maximum. We find that the equilibrium state properties, including the rise of Cp at 1060 K, can be attributed to the cooperative behavior of the network of 4-coordinated particles.First, we review below the important literature results on supercooled SW-Si. At the outset, it must be pointed out that most of the previous studies were based on cooling ‘experiments’, i.e., the changes in the properties of the supercooled liquid were investigated while the system is cooled in molecular dynamics (MD) simulations at a certain rate. In the earliest of such studies,5,6 a sharp change in the average density and average energy at 1060 K and zero pressure was observed, leading to the conclusion that supercooled SW-Si undergoes a ‘transition’ to a low density phase near 1060 K. More recent MD cooling studies confirm this observation.4,7,8 At the transition temperature of 1060 K, Hujo et al.4 observed a heat capacity maximum and a maximum in the rate of change of 4-coordinated particles in MD cooling simulations.4 Detailed structural analysis of amorphous SW-Si was performed by Luedtke and Landman.6 This investigation found 1061 K as the “effective temperature” (denoted as T4), below which the amorphous network ‘freezes’ in SW-Si, i.e., the mobility of the 4-coordinated particles is reduced significantly. This conclusion was based on analysis of the straight line regions (SLR) in potential energy distributions of 4-coordinated particles (see Fig. 16 of ref. 6). Sastry and Angell9 found a two orders of magnitude reduction in the diffusivity across the transition temperature of 1060 K, which was accompanied by an increase in the proportion of 4-coordinated particles from 50% to about 80% across the transition. The above studies suggest that there is a link between the cooperative behavior of the 4-coordinated particles and the transition observed at 1060 K.
In spite of the persistent interests in the liquid-amorphous transition of SW-Si, there are relatively few previous studies on the nature of the equilibrium of the liquid phase at or just above the transition temperature of 1060 K. Limmer and Chandler10,11 performed extensive computations of the reversible free energy surface of supercooled liquids, including SW-Si and several water models. These investigations suggested that there is a free energy minimum associated with the liquid state of SW-Si at or above 1060 K but no such minimum is associated with the low density amorphous phases formed after the relaxation of the supercooled liquid, which indicates that the amorphous phases are non-equilibrium phases. In previous work,12 the properties of the equilibrium liquid states of supercooled SW-Si at and above 1060 K and zero pressure were ascertained on the basis of the fact that the excess enthalpy (with respect to those of the crystal phase at the same temperature) of such states, together with the computed excess Gibbs free energies Ge, satisfy the Gibbs–Helmholtz equation within the computed error bars of Ge (see Table 1 of ref. 12).
Based on the computed enthalpies of equilibrium states in ref. 12, we find the heat capacities by numerically differentiating the enthalpy with respect to temperature using a central difference technique. Thus, the computed values of Cp/NkB are 29, 12.7 and 7 at 1062.5, 1067.5 and 1072.5 K, respectively. Note that since Cp values are obtained by numerical differentiation, these are highly sensitive to the estimated enthalpies of the equilibrium states.12 Nonetheless, these Cp values show the same qualitative trend, i.e., a sharp rise at 1060 K, as in an earlier investigation.4 In this work, we find a link between the supercooled liquid properties (including the rise of Cp near 1060 K) and the cooperative relaxation (freezing) of the 4-coordinated particles. In what follows, we first explain our methodology and the resulting data, followed by a detailed discussion on the nature of the equilibrium and the relaxation process of the supercooled liquid.
2 Methodology and the resulting data
In this work, we have performed isothermal–isobaric (NPT) Monte Carlo (MC) simulations of the supercooled liquid phase of SW-Si over the temperature range of 1060–1070 K at zero pressure. We used a cubic simulation box with periodic boundary conditions and different system sizes of 512, 4096, and 10![[thin space (1/6-em)]](https://www.rsc.org/images/entities/char_2009.gif) 648 particles. We also computed the changes in the largest network of 4-coordinated particles along the NPT-MC trajectories. At a given temperature, we initiated several NPT trajectories from arbitrarily selected configurations and generated, by trial and error, the longest possible trajectory in terms of MC steps (i.e., where the relaxation is delayed the most). As emphasized in the recent studies of Limmer and Chandler10,11 (on SW-Si and several water models), the equilibrium state in the supercooled region must be associated with a free energy minimum. Based on the entire length of the NPT-MC trajectory (including the portion of the trajectory after the relaxation), we located the local maximum (ϕm, ρm) of the probability distribution p(ϕ, ρ) generated by the trajectory. The point along the trajectory, beyond which the local probability maximum is not accessible, is marked as the R-point. We consider the trajectory upto the R-point to correspond to the supercooled equilibrium liquid. Just after the R-point, the cumulative distribution with respect to the potential energy develops a straight line region (SLR). We compute the correlation coefficient R2 of the straight line fit to the SLR and locate the point along the trajectory which gives the best possible value of R2 in the cumulative potential energy distribution. This point along the trajectory is marked as the SLR point. The importance of the SLR is discussed in Section 3.
648 particles. We also computed the changes in the largest network of 4-coordinated particles along the NPT-MC trajectories. At a given temperature, we initiated several NPT trajectories from arbitrarily selected configurations and generated, by trial and error, the longest possible trajectory in terms of MC steps (i.e., where the relaxation is delayed the most). As emphasized in the recent studies of Limmer and Chandler10,11 (on SW-Si and several water models), the equilibrium state in the supercooled region must be associated with a free energy minimum. Based on the entire length of the NPT-MC trajectory (including the portion of the trajectory after the relaxation), we located the local maximum (ϕm, ρm) of the probability distribution p(ϕ, ρ) generated by the trajectory. The point along the trajectory, beyond which the local probability maximum is not accessible, is marked as the R-point. We consider the trajectory upto the R-point to correspond to the supercooled equilibrium liquid. Just after the R-point, the cumulative distribution with respect to the potential energy develops a straight line region (SLR). We compute the correlation coefficient R2 of the straight line fit to the SLR and locate the point along the trajectory which gives the best possible value of R2 in the cumulative potential energy distribution. This point along the trajectory is marked as the SLR point. The importance of the SLR is discussed in Section 3.
To study the network formation along the trajectories, we traced the changes in the largest network of 4-coordinated particles. To trace the network, we used the following protocol: two particles are considered to be connected with each other if the distance between the particles is 1.4 or less (throughout this work, we use dimensionless quantities in terms of the SW potential2 parameters σ and ε). This distance closely corresponds to the first minimum of the radial distribution function of the crystalline phase. We compute the energy of each particle in the system using the protocol by Luedtke and Landman:6 the two body energy between a given pair of particles is assigned equally to each particle, while the individual terms in the three-body energy for a given triplet of particles are assigned to the particles at which the angles are centered. The total energy of a particle is obtained as a sum of the two-body and three-body energies of the particle. We computed the block averages of the per particle potential energy, 〈ϕ4C〉b, per particle 3-body energy, 〈ϕ3B4C〉b, and per particle 2-body energy 〈ϕ2B4C〉b of the network. The quantities ϕ4C, ϕ2B4C, and ϕ3B4C for a given configuration are computed as averages over the total energies, the two-body energies and the three-body energies, respectively, of the particles forming the largest 4-coordinated network in the given configuration. We also compute the root mean square (RMS) fluctuations of the 2-body energy of the network  . This quantity is a measure of the rigidity of the bonds connecting the network.
Using the methodology outlined above, data from 5 NPT-MC trajectories at zero pressure is presented in this work, as described below.
Data set (1): the data generated from the NPT-MC trajectory at T = 1060 K with N = 4096 particles are shown in Fig. 1–4. The average per particle potential energy and density (i.e., cumulative averages upto the R-point) for this trajectory are 〈ϕ〉 = −1.8270, and 〈ρ〉 = 0.4740. These are close to the corresponding values listed in Table 1 of ref. 12 for 1060 K: −1.8272 and 0.474.
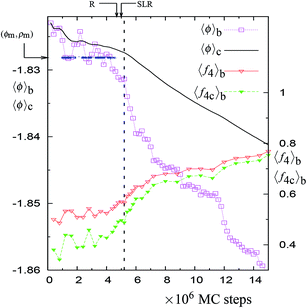 | ||
| Fig. 1 The NPT-MC trajectory at 1060 K with 4096 particles. The trajectory is shown in terms of block averages obtained after every 0.2 million MC steps. The solid black line shows the trajectory in terms of cumulative averages. The blue dotted line (indicated by horizontal arrow) denotes the points along the trajectory at which the minimum (ϕm, ρm) of the probability distribution is accessed. This minimum is located within the rectangular area formed by the points (ϕ, ρ) and (ϕ + Δϕ, ρ + Δρ), where ϕ = −1.8283, ρ = 0.4729, Δϕ = 3 × 10⁻⁴, and Δρ = 1.4 × 10⁻⁴. The point along the trajectories at which the straight line region is formed in the cumulative energy distribution (see Fig. 4) is denoted as ‘SLR’. The figure also shows block averages (taken over 0.2 million MC steps) of the fraction of particles in the largest 4-coordinated network f4C = N4C/N and the fraction of the 4-coordinated particles f4 = N4/N (please refer to the ordinate on the right hand side for these quantities). The vertical dashed line is the point of instability along the trajectory as explained in the text (see Fig. 2). | ||
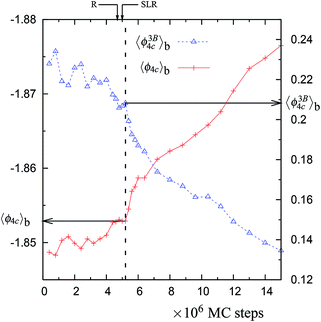 | ||
| Fig. 2 The block averages of the per particle potential energy ϕ4C and the per particle 3-body energy ϕ3B4C along the NPT-MC trajectory at 1060 K with 4096 particles (shown in Fig. 1). Both of these properties are for the largest network of 4-coordinated particles. Note that the axis for 〈ϕ4C〉b is inverted. The location of the vertical dashed line is decided as the point at which 〈ϕ3B4C〉b ≈ 0.21 and 〈ϕ4C〉b ≈ −1.853. The values corresponding to the vertical dashed lines (and indicated by horizontal arrows) are listed in Table 1. | ||
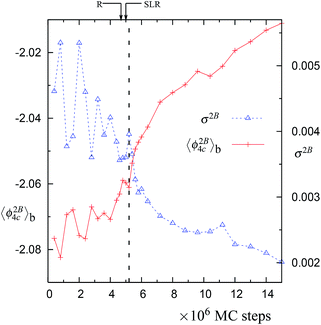 | ||
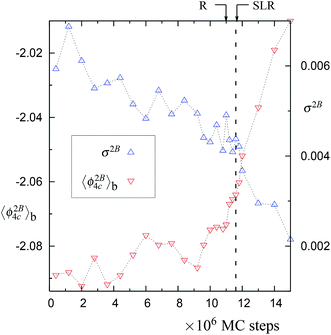
Fig. 3 The block averages of the per particle 2-body energy ϕ2B4C and RMS fluctuations in the 2-body energy,  . Both of these properties are for the largest network of 4-coordinated particles. The data is for the trajectory in Fig. 1 at 1060 K with N = 4096 particles. Note that just after the SLR point, σ2B shows a sharp irreversible decrease. . Both of these properties are for the largest network of 4-coordinated particles. The data is for the trajectory in Fig. 1 at 1060 K with N = 4096 particles. Note that just after the SLR point, σ2B shows a sharp irreversible decrease. | ||
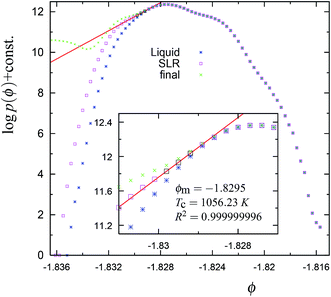 | ||
Fig. 4 The cumulative potential energy distributions for the trajectory in Fig. 1. The ordinate is obtained as log![[thin space (1/6-em)]](https://www.rsc.org/images/entities/char_2009.gif) NC(ϕ) = log NC(ϕ) = log![[thin space (1/6-em)]](https://www.rsc.org/images/entities/char_2009.gif) p(ϕ) + constant, where NC(ϕ) is the number of configurations along the trajectory with a per particle potential energy between ϕ and ϕ + Δϕ; Δϕ = 3 × 10⁻⁴ is the width of the bin. The blue stars represent the equilibrium liquid distribution, i.e., based on data collected from the trajectory upto the ‘R’ point (see Fig. 1). The intermediate distribution (denoted by pink square symbols) containing the straight line region (black squares) is obtained by the data collected from the trajectory upto the ‘SLR’ point (see Fig. 1). The ‘x’ (green) symbols represent the final cumulative distribution obtained from the trajectory upto 15 million MC steps. By final, we mean that the distribution is not expected to evolve further since after this the system is unlikely to visit the part of the phase space corresponding to the range of ϕ values in the above figure. The values of the correlation coefficient R2, the mid point of SLR region ϕm and the configurational (or effective) temperature TC of the SLR region (black squares) are given in the inset. Note that the equilibrium liquid distribution, at least approximately, is tangential to the straight line fit to the SLR. p(ϕ) + constant, where NC(ϕ) is the number of configurations along the trajectory with a per particle potential energy between ϕ and ϕ + Δϕ; Δϕ = 3 × 10⁻⁴ is the width of the bin. The blue stars represent the equilibrium liquid distribution, i.e., based on data collected from the trajectory upto the ‘R’ point (see Fig. 1). The intermediate distribution (denoted by pink square symbols) containing the straight line region (black squares) is obtained by the data collected from the trajectory upto the ‘SLR’ point (see Fig. 1). The ‘x’ (green) symbols represent the final cumulative distribution obtained from the trajectory upto 15 million MC steps. By final, we mean that the distribution is not expected to evolve further since after this the system is unlikely to visit the part of the phase space corresponding to the range of ϕ values in the above figure. The values of the correlation coefficient R2, the mid point of SLR region ϕm and the configurational (or effective) temperature TC of the SLR region (black squares) are given in the inset. Note that the equilibrium liquid distribution, at least approximately, is tangential to the straight line fit to the SLR. | ||
Data set (2): the data generated from the NPT-MC trajectory at T = 1065 K with N = 4096 particles are shown in Fig. 5–8. The average per particle potential energy and density (i.e., cumulative averages upto the R-point) for this trajectory are 〈ϕ〉 = −1.8222, and 〈ρ〉 = 0.4773. These are close to the corresponding values listed in Table 1 of ref. 12 for 1065 K: −1.8216 and 0.478.
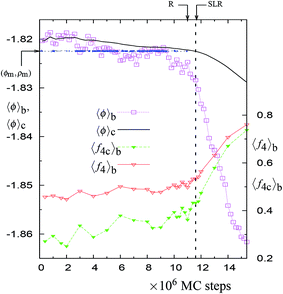 | ||
| Fig. 5 The NPT-MC trajectory at 1065 K with 4096 particles. All the symbols have the same meaning as explained in Fig. 1. The local maximum of the probability distribution p(ϕm, ρm) is located within the rectangular area formed by the points (ϕ, ρ) and (ϕ + Δϕ, ρ + Δρ), where ϕ = −1.8226, ρ = 0.4771, Δϕ = 3 × 10⁻⁴, and Δρ = 1.4 × 10⁻⁴. | ||
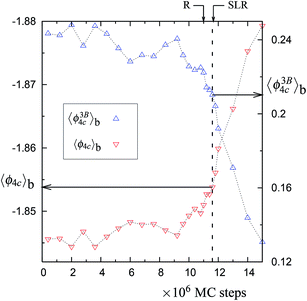 | ||
| Fig. 6 The same as in Fig. 2, but for the 1065 K trajectory with 4096 particles (see Fig. 5). See Table 1 of the main article for the values of 〈ϕ3B4C〉b and 〈ϕ4C〉b at the vertical dashed line (corresponding to the horizontal arrows in this figure). | ||
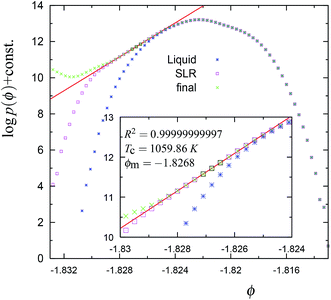 | ||
| Fig. 8 The cumulative potential energy distributions for the trajectory in Fig. 5. The symbols have the same meaning as explained in Fig. 4. Note that ϕm and TC for the SLR region are close to the equilibrium (average) values of the liquid phase, i.e., −1.8272 and 1060 K, respectively. | ||
Data set (3): the data generated from the NPT-MC trajectory at T = 1060 K with N = 10![[thin space (1/6-em)]](https://www.rsc.org/images/entities/char_2009.gif) 648 particles are shown in Fig. S1–S4 (ESI†). The average per particle potential energy and density (i.e., cumulative averages upto the R-point) for this trajectory are 〈ϕ〉 = −1.8271, and 〈ρ〉 = 0.4741. Again, this agrees well with the values listed in Table 1 of ref. 12 for 1060 K [see also data set (1)].
648 particles are shown in Fig. S1–S4 (ESI†). The average per particle potential energy and density (i.e., cumulative averages upto the R-point) for this trajectory are 〈ϕ〉 = −1.8271, and 〈ρ〉 = 0.4741. Again, this agrees well with the values listed in Table 1 of ref. 12 for 1060 K [see also data set (1)].
Data set (4): the data generated from the NPT-MC trajectory at T = 1060 K with N = 512 particles are shown in Fig. S5–S9 (ESI†) (this is the same trajectory as in Fig. 1 and 2 of ref. 12). The average per particle potential energy and density (i.e., cumulative averages upto the R-point) for this trajectory are 〈ϕ〉 = −1.8272, and 〈ρ〉 = 0.4740. These values agree well with cumulative averages (reported in Table 1 of ref. 12) computed upto the point beyond which the cumulative averages show a steady and continuous decrease.
Data set (5): the data generated from the NPT-MC trajectory at T = 1070 K with N = 512 particles are shown in Fig. S10–S14 (ESI†). The average per particle potential energy and density (i.e., cumulative averages upto the R-point) for this trajectory are 〈ϕ〉 = −1.8204, and 〈ρ〉 = 0.4784. The values listed in Table 1 of ref. 12 for 1070 K are −1.8195 and 0.479.
The following are the important common observations based on the above data.
There is a unique point along the trajectory across which there is a discontinuity (i.e. a sudden increase) in the rate of changes of 〈f4〉b, 〈f4C〉b, 〈ϕ〉b, 〈ϕ4C〉b, 〈ϕ3B4C〉b, and 〈ϕ2B4C〉b. This point is called a dynamically unstable point. The point corresponds to the condition that the block averages 〈ϕ4C〉b and 〈ϕ3B4C〉b have specific values, i.e., 〈ϕ4C〉b ≈ −1.853 and 〈ϕ3B4C〉b ≈ 0.21 (see Table 1). The specific point is found to be independent of the temperature, suggesting a mechanical cause for the relaxation. Also this point coincides with the maxima in the rate of change (in an irreversible manner) of the number of 4-coordinated particles and of the overall potential energy of the system along the trajectory (see Fig. 1, 5, S1, S5, and S10†). This indicates that the relaxation process at a given temperature (just above 1060 K) is similar to the observed changes in the MD cooling experiments across 1060 K.4
| T (K) | N | 〈ϕ4C〉b | 〈ϕ3B4C〉b | 〈f4C〉b | 〈f4〉b |
|---|---|---|---|---|---|
| 1060 | 512 | −1.8542 | 0.2098 | 0.476 | 0.551 |
| 1070 | 512 | −1.8519 | 0.2099 | 0.487 | 0.560 |
| 1060 | 4096 | −1.8529 | 0.2083 | 0.488 | 0.565 |
| 1065 | 4096 | −1.8527 | 0.2128 | 0.433 | 0.534 |
| 1060 | 10![[thin space (1/6-em)]](https://www.rsc.org/images/entities/char_2009.gif) 648 648 |
−1.8522 | 0.2136 | 0.435 | 0.535 |
The second important observation is that the cumulative potential energy distribution upto the R-point, is tangential to the SLR which eventually appears in the cumulative distributions (Fig. 4, 8, S4, S9, and S14†). Further, whenever the configurational temperature corresponding to the SLR approaches 1060 K, the mid-point of the SLR region approaches −1.827, which is the equilibrium (i.e., cumulative average upto the R-point) energy of the supercooled liquid at 1060 K. For the 512 particle trajectories at 1060 K and 1070 K, there are two SLRs which simultaneously appear with different configurational temperatures (see Fig. S9 and S14 of the ESI†). In these cases, the SLR with a configurational temperature close to 1060 K is more relevant for the relaxation of the supercooled liquid, since it is tangential to the supercooled liquid distribution (cumulative distribution upto the R-point).
The third observation concerns the equilibrium properties of the supercooled liquids. We find that the cumulative average potential energy and density computed upto the R-point in all five trajectories is found to be in close agreement with the equilibrium properties listed in Table 1 of ref. 12. Note that data set (4) corresponds to the same trajectory as in ref. 12. The criteria used in ref. 12 to identify the relaxation point was: it is a point beyond which the cumulative averages show a continuous decrease. This criteria yields the same average values as those based on the probability maximum criteria used in the current work [see the values listed under data set (4) above]. However, the cumulative averaged based criteria (used in ref. 12) for identifying the relaxation point works only for a smaller system size, i.e. 512 particle system. In general, the local probability maximum criteria should be used.
3 Equilibration and the relaxation of the supercooled states
In normal metastable liquids, the system can explore all possible microstates in and around the metastable basin and the basin shape is thus well defined. The term local relaxation refers to the process where fluctuations away from the metastable basin equilibrate towards the basin, i.e., the system returns to the bottom of the basin. In the case of supercooled SW-Si, the system cannot explore all possible microstates due to the freezing process (as explained below) and hence it must be regarded as a constrained equilibrium state. Therefore, the concepts of local relaxation and relaxation time (as applied for the normal metastable liquids) are not applicable in the case of supercooled SW-Si. Before we discuss the nature of equilibrium of the supercooled liquid states in more detail, we first discuss the importance of the SLR and the configurational temperature of the SLR, which we term as the effective temperature.From a dynamical point of view, the changes along the NPT-MC trajectories occur such that after the SLR point there is a sharp irreversible decrease of  , which shows a tightening of the bonds of the network. However, before σ2B shows a sharp decrease, a brief period (between the R and SLR points) appears at which σ2B stabilizes (see Fig. 3 and 7) and attains a minimum value with respect to the values before the R-point. It is also notable that the unique mechanical states of the network (see Table 1), across which the system shows sharp irreversible changes in the potential energy, occur close to the SLR point. This indicates that the potential energy changes of the entire system are correlated with the changes in the 4-coordinated network close to the SLR point.
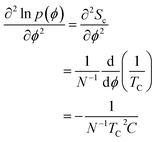
We now discuss the importance of the configurational temperature of the SLR point, which we term as the effective temperature. The concept of effective temperatures is based on fluctuation–dissipation relations.13–15 For systems near equilibrium, when the concept of effective temperature is applicable, there are two time scales associated with the system.14,15 The effective temperature is usually associated with fluctuations of slower modes, while the bath temperature is associated with fluctuations of fast-modes. Based on these previous studies and the current data, we propose that the effective temperature close to 1060 K is associated with the long-wavelength fluctuations (slow-modes), i.e. the potential energy fluctuation resulting from the large-scale diffusion of particles. On the other hand, the energy fluctuations resulting from the particles vibrating around their average positions are fast-modes, and are associated with the bath temperature. Based on effective temperature definition provided by Ono et al.,14 we propose that the effective temperature associated with the freezing of the network may be defined as follows:
| N−1kBTC2C = 〈(δϕ)2〉s | (1) |
 | (2) |
Expressing the left hand side of eqn (1) in terms of the curvature of the potential energy distributions, we get the following expression.
 | (3) |
After the R-point, as the curvature in the SLR approaches zero,  at ϕ = ϕm, according to our proposed relation in eqn (3) the long-wavelength fluctuations approach infinity 〈(δϕ)2〉s → ∞. This means that longer time-scale fluctuations are not defined, i.e., cease to exist, as the curvature approaches zero at ϕ = ϕm just after the R-point. The following observations based on the data support this assertion. (i) We note that after the R-point, the cumulative potential energy distribution is tangential to the SLR (see Fig. 4, 8, S4, S9, and S14†). This condition implies that there are no significant potential energy fluctuations observed above the SLR, as the trajectory evolves from the R to the SLR point. Moreover, the fluctuations are increasingly biased towards potential energies below the SLR, as the curvature at ϕ = ϕm increases towards zero. This increased bias towards lower energies is also obvious from the irreversible decrease in the block average potential energies after the R-point (see Fig. 1, 5, S1, S6, and S11†). Hence the long-wavelength fluctuations cannot be defined due to a monotonic and irreversible decrease of the energy across the R-point. (ii) The fluctuations in the 2-body energies attain a minimum value at the R-point with respect to the values before the R-point. This signals the onset of the freezing process of the network (see Fig. 3, 7 and S3†). The particles in the network can no longer undergo large scale diffusion due to the initiation of the tightening process of the bonds after the R-point. We note that our suggestion about the vanishing of the long-wavelength fluctuations (resulting from large scale diffusion) after the R-point (i.e., as the SLR is formed) is consistent with the analysis of Luedtke and Landman.6 These authors described 1061 K as the effective temperature for freezing of the 4-coordinated particles, i.e. the temperature below which the large-scale diffusion of the 4-coordinated particles is no longer possible.6
The SLR and the configurational temperature TC at its mid-point ϕm are transient features of the cumulative distribution, since the curvature at the SLR and the TC may change as the system evolves further (see Fig. 4, 8, S4, S9, and S14†). However, we find that in all trajectories, dynamical instability occurs close to the SLR point and σ2B shows a sharp irreversible decrease (see Fig. 3, 7, S3, S8, and S13†). This shows that the SLR is associated with the dynamical instability that leads to the freezing of the 4-coordinated network. We find that at T = 1060 K, there are unique (independent of system size) values of TC and ϕm for the SLR. The configurational temperature corresponding to the SLR (also called the effective temperature) is found to be TC ≈ 1056 K and the mid-point of the SLR is found to be at ϕm ≈ −1.829 for the 1060 K trajectories using N = 512, 4096, and 10![[thin space (1/6-em)]](https://www.rsc.org/images/entities/char_2009.gif) 648 particles (see Fig. 4, S4, and S9†). At higher temperatures 1065 K (with N = 4096 particles) and 1070 K (N = 512 particles) the value of the effective temperature is found to be TC ≈ 1060 K (see Fig. 8 and S14†). Moreover the mid-point of the SLR also has the unique value of ϕm ≈ −1.827, which matches closely with the equilibrium per particle potential energy of the supercooled liquid at 1060 K. Hence our numerical data suggests that the SLR is associated with the dynamical instability and is well defined, i.e., TC and ϕm have unique values at a given T, P, and N.
648 particles (see Fig. 4, S4, and S9†). At higher temperatures 1065 K (with N = 4096 particles) and 1070 K (N = 512 particles) the value of the effective temperature is found to be TC ≈ 1060 K (see Fig. 8 and S14†). Moreover the mid-point of the SLR also has the unique value of ϕm ≈ −1.827, which matches closely with the equilibrium per particle potential energy of the supercooled liquid at 1060 K. Hence our numerical data suggests that the SLR is associated with the dynamical instability and is well defined, i.e., TC and ϕm have unique values at a given T, P, and N.
Based on the simulation data, we propose that the supercooled liquid state is a constrained equilibrium state, i.e., the Gibbs free energy of the supercooled liquid is given by G = G(T, P, N, Xeq), where Xeq are the equilibrium (average) properties at a given T, P, and N. These average properties are considered to be constraints since these are determined by the inherent tendency of the system to approach the dynamical instability point. Our simulation data indicates that there exists a maximum possible length (τ) of the trajectory at a given T, P and N, before the onset of the freezing process, i.e., before the instability is approached. Our trajectories at 1060 K show that τ decreases with an increase in the system size from N = 512 to 10![[thin space (1/6-em)]](https://www.rsc.org/images/entities/char_2009.gif) 648 particles. Further, τ decreases with a decrease in the temperature T. A systematic study of dependence of τ on both T and N is desirable. However it would require an enormous computational effort which involves generating the longest NPT-MC trajectories, by trial and error, for a range of values of T and N. Hence we have not pursued it in this work.
648 particles. Further, τ decreases with a decrease in the temperature T. A systematic study of dependence of τ on both T and N is desirable. However it would require an enormous computational effort which involves generating the longest NPT-MC trajectories, by trial and error, for a range of values of T and N. Hence we have not pursued it in this work.
Can this constrained equilibrium state be regarded as a non-equilibrium or a glassy state? The answer is no for the following reasons. (i) Unlike non-equilibrium states, the properties of the supercooled liquid are uniquely determined and correspond to the longest possible trajectories at a given T and N, i.e., the trajectories in which the approach to the instability is delayed the most. Further, the equilibrium properties at 1060 K are found to be independent of the system size, i.e., the average properties agree well for N = 512, 4096, and 10![[thin space (1/6-em)]](https://www.rsc.org/images/entities/char_2009.gif) 648 particle trajectories. (ii) As shown in ref. 12, the supercooled liquid properties obey the Gibbs–Helmholtz relation, at least, within the computed error bars of the free energy calculations (see Table 1 of ref. 12). The term glassy state can however be applied to the system after the R-point, i.e., after the onset of the freezing process. This freezing process leads to a sharp irreversible decrease in σ2B, indicating the tightening of the bonds, which is expected to prevent the large-scale diffusion of the particles in the network, a characteristic feature of a glass.
648 particle trajectories. (ii) As shown in ref. 12, the supercooled liquid properties obey the Gibbs–Helmholtz relation, at least, within the computed error bars of the free energy calculations (see Table 1 of ref. 12). The term glassy state can however be applied to the system after the R-point, i.e., after the onset of the freezing process. This freezing process leads to a sharp irreversible decrease in σ2B, indicating the tightening of the bonds, which is expected to prevent the large-scale diffusion of the particles in the network, a characteristic feature of a glass.
Our results compare well with the phenomenology associated with glass forming or jamming systems, as explained in the work by Pastore et al.16 (we thank one of the reviewers for referring us to this work). This study is concerned with the relation between the relaxation time of the glass-forming liquids with the time ( ) required to achieve a maximum value of the dynamical susceptibility χ*4, which can be equated to the number of dynamically correlated particles in the system.16 In the case of supercooled SW-Si, the size of the 4-coordinated cluster (at the R-point) can be considered as the number of dynamically correlated particles. Based on our data, it appears that the constrained equilibrium liquid state corresponds to the condition that
  , i.e., the trajectory with a maximum length (where the approach towards the instability point is delayed the most) also yields the maximum value (compared with the shorter trajectories) of χ4 (= χ*4) at the R-point. However, in order to understand the mechanism about why the two time-scales are related, we need to quantify the dynamical susceptibility χ4, and this is beyond the scope of the present work. In this work, we are mainly focused on equilibrium properties of the supercooled liquid states.
Having discussed the effective temperature and the nature of equilibrium of the supercooled liquid state at 1060–1070 K, we now turn to the importance of the dynamical instability point (see Table 1) found in our data. This instability occurs close to the point where the SLR is formed in the cumulative energy distributions. The ‘near-equilibrium’ condition (discussed in the context of the effective temperature for steady-state driven systems13–15) is probably associated with the condition that the liquid state is in the vicinity of this dynamical instability point in the configurational space. This is consistent with the conclusion of Ono et al. that “the concept effective temperature should be useful for any system near the onset of jamming” (see page 095703–4 of ref. 14). From a dynamical view point, the system exhibits non-deterministic dynamics due to coupling with the heat-bath. For a non-deterministic (or a chaotic) system, the instabilities are governed by the Lyapunov exponents. It is conceivable that the instability is associated with the Lyapunov exponent of the system crossing the zero value. However, in this work we do not compute the Lyapunov exponent and the associated dynamics and we leave it for a future study. If the system is simulated in the NPH ensemble starting from a liquid phase configuration (as was done in ref. 9), a decrease in the potential energy of the system would be necessarily accompanied by an increase in the kinetic energy (i.e., an increase in the internal temperature) in order to maintain the total energy constant (note that H = E at P = 0). On the other hand, in the NPT ensemble, a decrease in the potential energy occurs at a constant temperature. Hence the equilibrium liquid states simulated in the NPT ensemble (as in the present case) in the temperature range of 1060–1070 K would be inaccessible in the NPH ensemble due to the expected differences in the dynamical evolution of the system in the two ensembles, when starting from a liquid phase configuration.
4 Summary
In this work, we examined the nature of equilibrium of the supercooled liquid state in the temperature range of 1060–1070 K at zero pressure. By trial and error, we generated the longest possible NPT-MC trajectories for a given T and N. The equilibrium liquid state properties were computed based on the portion of the trajectory (upto the R-point) associated with the local minimum of the Gibbs free energy distribution (or equivalently the local maximum of the probability distribution) with respect to the energy and the density. The cumulative potential energy distribution (upto the R-point) is found to be tangential to the SLR that eventually forms. This tangential condition coincides with the onset of the freezing process, i.e., the RMS fluctuations of the two-body energy σ2B attains a minimum value (with respect to the values before the R-point), indicating that large scale excursions of the particles in the network are no longer possible. The cumulative average properties upto the R-point are found to be close to the equilibrium values reported in earlier work based on free energy computations.12 Further, these average properties are found to be independent of the system size at 1060 K (for N = 512, 4096, and 10![[thin space (1/6-em)]](https://www.rsc.org/images/entities/char_2009.gif) 648 particle trajectories), as is expected for the equilibrium states.
648 particle trajectories), as is expected for the equilibrium states.
We find that in all trajectories, there is a sudden change in the overall potential energy and density of the system when the 4-coordinated network approaches a unique mechanical state (independent of T and N) along the trajectory, where 〈ϕ4C〉b ≈ −1.853 and 〈ϕ3B4C〉b ≈ 0.21. Across this point, there is a discontinuity, i.e., a sudden acceleration in the changes of 〈f4〉b, 〈f4C〉b, 〈ϕ〉b, 〈ϕ4C〉b, 〈ϕ3B4C〉b, and 〈ϕ2B4C〉b. This is also accompanied by a sharp irreversible decrease in σ2B, indicating a sudden increase in the rigidity of the bonds joining the 4-coordinated network. Due to the observed discontinuities in the rate of change of these quantities across this unique mechanical state, we call it a dynamical instability point. It is interesting to note that the occurrence of the instability along the trajectory closely coincides with the formation of the SLR with a configurational temperature close to 1060 K.
Our simulation data suggests that due to the presence of the dynamical instability, the maximum possible lifetime (τ) of the supercooled liquid state at a given T, P and N is limited. Our data indicates that the longest trajectory (with length ≈ τ) at a given T, P and N yields the unique average (i.e. equilibrium) values of per particle potential energy and density. The supercooled liquid state (at or just above 1060 K) must, then, be regarded as a constrained equilibrium state since the accessible microstates are constrained by the inherent tendency of the system to approach the dynamical instability point. Hence, we conclude that the equilibrium state properties (at or just above 1060 K), including the rise in Cp at 1060 K, can be attributed to the freezing tendency of the 4-coordinated amorphous network. We would like to add that below the melting temperature (≈1678 K), but much above 1060 K, the supercooled liquid SW-Si can still be considered as a metastable equilibrium state if the dynamical evolution towards low density amorphous states does not dominate the crystal nucleation process.
At 1060 K, we find that the effective temperature (i.e., configurational temperature at the SLR) and the mid-point of the SLR have the unique values TC ≈ 1056 K and ϕm ≈ −1.829, i.e., independent of the system size for N = 512, 4096, and 10![[thin space (1/6-em)]](https://www.rsc.org/images/entities/char_2009.gif) 648 particle trajectories. For 1065 K and 1070 K trajectories we find TC ≈ 1060 K and ϕm ≈ −1.827, which are the equilibrium values for the supercooled state at 1060 K. Thus our simulation data suggests that both the properties of the SLR, TC and ϕm, have unique values at a given T, P, and N. It is notable that these values of TC are close to 1061 K, which was identified by Luedtke and Landman6 as the effective temperature below which significant atomic mobility of the 4-coordinated particles is not possible. In the case of steady-state driven systems, such as sheared foam, the concept of effective temperature has been used extensively.13–15 These previous studies suggest that systems where the effective temperature is relevant exhibit two time scales. The effective temperature is associated with fluctuations on longer time scales (slow-modes) while the bath temperature is associated with fluctuations on shorter time scales (fast-modes). Hence we propose that for supercooled SW-Si, the effective temperature is associated with fluctuations resulting from large-scale diffusion of particles [see eqn (1)–(3)]. After the initiation of the freezing process (R-point), as the SLR is formed, the long-wavelength fluctuations cease to exist. In order to make the link with the SLR more quantitative, the measurement of the long-wavelength fluctuations is essential and we will do this in a future study.
648 particle trajectories. For 1065 K and 1070 K trajectories we find TC ≈ 1060 K and ϕm ≈ −1.827, which are the equilibrium values for the supercooled state at 1060 K. Thus our simulation data suggests that both the properties of the SLR, TC and ϕm, have unique values at a given T, P, and N. It is notable that these values of TC are close to 1061 K, which was identified by Luedtke and Landman6 as the effective temperature below which significant atomic mobility of the 4-coordinated particles is not possible. In the case of steady-state driven systems, such as sheared foam, the concept of effective temperature has been used extensively.13–15 These previous studies suggest that systems where the effective temperature is relevant exhibit two time scales. The effective temperature is associated with fluctuations on longer time scales (slow-modes) while the bath temperature is associated with fluctuations on shorter time scales (fast-modes). Hence we propose that for supercooled SW-Si, the effective temperature is associated with fluctuations resulting from large-scale diffusion of particles [see eqn (1)–(3)]. After the initiation of the freezing process (R-point), as the SLR is formed, the long-wavelength fluctuations cease to exist. In order to make the link with the SLR more quantitative, the measurement of the long-wavelength fluctuations is essential and we will do this in a future study.
Since the instability point is found to be independent of the temperature (see Table 1), similar changes in the 4-coordinated network (in particular the instability) are expected to occur across 1060 K in MD cooling simulations. Indeed, the MD cooling experiments4,9 show a sudden increase in the fraction of 4-coordinated particles across 1060 K, as well as a 2-order of magnitude decrease in the diffusivity.9 Such changes are most likely due to the instability point (identified in this work) that leads to the freezing of the network. When seen in the general context of order–disorder or λ-transitions, our results highlight the important role of the effective temperature and the cooperativity (which are intrinsic properties of the system) in such transitions.
Acknowledgements
This work was supported by the young scientist scheme of the Department of Science and Technology, India.References
- K. Denbigh, The Principles of Chemical Equilibrium, Cambridge university press, Cambridge, 4th edn, 1981 Search PubMed.
- F. H. Stillinger and T. A. Weber, Phys. Rev. B: Condens. Matter Mater. Phys., 1985, 31, 5262–5271 CrossRef CAS.
- N. Jakse, A. Pasturel, S. Sastry and C. A. Angell, J. Chem. Phys., 2009, 130, 247103 CrossRef.
- W. Hujo, B. S. Jabes, V. K. Rana, C. Chakravarti and V. Molinero, J. Stat. Phys., 2011, 145, 293–312 CrossRef CAS.
- W. D. Luedtke and U. Landman, Phys. Rev. B: Condens. Matter Mater. Phys., 1988, 37, 4656–4663 CrossRef CAS.
- W. D. Luedtke and U. Landman, Phys. Rev. B: Condens. Matter Mater. Phys., 1989, 40, 1164–1174 CrossRef CAS.
- P. Beaucage and N. Mousseau, J. Phys.: Condens. Matter, 2005, 17, 2269–2279 CrossRef CAS.
- V. V. Vasisht, S. Saw and S. Sastry, Nat. Phys., 2011, 7, 549–553 CrossRef CAS.
- S. Sastry and C. A. Angell, Nat. Mater., 2003, 2, 739–743 CrossRef CAS PubMed.
- D. T. Limmer and D. Chandler, J. Chem. Phys., 2011, 135, 134503 CrossRef PubMed.
- D. T. Limmer and D. Chandler, J. Chem. Phys., 2013, 138, 214504 CrossRef PubMed.
- P. A. Apte and A. K. Gautam, J. Stat. Phys., 2012, 149, 551–567 CrossRef CAS.
- S. A. Langer and A. J. Liu, Europhys. Lett., 2000, 49, 68–74 CrossRef CAS.
- I. K. Ono, C. S. O'Hern, D. J. Durian, S. A. Langer, A. J. Liu and S. R. Nagel, Phys. Rev. Lett., 2002, 89, 095703 CrossRef PubMed.
- C. S. O'Hern, A. J. Liu and S. R. Nagel, Phys. Rev. Lett., 2004, 93, 165702 CrossRef PubMed.
- R. Pastore, M. P. Ciamarra, A. de Candia and A. Coniglio, Phys. Rev. Lett., 2011, 107, 065703 CrossRef PubMed.
Footnote |
| † Electronic supplementary information (ESI) available. See DOI: 10.1039/c5ra04892c |
| This journal is © The Royal Society of Chemistry 2015 |

