Chemical synthesis and characterization of dodecylbenzene sulfonic acid-doped polyaniline/viscose fiber
Ning
Wang
*a,
Guodong
Li
a,
Xingxiang
Zhang
a and
Xiaoling
Qi
b
aTianjin Municipal Key Lab of Fiber Modification and Functional Fiber, School of Material Science and Engineering, Tianjin Polytechnic University, Tianjin 300389, China. E-mail: wangntjpu@hotmail.com; Tel: +86 22 83955816
bAviation Key Laboratory of Science and Technology on Aeronautical Life-Support, Aerospace Life-Support Industries, Xiangyang, 441003, China
First published on 12th May 2015
Abstract
A dodecylbenzene sulfonic acid (DBSA) doped-polyaniline (PANI) coated conductive viscose fiber (VCF) was prepared by chemical oxidation polymerization in an ethanol/water solution. Fourier transform infrared spectra (FTIR) and XPS proved that an interaction between PANI and VCF formed in the PANI/VCF composites. The mild treatment did not result in the oxidation and degradation of VCF detected by thermal gravimetric analysis (TGA) and mechanical testing. Moreover, the influence of the reaction conditions including reaction time, aniline monomer (ANI) concentration, ammonium persulfate (APS) concentration and DBSA concentration on the morphology and the conductivity of the PANI/VCF composites were investigated in detail. The orthogonal experiments were designed to determine the optimal reaction conditions as follows: ethanol/water ratio (30/70), reaction time (18 h), ANI concentration (0.1 mol L−1), APS concentration (0.125 mol L−1) and DBSA concentration (0.1 mol L−1). When the PANI/VCF composite was washed 40 times in water, the conductivity still remained at 2.5 × 10⁻² S cm−1, and this value was stable for more washing.
Introduction
A class of polymers, called intrinsically conducting polymers, has been extensively studied because of their interesting electrical properties.1–4 They have a large number of applications such as light emitting display devices, energy conversion, corrosion protection, supercapacitors, and sensors, etc.5–10 Among them, polyaniline (PANI) is one of the most promising conducting polymers because of its unique properties, its ease of preparation, and excellent environmental stability.6,7 However, the low solubility, poor mechanical properties and the fabrication difficulty limit the application of PANI.11,12 Compared with inorganic acid, organic acids containing large alkyl groups not only have high thermal stability, but also can improve the melting and solution processability of PANI.11 Among these functionalized organic acids, dodecylbenzene sulfonic acid (DBSA) is the most used. A stoichiometric mixture of aniline monomer (ANI) and DBSA reacts to form a fine stable dispersion of PANI in the aqueous medium. In this case DBSA acts simultaneously as dopant and surfactant and, in the end product, there will be two kinds of DBSA: DBSA linked to the PANI backbone acting as dopant and free DBSA (in excess) acting as plasticizer.11–13Moreover, template synthesis of PANI composites is an effective method to improve the processability of PANI.14–19 Up to now several templates have been used, including inorganic template, synthetic polymer template and biomacromolecule template. Hybrid nanocomposites containing carbon nanotubes and ordered PANI have been prepared through an in situ polymerization reaction using a single-walled nanotube as template and ANI as reactant. The nanocomposites showed both higher electrical conductivity and Seebeck coefficient as compared to pure PANI.14 Graphite oxide and ordered PANI composites have been prepared through an in situ polymerization.15 The electrospun polyimide nanofiber membranes have been used as the template for chemical oxidation growth of PANI by using FeCl3 as the oxidant. PANI nanoparticles were uniformly distributed on the surface of highly aligned polyimide nanofibers.16 PANI coated conductive paper was prepared by chemical oxidation polymerization of ANI and a two-step process.17 Conducting composite membranes of bacterial cellulose and PANI doped with DBSA were successfully prepared by the chemical oxidation polymerization in the presence of hydrated bacterial cellulose sheets which provided a new way to prepare cellulose–PANI conducting membranes.18 PANI/sodium carboxymethyl cellulose nanorods have been synthesized via chemical oxidation polymerization of ANI in the presence of sodium carboxymethyl cellulose as a polymerization template.19
In this work, we have synthesized DBSA-doped PANI on the surface of viscose fiber (VCF) to prepare the conductive PANI/VCF composites in a mixed solution of ethanol and water. An ethanol/water (30![[thin space (1/6-em)]](https://www.rsc.org/images/entities/char_2009.gif) :
:![[thin space (1/6-em)]](https://www.rsc.org/images/entities/char_2009.gif) 70, v/v) solution was used as solvent for synthesis and washing, reducing purification time and residue volume. The orthogonal experiments were designed to determine the optimal reaction conditions. PANI composites have expanded the applications of PANI. What's more, the applications of PANI composites have also been reported.20–23 DBSA-doped PANI/VCF composites have potential use in novel functional fiber and fabric applications, including anti-static and electromagnetic shielding fabric, electrical resistive heating fabric, intellectual fabric, fiber with electrochromic and redox properties, anti-bacterial fiber, and new functional packaging materials.
70, v/v) solution was used as solvent for synthesis and washing, reducing purification time and residue volume. The orthogonal experiments were designed to determine the optimal reaction conditions. PANI composites have expanded the applications of PANI. What's more, the applications of PANI composites have also been reported.20–23 DBSA-doped PANI/VCF composites have potential use in novel functional fiber and fabric applications, including anti-static and electromagnetic shielding fabric, electrical resistive heating fabric, intellectual fabric, fiber with electrochromic and redox properties, anti-bacterial fiber, and new functional packaging materials.
Experimental
Materials
ANI (Tianjin GuangFu Chemical Co., China) was distilled under reduced pressure. APS was provided by Tianjin GuangFu science and technology development Co., China. VCF was provided by Xinxiang Bailu Hua Xian Group Co., LTD., China. All solutions were prepared in deionized water. The other reagents were in analytical grade.Preparation of PANI/VCF composites
VCF was soaked in acetone solution, sonicated for 30 min, washed with water, and then dried at 60 °C for 12 h in vacuum. VCF was added into the DBSA solution. ANI was added into the DBSA ethanol/water solution, and then stirred for 1 h. The ratio of ethanol and water was 30![[thin space (1/6-em)]](https://www.rsc.org/images/entities/char_2009.gif) :
:![[thin space (1/6-em)]](https://www.rsc.org/images/entities/char_2009.gif) 70 (v/v). Ammonium persulfate (APS) solution was added dropwise into the above system. The reaction proceeded at 0 °C. The reaction products were filtrated and washed successively with acetone and deionized water until the filtrate become colorless, and then dried at 60 °C for 24 h in vacuum to obtain PANI/VCF composites.
70 (v/v). Ammonium persulfate (APS) solution was added dropwise into the above system. The reaction proceeded at 0 °C. The reaction products were filtrated and washed successively with acetone and deionized water until the filtrate become colorless, and then dried at 60 °C for 24 h in vacuum to obtain PANI/VCF composites.
Structural characterizations
FTIR were recorded with a resolution of 4 cm−1 in the method of attenuated total reflection by using a Thermo Nicolet Nexus. XPS measurements were performed by using K-alpha, ThermoFisher, equipped with an Al Kα radiation source (1486.6 eV). The XPS spectra data was accomplished with the software XPSPEAK4.1. The morphologies of the composites were characterized using a Hitachi S-4800 scanning electron microscope (SEM). They were mounted on aluminum specimen stubs with double-sided adhesive tape and sputter coated with a 20 nm thick gold layer in rarefied argon, using an Emitech K 550 Sputter Coater, with a current of 20 mA for 180 s. In the conductivity testing, the samples were pressed into pellet under 26 MPa for 15 minutes.Properties measurements
TGA curves were obtained in Universal V3.8 B equipment from TA-Instruments. VCF, PANI and PANI/VCF composites were heated in open alumina pans from 30 to 800 °C, under a nitrogen atmosphere, at a heating rate of 15 °C min−1. Tensile strengths of both VCF and PANI/VCF were tested at room temperature and with a speed of 10 mm min−1 with Fibre Strength Tester. The conductivity was measured at room temperature by a programmable DC voltage/current detector (four-probe method). Each data shown here was the mean value of the measurement from at least three samples. In the testing of washing resistance, the composites were stirred in water by a magnetic stirrer at room temperature for 1 h, and dried at 50 °C. This process was repeated for several times for conductivity testing. The PANI content was tested by measuring the weight of VCF. The weights of VCF before reaction and after reaction were measure, respectively. The VCF was dried at 50 °C before measuring the weight. It was calculated as eqn (1). | (1) |
Results and discussion
Characterization of PANI/VCF composites
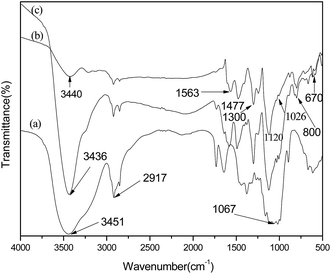
The FTIR spectra of VCF, PANI and PANI/VCF composite were shown in Fig. 1. For VCF, the strong bands at 3451 and 2917 cm−1 were originated from the absorption of hydroxyl groups and the C–H stretching of CH2, respectively. A strong band at 1067 cm−1 corresponded to the C–O–C pyranose ring skeletal vibration.24 The DBSA-doped PANI powder FTIR spectra showed that the absorption peaks at 1563 and 1477 cm−1 correspond to the N![[double bond, length as m-dash]](https://www.rsc.org/images/entities/char_e001.gif) B
B![[double bond, length as m-dash]](https://www.rsc.org/images/entities/char_e001.gif) N (quinoid) and N–A–N (benzene) stretching vibration in PANI.25 The absorption peak intensity of the quinone ring and benzene ring showed the content of oxide structure (quinoid structure) and reducted structure, representing the degree of oxidation of PANI. The absorption peak of 1300 and 1120 cm−1 correspond to C–N and C–H stretching vibration peak in the benzene ring. Absorption peak at 807 cm−1 correspond to C–H in-plane bending vibration peak of the benzene rings. Caused by the DBSA O
N (quinoid) and N–A–N (benzene) stretching vibration in PANI.25 The absorption peak intensity of the quinone ring and benzene ring showed the content of oxide structure (quinoid structure) and reducted structure, representing the degree of oxidation of PANI. The absorption peak of 1300 and 1120 cm−1 correspond to C–N and C–H stretching vibration peak in the benzene ring. Absorption peak at 807 cm−1 correspond to C–H in-plane bending vibration peak of the benzene rings. Caused by the DBSA O![[double bond, length as m-dash]](https://www.rsc.org/images/entities/char_e001.gif) S
S![[double bond, length as m-dash]](https://www.rsc.org/images/entities/char_e001.gif) O stretching vibration peak appeared in the 1300 cm−1, S–O stretching vibration peak appeared in the 670 cm−1, between DBSA and PANI chain formed NH+⋯SO3− absorption peak appeared at 1026 cm−1.18 Hence, these FTIR spectra correspond to well-doped PANI. The characteristic peak of VCF and PANI could be detected in Fig. 1c. It indicated that PANI was well coated on the surface of VCF. It also could be detected by SEM. Moreover, the character peaks related to hydrogen bond, such as hydroxyl groups (at 3451 cm−1) in VCF and NH stretching vibration (at 3440 cm−1) in PANI, shifted blue to 3436 cm−1 in PANI/VCF composites. It revealed that the interaction formed due to the intermolecular hydrogen bonds between VCF and PANI.26
O stretching vibration peak appeared in the 1300 cm−1, S–O stretching vibration peak appeared in the 670 cm−1, between DBSA and PANI chain formed NH+⋯SO3− absorption peak appeared at 1026 cm−1.18 Hence, these FTIR spectra correspond to well-doped PANI. The characteristic peak of VCF and PANI could be detected in Fig. 1c. It indicated that PANI was well coated on the surface of VCF. It also could be detected by SEM. Moreover, the character peaks related to hydrogen bond, such as hydroxyl groups (at 3451 cm−1) in VCF and NH stretching vibration (at 3440 cm−1) in PANI, shifted blue to 3436 cm−1 in PANI/VCF composites. It revealed that the interaction formed due to the intermolecular hydrogen bonds between VCF and PANI.26
Fig. 2 showed the C1s, O1s, N1s, S2p core-level spectra and the relative binding energy (BE) for VCF and PANI/VCF composite, respectively. The chemical compositions of VCF and PANI/VCF composite were also listed in Table 1. It could be found that the O/C ratio of PANI/VCF composite decreased, which was attributed to the deposition of PANI. Moreover, the BE of C1s, O1s for PANI/VCF composite was lower than that of VCF. It implied that the interaction formed between VCF and PANI, which was proven as hydrogen-bond interaction by the FTIR. XPS had been used to proved the hydrogen bonding existed in PANI and cellulose.17 As shown in Fig. 2c the N1s of the composite could be deconvoluted by assigning BE of 399.9, 401.6 and 401.6 eV for imine (–N![[double bond, length as m-dash]](https://www.rsc.org/images/entities/char_e001.gif) ), amine (–NH–) and cationic atoms (N+) to illustrate three structures of PANI in PANI/VCF composites. This has also been widely observed in other PANI complexes prepared chemically or electrochemically.27–29 Fig. 2d showed the S2p core-level spectra of PANI/VCF composite. These spectra could be fitted predominantly with a spin orbit split doublet (S2p3/2 and S2p1/2), and the BE peaks were about 167.6 and 168.6 eV. The doublet was attributed to the ionic sulphur species from the DBSA dopant that interacted with the nitrogen atoms of the PANI.28 It was consistent with FTIR. DBSA was used as both surfactant and dopant to improve the conductivity of PANI. Moreover, the S/N ratio (50.0%) was higher than previous report.29 The S/N ratio had been recognized depend on the washing procedure. Therefore, PANI/VCF composites exhibited the excellent conductivity and washing resistance stability.
), amine (–NH–) and cationic atoms (N+) to illustrate three structures of PANI in PANI/VCF composites. This has also been widely observed in other PANI complexes prepared chemically or electrochemically.27–29 Fig. 2d showed the S2p core-level spectra of PANI/VCF composite. These spectra could be fitted predominantly with a spin orbit split doublet (S2p3/2 and S2p1/2), and the BE peaks were about 167.6 and 168.6 eV. The doublet was attributed to the ionic sulphur species from the DBSA dopant that interacted with the nitrogen atoms of the PANI.28 It was consistent with FTIR. DBSA was used as both surfactant and dopant to improve the conductivity of PANI. Moreover, the S/N ratio (50.0%) was higher than previous report.29 The S/N ratio had been recognized depend on the washing procedure. Therefore, PANI/VCF composites exhibited the excellent conductivity and washing resistance stability.
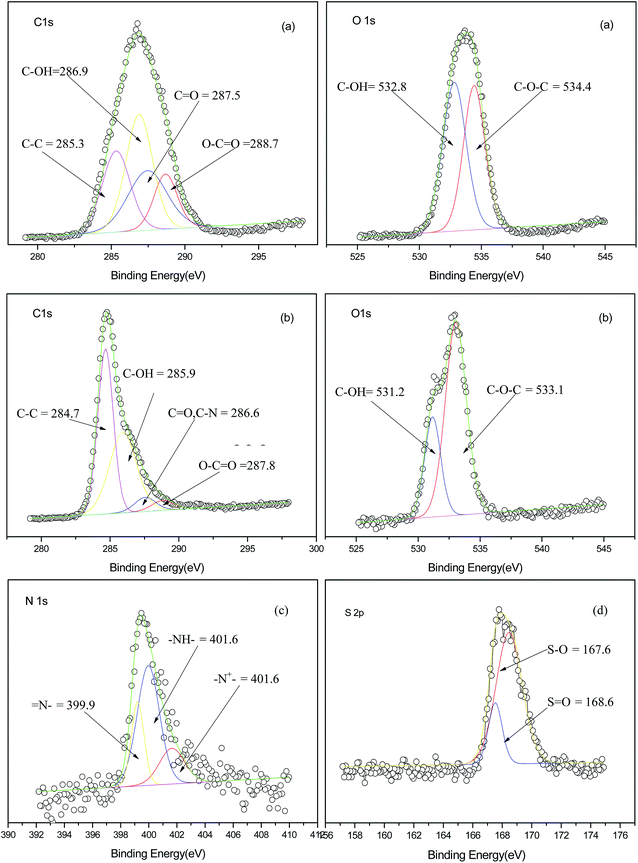 | ||
| Fig. 2 C1s and O1s XPS core level spectra of VCF (a), C1s and O1s XPS core level spectra of PANI/VCF composites (b), N1s (c) and S2p (d) XPS core level spectra of PANI/VCF composites. | ||
| Sample | C (%) | O (%) | N (%) | S (%) | Doping level (%) |
|---|---|---|---|---|---|
| VCF | 65.8 | 34.2 | — | — | — |
| DBSA doped PANI/VCF | 76.9 | 15.6 | 5.0 | 2.5 | 50.0 |
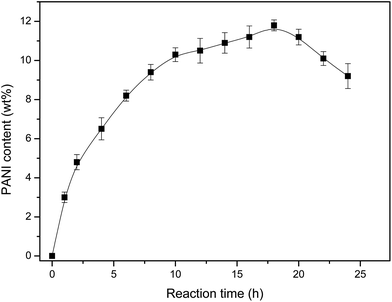
Fig. 3 showed the effects of the reaction time on the content of PANI. It could found in Fig. 3, the content of PANI component obviously varied from 0 to 11.8 wt% with the increasing for reaction time from 0 to 18 h. With the increase of reaction time, it's useful for reaction processing completely. However the PANI content began to decrease after longer reaction time. The reaction processed in the acidic condition which had an effect of corrosion on VCF and it made PANI fall off the surface of the VCF which could be proved by SEM vividly. What's more, there might be many side reactions with the longer reaction time. It also would decrease the content of PANI on the surface of VCF.
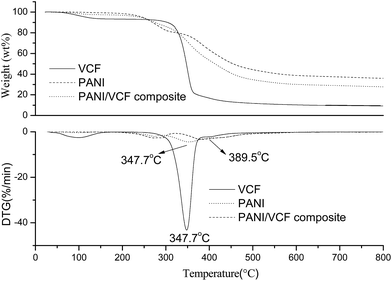
As shown in Fig. 4, TGA and derivative thermogravimetry (DTG) had been performed for VCF, PANI and PANI/VCF composite. The weight loss was due to the volatilization of the water, and the degradation of products had been monitored as a function of temperature. DTG curves associated with Tmax values at about 347.7 °C for VCF, which was ascribed to the destruction of VCF into a monomer of D-glucopyranose. At the same time, major losses of weight for PANI were observed over two temperature periods, beginning around 200 and 350 °C. The first decrease of mass was mainly due to the removal of dopant molecules. The second weight loss at the higher temperature indicated a structural decomposition of PANI. For PANI/VCF composite, the obvious mass loss might be ascribed to the destruction of main chains of both PANI and VCF. The relative lower mass loss of the composite than VCF could be attributed to the higher thermal stability of the PANI main chain. It also revealed that the interaction existed in PANI/VCF composite. Meanwhile, the Tmax value for VCF in PANI/VCF composite was equal to that of pure VCF. It implied that the mild treatment did not result in the oxidation and degradation of VCF. This result would be also proved by mechanical testing.
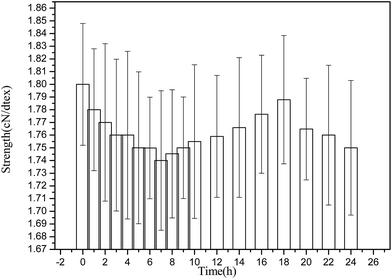
As shown in Fig. 5, the influence of reaction time on tensile strength of PANI/VCF composite was very slightly. It implied that the mild treatment did not result in the oxidation and degradation of VCF. With the increasing of reaction time, the tensile strength initially decreased to 1.74 cN dtex−1 at 7 h, and subsequently increased to 1.79 cN dtex−1 at 18 h. The improvement might be related to the PANI particles deposited on the surface of VCF6,16 (it could be detected by SEM) and connected to form a continuous layer, which could enhance the mechanical properties of VCF. The result of mechanical testing is corresponding to the relationship of PANI content and reaction time, as shown in Fig. 3.
The effect of reaction condition on the morphology and conductivity of PANI/VCF composites
The effect of reaction time on the morphology of PANI/VCF composites were illustrated in Fig. 6. The PANI accumulated in the form of particles deposited on the surface of VCF. PANI deposited mainly in the longitudinal grooves on the surface of the VCF, rarely in smooth and flat surface between the grooves (Fig. 6a and b) after reacted 10 and 14 h, respectively. With increasing reaction time, the deposition of PANI in the groove improved. When the reaction time increased to 18 h, it could be found that the PANI accumulated not only in the longitudinal grooves, but also deposited on the smooth surface of VCF, as exhibited in Fig. 6c. The continual PANI layer on the VCF played a very important role in improving the conductivity of composites. Moreover, the compact PANI layer was also beneficial to improve the mechanical properties. Fig. 6d showed that when the reaction time increased to 24 h, the amount of PANI accumulated on VCF decreased. The reaction processed in the acidic condition which had an effect of corrosion on VCF and it made PANI falling off the surface of the VCF. It was also detected by Fig. 3.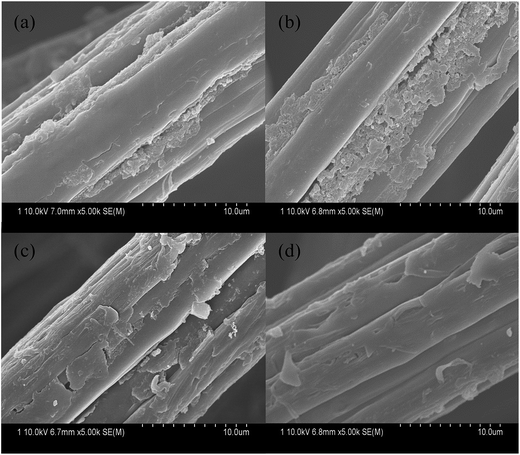 | ||
| Fig. 6 SEM images of PANI/VCF composites prepared with different reaction time: (a) 10 h, (b) 14 h, (c) 18 h, (d) 24 h. | ||
The effect of DBSA concentration on the morphology of PANI/VCF composites were shown in Fig. 7. It could be founded that the DBSA/ANI ratio improved to 1![[thin space (1/6-em)]](https://www.rsc.org/images/entities/char_2009.gif) :
:![[thin space (1/6-em)]](https://www.rsc.org/images/entities/char_2009.gif) 1, compact PANI layer could be formed on the surface of VCF. Moreover, PANI could not only fill in fiber longitudinal grooves, but also be bonded on the smooth surface of VCF, which facilitated the improvement of electrical conductivity, as shown in Fig. 7a and b. However, DBSA would form a large number of micelle on fiber surface. The more DBSA concentration, the more micelles formed in reaction system. Therefore, the force of hydrogen bonds between –OH in VCF and the –NH in ANI was abated, which deteriorated for the ANI to coat and PANI to depose on the surface of VCF.
1, compact PANI layer could be formed on the surface of VCF. Moreover, PANI could not only fill in fiber longitudinal grooves, but also be bonded on the smooth surface of VCF, which facilitated the improvement of electrical conductivity, as shown in Fig. 7a and b. However, DBSA would form a large number of micelle on fiber surface. The more DBSA concentration, the more micelles formed in reaction system. Therefore, the force of hydrogen bonds between –OH in VCF and the –NH in ANI was abated, which deteriorated for the ANI to coat and PANI to depose on the surface of VCF.
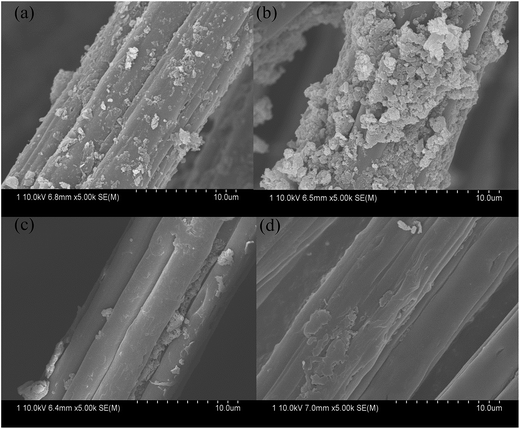 | ||
Fig. 7 SEM images of PANI/VCF composites prepared with different ratio of DBSA and ANI: (a) 0.5![[thin space (1/6-em)]](https://www.rsc.org/images/entities/char_2009.gif) : :![[thin space (1/6-em)]](https://www.rsc.org/images/entities/char_2009.gif) 1, (b) 1 1, (b) 1![[thin space (1/6-em)]](https://www.rsc.org/images/entities/char_2009.gif) : :![[thin space (1/6-em)]](https://www.rsc.org/images/entities/char_2009.gif) 1, (c) 2 1, (c) 2![[thin space (1/6-em)]](https://www.rsc.org/images/entities/char_2009.gif) : :![[thin space (1/6-em)]](https://www.rsc.org/images/entities/char_2009.gif) 1, (d) 2.5 1, (d) 2.5![[thin space (1/6-em)]](https://www.rsc.org/images/entities/char_2009.gif) : :![[thin space (1/6-em)]](https://www.rsc.org/images/entities/char_2009.gif) 1. 1. | ||
The effect of the ratio of ethanol and water on the morphology of PANI/VCF composites was shown in Fig. 8. When pure water was used as reaction solution, there was almost no PANI particles existed on VCF surface, as exhibited in Fig. 8a. From Fig. 8b–d, the compact and continual PANI layer could form on the surface of VCF with the increasing ethanol/water ratio.
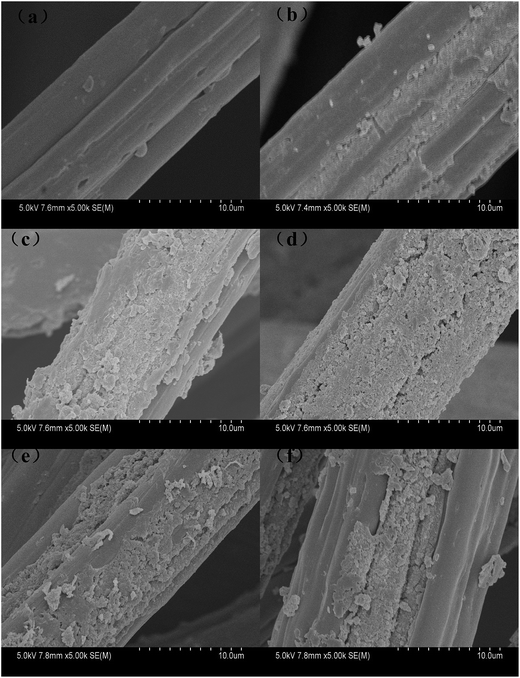 | ||
Fig. 8 SEM images of PANI/VCF composites prepared with different ratio of ethanol and water: (a) 0![[thin space (1/6-em)]](https://www.rsc.org/images/entities/char_2009.gif) : :![[thin space (1/6-em)]](https://www.rsc.org/images/entities/char_2009.gif) 100, (b) 30 100, (b) 30![[thin space (1/6-em)]](https://www.rsc.org/images/entities/char_2009.gif) : :![[thin space (1/6-em)]](https://www.rsc.org/images/entities/char_2009.gif) 70, (c) 40 70, (c) 40![[thin space (1/6-em)]](https://www.rsc.org/images/entities/char_2009.gif) : :![[thin space (1/6-em)]](https://www.rsc.org/images/entities/char_2009.gif) 60, (d) 50 60, (d) 50![[thin space (1/6-em)]](https://www.rsc.org/images/entities/char_2009.gif) : :![[thin space (1/6-em)]](https://www.rsc.org/images/entities/char_2009.gif) 50, (e) 60 50, (e) 60![[thin space (1/6-em)]](https://www.rsc.org/images/entities/char_2009.gif) : :![[thin space (1/6-em)]](https://www.rsc.org/images/entities/char_2009.gif) 40, (f) 70 40, (f) 70![[thin space (1/6-em)]](https://www.rsc.org/images/entities/char_2009.gif) : :![[thin space (1/6-em)]](https://www.rsc.org/images/entities/char_2009.gif) 30. 30. | ||
However, when the ethanol/water ratio exceeded 50![[thin space (1/6-em)]](https://www.rsc.org/images/entities/char_2009.gif) :
:![[thin space (1/6-em)]](https://www.rsc.org/images/entities/char_2009.gif) 50, the uniformity of PANI distributed on the surface of the fiber was reduced, as was shown in Fig. 7e and f. It could be explained that the DBSA as a doping agent, it was also a kind of surface active agent. It would form a large amount of micelle or latex particles on the fiber surface forming a layer of foam, hindering the diffusion process of the ANI to VCF. Meanwhile ethanol had a certain demulsification. Ethanol made diffusion easy, but above a certain concentration, which also reduced the micelle particles and ANI polymerization on fiber surface.
50, the uniformity of PANI distributed on the surface of the fiber was reduced, as was shown in Fig. 7e and f. It could be explained that the DBSA as a doping agent, it was also a kind of surface active agent. It would form a large amount of micelle or latex particles on the fiber surface forming a layer of foam, hindering the diffusion process of the ANI to VCF. Meanwhile ethanol had a certain demulsification. Ethanol made diffusion easy, but above a certain concentration, which also reduced the micelle particles and ANI polymerization on fiber surface.
Therefore, the PANI particles deposited on the surface of VCF and connected to form a continuous layer that lead to the improvement of the thermal stability, tensile strength, conductivity and washing resistance.30–34
The effect of reaction condition on the conductivity of PANI/VCF composites
The effect of reaction time on the conductivity of PANI/VCF composites was studied at the conditions of ANI concentration 0.1 mol L−1, APS concentration 0.125 mol L−1 and DBSA concentration 0.1 mol L−1 (in Fig. 9a). When the reaction time was 18 h, the conductivity reached its maximum value. In the shorter reaction time, PANI particles were isolated on the surface of VCF. With the increasing of reaction time, the continuous layer of PANI components gradually formed on the surface of VCF. However, more reaction time could result in the degradation of PANI and deteriorate the conductivity.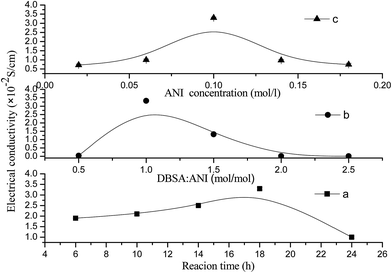 | ||
| Fig. 9 The effect of reaction condition on the electrical conductivity of PANI/VCF composites. (a) Reaction time, (b) DBSA concentration, (c) ANI concentration. | ||
The effect of DBSA concentration on the conductivity of PANI/VCF composites was also researched at the conditions of reaction time 18 h, ANI concentration 0.1 mol L−1, APS concentration 0.125 mol L−1 (in Fig. 9b). At lower DBSA concentrations, the polymerization was incomplete and the conductivity was lower. The more DBSA as the dopant improved the conductivity to the maximal value at 3.3 × 10⁻² S cm−1. The superfluous DBSA decreased the conductivity again. The more DBSA formed the more micelles, where PANI polymerization occurred rather than on the surface of VCF, so the PANI components reduced, and the conductivity decreased.
The influence of ANI concentration on the conductivity of PANI/VCF composites was investigated at the conditions of reaction time 18 h, APS concentration 0.125 mol L−1 and DBSA concentration 0.1 mol L−1 (in Fig. 9c). The conductivity of PANI/VCF composites increased with the improving of ANI concentration from 0.02 to 0.18 mol L−1. When the ANI concentration was 0.1 mol L−1, the conductivity reached its maximum value. The increasing of ANI concentrations was facilitated to form the continuous PANI layer on VCF. However, the higher ANI concentration could cause some adverse events and impede forming a structured PANI chain connected head to tail, reducing the conductivity.
The orthogonal experiments (in Table 2) were designed to determine the optimal reaction conditions. The results of orthogonal experiments were listed in Table 3. In the three factors, the ratio of ethanol and water was the main factor, greater than the ratio of DBSA and ANI and reaction time. The optimal reaction conditions were determined as following: the ratio of ethanol and water 30/70, reaction time 18 h, ANI concentration 0.1 mol L−1, APS concentration 0.125 mol L−1 and DBSA concentration 0.1 mol L−1.
| Factors | Ethanol/water (v/v) | DBSA![[thin space (1/6-em)]](https://www.rsc.org/images/entities/char_2009.gif) : :![[thin space (1/6-em)]](https://www.rsc.org/images/entities/char_2009.gif) ANI (mol/mol) ANI (mol/mol) |
Reaction time (h) |
|---|---|---|---|
| a Reaction time: 18 h. | |||
| Symbol | A | B | C |
| Level 1 | A1 = 30![[thin space (1/6-em)]](https://www.rsc.org/images/entities/char_2009.gif) : :![[thin space (1/6-em)]](https://www.rsc.org/images/entities/char_2009.gif) 70 70 |
B1 = 0.5![[thin space (1/6-em)]](https://www.rsc.org/images/entities/char_2009.gif) : :![[thin space (1/6-em)]](https://www.rsc.org/images/entities/char_2009.gif) 1 1 |
C1 = 6 |
| Level 2 | A2 = 50![[thin space (1/6-em)]](https://www.rsc.org/images/entities/char_2009.gif) : :![[thin space (1/6-em)]](https://www.rsc.org/images/entities/char_2009.gif) 50 50 |
B2 = 1![[thin space (1/6-em)]](https://www.rsc.org/images/entities/char_2009.gif) : :![[thin space (1/6-em)]](https://www.rsc.org/images/entities/char_2009.gif) 1 1 |
C2 = 10 |
| Level 3 | A3 = 70![[thin space (1/6-em)]](https://www.rsc.org/images/entities/char_2009.gif) : :![[thin space (1/6-em)]](https://www.rsc.org/images/entities/char_2009.gif) 30 30 |
B3 = 2.5![[thin space (1/6-em)]](https://www.rsc.org/images/entities/char_2009.gif) : :![[thin space (1/6-em)]](https://www.rsc.org/images/entities/char_2009.gif) 1 1 |
C3 = 18 |
| Number | A | B | C | Conductivity (×10−4 S cm−1) |
|---|---|---|---|---|
| a Reaction time: 18 h. | ||||
| 1 | A1 | B1 | C1 | 71.4 |
| 2 | A1 | B2 | C2 | 0.174 |
| 3 | A1 | B3 | C3 | 320 |
| 4 | A2 | B1 | C2 | 1.85 |
| 5 | A2 | B2 | C3 | 1.12 |
| 6 | A2 | B3 | C1 | 3.26 |
| 7 | A3 | B1 | C3 | 1.51 |
| 8 | A3 | B2 | C1 | 5.09 |
| 9 | A3 | B3 | C2 | 7.67 |
| Ij | 421.574 | 74.76 | 79.75 | |
| IIj | 6.23 | 6.384 | 9.694 | |
| IIIj | 14.27 | 360.93 | 352.63 | |
| Kj | K1 = 3 | K2 = 3 | K3 = 3 | |
| Ij/Kj | 141 | 25 | 27 | |
| IIj/Kj | 2 | 2 | 3 | |
| IIIj/Kj | 5 | 120 | 118 | |
| Rang (Dj) | 139 | 118 | 115 | |
Washing resistance
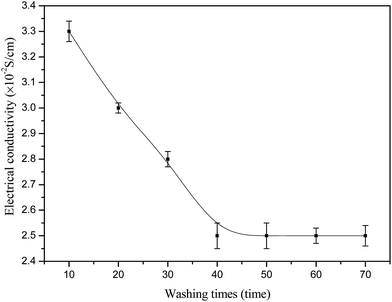
The dependence of the conductivity of PANI/VCF composite on washing time was shown in Fig. 10. Before 40 washing times, the conductivity rapidly decreased from 3.3 × 10⁻² to 2.5 × 10⁻² S cm−1, while it was stable after more washing times. After some PANI particles, which were not combined well with VCF, were washed away, the conductivity of PANI/VCF composites were kept in the high value. It indicated that most PANI had good adhesion on VCF.The conductivity (the maximal value 3.3 × 10⁻² S cm−1) of PANI/VCF composite was competitive with other PANI composites such as graphite oxide/ordered PANI composites (4.86 × 10⁻⁴ S cm−1),35 epoxy resin/PANI composites (10−3 S cm−1),36 polyurethane/PANI composites (3.7 × 10⁻⁵ S cm−1),37 polyaniline/polycarbonate composites (4.5 × 10⁻³ S cm−1).38
Conclusion
The conductive PANI/VCF composites were fabricated by polymerizing PANI on VCF template in a mixed solution of ethanol and water. An ethanol/water (30![[thin space (1/6-em)]](https://www.rsc.org/images/entities/char_2009.gif) :
:![[thin space (1/6-em)]](https://www.rsc.org/images/entities/char_2009.gif) 70, v/v) solution was used as solvent for synthesis and washing, reducing purification time and residue volume. The composites with good adhesion, good conductivity and washing resistance had been proven with FTIR, TGA, XPS. PANI components could form the continuous phase on VCF. The morphology and conductivity of the PANI/VCF composites were dependent on reaction time, ANI concentration, APS concentration and DBSA concentration. And the optimal reaction conditions were determined with orthogonal experiments as following: reaction time 18 h, ANI concentration 0.1 mol L−1, APS concentration 0.125 mol L−1, DBSA concentration 0.1 mol L−1 at the reaction temperature of 0 °C. The conductivity of PANI/VCF composites still kept at 2.5 × 10⁻² S cm−1 after 40 washing times, and this value was stable for more washing times. The PANI/VCF composites could become a potential material for conductive textiles, dye-sensitized solar cells, energy storage materials, sensors, and materials for water treatment.
70, v/v) solution was used as solvent for synthesis and washing, reducing purification time and residue volume. The composites with good adhesion, good conductivity and washing resistance had been proven with FTIR, TGA, XPS. PANI components could form the continuous phase on VCF. The morphology and conductivity of the PANI/VCF composites were dependent on reaction time, ANI concentration, APS concentration and DBSA concentration. And the optimal reaction conditions were determined with orthogonal experiments as following: reaction time 18 h, ANI concentration 0.1 mol L−1, APS concentration 0.125 mol L−1, DBSA concentration 0.1 mol L−1 at the reaction temperature of 0 °C. The conductivity of PANI/VCF composites still kept at 2.5 × 10⁻² S cm−1 after 40 washing times, and this value was stable for more washing times. The PANI/VCF composites could become a potential material for conductive textiles, dye-sensitized solar cells, energy storage materials, sensors, and materials for water treatment.
Acknowledgements
The authors are thankful to the Science Fund of Aviation (201329Q2001); National Natural Science Fund of China (21206123); Postdoctoral Program projects (2014M551026, 201402011); Tianjin Municipal Applied Basic Research and Frontier Technology Research Programs (13JCQNJC02300) for financial support. In addition, the authors are thankful to Na Han and Zhuo Yu for giving advice on revising the article.Notes and references
- Y. Lei, X. Qian, J. Shen and X. An, Bioresour. Technol., 2013, 131, 134 CrossRef CAS PubMed.
- C. Xing, Z. Zhang, L. Yu, L. Zhang and G. A. Bowmaker, RSC Adv., 2014, 4(62), 32718 RSC.
- Z. Tian, H. Yu, L. Wang, M. Saleem, F. Ren, P. Ren and L. Huang, RSC Adv., 2014, 4(54), 28195 RSC.
- S. Cho, J. S. Lee, J. Jun and J. Jang, J. Mater. Chem. A, 2014, 2(6), 1955 CAS.
- L. Xia, Z. Wei and M. Wan, J. Colloid Interface Sci., 2010, 341(1), 1 CrossRef CAS PubMed.
- J. E. Yang, I. Jang, M. Kim, S. H. Baeck, S. Hwang and S. E. Shim, Electrochim. Acta, 2013, 111, 136 CrossRef CAS PubMed.
- H. Xinping, G. Bo, W. Guibao, W. Jiatong and Z. Chun, Electrochim. Acta, 2013, 111, 210 CrossRef PubMed.
- H. Bejbouj, L. Vignau, J. L. Miane, T. Olingab, G. Wantza, A. Mouhsenc, E. M. Oualimc and M. Harmouchiet, Mater. Sci. Eng., 2010, 166, 185 CrossRef CAS PubMed.
- V. Talwar, O. Singh and R. C. Singh, Sens. Actuators, B, 2014, 191, 276 CrossRef CAS PubMed.
- E. Song and J. W. Choi, Microelectron. Eng., 2014, 116, 26 CrossRef CAS PubMed.
- M. G. Han, S. K. Cho, S. G. Oh and S. S. Im, Synth. Met., 2002, 126(1), 53 CrossRef CAS.
- M. Campos, T. A. Miziara, F. H. Cristovan and E. C. Pereira, J. Appl. Polym. Sci., 2014, 131(17), 40688 CrossRef PubMed.
- I. Brook, G. Mechrez, R. Y. Suckeveriene, R. Tchoudakov, S. Lupo and M. Narkis, Polym. Compos., 2014, 35(4), 788 CrossRef CAS PubMed.
- Q. Yao, L. Chen, W. Zhang, S. Liufu and X. Chen, ACS Nano, 2010, 4(4), 2445 CrossRef CAS PubMed.
- Y. Zhao, G. S. Tang, Z. Z. Yu and J. S. Qi, Carbon, 2012, 50(8), 3064 CrossRef CAS PubMed.
- D. Chen, Y. E. Miao and T. Liu, ACS Appl. Mater. Interfaces, 2013, 5(4), 1206 CAS.
- J. Li, X. Qian, L. Wang and X. An, BioResources, 2010, 5(2), 712 CAS.
- J. A. Marins, B. G. Soares, K. Dahmouche, S. J. Ribeiro, H. Barud and D. Bonemer, Cellulose, 2011, 18(5), 1285 CrossRef CAS PubMed.
- H. Peng, G. Ma, W. Ying, A. Wang, H. Huang and Z. Lei, J. Power Sources, 2012, 211, 40 CrossRef CAS PubMed.
- E. Asadian, S. Shahrokhian and E. Jokar, Sens. Actuators, B, 2014, 196, 582 CrossRef CAS PubMed.
- J. Li, Q. Xiao, L. Li, J. Shen and D. Hu, Appl. Surf. Sci., 2015, 331, 108 CrossRef CAS PubMed.
- J. Wang, B. Zhao, L. Zhao, X. Zhang and D. Zhao, Synth. Met., 2015, 204, 10 CrossRef CAS PubMed.
- W. Lei, P. He, S. Zhang, F. Dong and Y. Ma, J. Power Sources, 2014, 266, 347 CrossRef CAS PubMed.
- W. Hu, S. Liu, S. Chen and H. Wang, Cellulose, 2011, 18(3), 655 CrossRef CAS.
- X. Guo, G. T. Fei, H. Su and L. De Zhang, J. Phys. Chem. C, 2011, 115(5), 1608 CAS.
- P. Hobza and Z. Havlas, Chem. Rev., 2000, 100(11), 4253 CrossRef CAS PubMed.
- S. Ameen, M. S. Akhtar, Y. S. Kim and H. S. Shin, Chem. Eng. J., 2012, 181, 806 CrossRef PubMed.
- Y. Fu and A. Manthiram, Chem. Mater., 2012, 24(15), 3081 CrossRef CAS.
- B. J. Kim, S. G. Oh, M. G. Han and S. S. Im, Synth. Met., 2001, 122(2), 297 CrossRef CAS.
- J. E. Yang, I. Jang, M. Kim, S. H. Baeck, S. Hwang and S. E. Shim, Electrochim. Acta, 2013, 111, 136 CrossRef CAS PubMed.
- D. Chen, Y. E. Miao and T. Liu, ACS Appl. Mater. Interfaces, 2013, 5(4), 1206 CAS.
- J. Wang, B. Zhao, L. Zhao, X. Zhang and D. Zhao, Synth. Met., 2015, 204, 10 CrossRef CAS PubMed.
- C. Merlini, G. M. Barra, D. P. Schmitz, S. D. Ramôa, A. Silveira, T. M. Araujo and A. Pegoretti, Polym. Test., 2014, 38, 18 CrossRef CAS PubMed.
- D. Ge, L. Yang, L. Fan, C. Zhang, X. Xiao, Y. Gogotsi and S. Yang, Nano Energy, 2015, 11, 568 CrossRef CAS PubMed.
- Y. Zhao, G. S. Tang, Z. Z. Yu and J. S. Qi, Carbon, 2012, 50(8), 3064 CrossRef CAS PubMed.
- M. Oyharçabal, T. Olinga, M. P. Foulc and V. Vigneras, Synth. Met., 2012, 162(7), 555 CrossRef PubMed.
- T. Gurunathan, C. R. Rao, R. Narayan and K. V. S. N. Raju, Prog. Org. Coat., 2013, 76(4), 639 CrossRef CAS PubMed.
- B. H. Jeon, S. Kim, M. H. Choi and I. J. Chung, Synth. Met., 1999, 104(2), 95 CrossRef CAS.
| This journal is © The Royal Society of Chemistry 2015 |

