 Open Access Article
Development of hierarchical copper sulfide–carbon nanotube (CuS–CNT) composites and utilization of their superior carrier mobility in efficient charge transport towards photodegradation of Rhodamine B under visible light†
Mainak
Das
a,
Dhananjoy
Das
a,
Sayantan
Sil
b and
Partha Pratim
Ray
 *a
*a
aDepartment of Physics, Jadavpur University, Kolkata 700032, India. E-mail: parthapray@yahoo.com
bDepartment of Physics, University of Engineering and Management, University Area, Action Area III, B/5, Newtown, Kolkata 700160, India
First published on 31st May 2023
Abstract
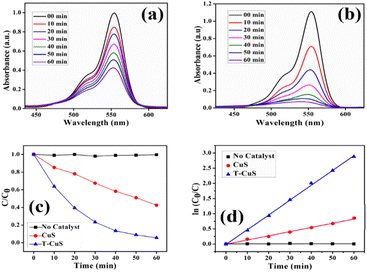
In this work, the synthesis of visible light sensitive copper sulfide (CuS) nanoparticles and their composites with carbon nanotubes (T-CuS) via a solvothermal technique is reported. The synthesized nanoparticles (NPs) and their composites were significantly characterized by powder X-ray diffraction (PXRD), scanning electron microscopy, transmission electron microscopy, X-ray photoelectron spectroscopy, UV-vis spectroscopy, photoluminescence (PL) spectroscopy and thermogravimetric analysis (TGA). The effect of carbon nanotubes (CNTs) on the crystallinity, microstructures, photo-absorption, photo-excitation, thermal stability and surface area of CuS was investigated. The current–voltage (I vs. V) characteristics of both CuS and T-CuS based Schottky diodes were measured to determine the charge transport parameters like photosensitivity, conductivity, mobility of charge carriers, and transit time. The photocatalytic performance of bare CuS and T-CuS in the decomposition of Rhodamine B dye was studied using a solar simulator. The T-CuS composite showed higher photocatalytic activity (94%) compared to bare CuS (58%). The significance of charge carrier mobility in transferring photo-induced charges (holes and electrons) through complex networks of composites and facilitating the photodegradation process is explained. Finally, the reactive species responsible for the Rhodamine B degradation were also identified.
Introduction
Organic dyes and pigments discharged into water sources, mostly by the paint and textile industries, are causing serious environmental issues and harming the ecosystem in other ways.1 Over the last few decades, various biological and physicochemical experiments based on physical as well as chemical adsorption approaches have been conducted to decompose these industrial pollutants. However, these processes often produce secondary pollutants and are not cost-effective from the economic viewpoint.2 The photocatalytic approach based on semiconductor materials has demonstrated significant efficiency in wastewater purification among all advanced oxidation techniques known to exist.3 There are some well-known semiconducting photocatalysts, namely TiO2 and ZnO, which have been widely used to decompose organic pollutants, but their use is hindered due to their wide range bandgaps, which are 3.2 eV and 3.37 eV for TiO2 and ZnO, respectively, limiting their light absorption mainly in the ultraviolet (UV) region of the solar spectrum.4,5 This reduces the redox reactions with the impurities and significantly affects the rate of degradation.6On the other hand, copper(II) sulfide (CuS) has a narrow direct bandgap of 2.29 eV, due to which it can efficiently capture visible light from the solar spectrum, making it practically function as a ‘visible-light-driven photocatalyst’. It also has excellent optical and electronic properties which show great potential in many fields like solar cells,7 energy storage,8 gas sensors,9 biosensors10 and photocatalysis.11 Copper sulfide has some excellent features, such as its environmentally friendly and non-toxic nature, low cost, biocompatibility, higher physical and chemical stability and ease of recyclability which enhances its effectiveness as a prospective photocatalyst. On the other hand, CuS nanomaterials also have an intrinsic drawback of having poor photocatalytic performance, especially when exposed to visible light, due to the quick electron (e−)–hole (h+) recombination. There have been several attempts to enhance the electron transfer during the photocatalytic process by reducing the electron–hole recombination in these materials. Carbon nanomaterials are eco-friendly, cost-effective and good electron acceptors, so they can suppress electron–hole recombination effectively.12 Among them, carbon nanotubes (CNT) are unique in terms of their morphological, structural, and electrical characteristics, such as their organised structure with a high surface to volume ratio, light weight, and high electrical conductivity. CNT increases the migration rate of photo-generated electrons, thereby pushing electrons and holes away which prohibits electron (e−)–hole (h+) recombination. Absorption of light also induces electrons into the CNTs and enhances the participation of electrons in the photocatalytic reaction.13,14 For higher photocatalytic performances, the electrons are expected to swiftly transfer and their subsequent recombination should be as slow as possible.15 Further, the fast electron transfer depends on the mobility of the carriers. To enhance the mobility and the associated charge carrier transport properties, CNT is incorporated with bare CuS in this work. This enhanced mobility of the charge carriers in the T-CuS composite reflects in better photocatalytic performances than for bare CuS. This report describes the synthesis of a carbon nanotubes–copper sulfide (T-CuS) composite and demonstrates its capability to decompose the organic dye Rhodamine B in the presence of visible light.
Experimental
Materials
The chemicals used in this study were copper(II) nitrate trihydrate (Cu(NO3)2·3H2O), ethylene glycol (HOCH2CH2OH), deionized (DI) water, absolute ethanol (C2H6O) and hydrogen peroxide (H2O2). All of them were purchased from Merck (Merck Specialities Private Limited). In addition, sodium sulphide (Na2S·9H2O) and multi-walled carbon nanotubes (CNT) were purchased from RANKEM Laboratory Reagent and from Sigma Aldrich, respectively. All the chemicals in the synthesis were used without any additional purification.Synthesis of CuS nanoparticles
Here, a solvothermal method was used to synthesise the CuS nanoparticles (NPs). At first, 0.9964 g of Cu(NO3)2·3H2O was mixed with 30 mL ethylene glycol and placed on a magnetic stirrer for 30 min to prepare a homogeneous solution (solution 1). Then, 0.9604 g of Na2S·9H2O was mixed with 20 mL ethylene glycol and another homogeneous solution was prepared via magnetic stirring for 30 min (solution 2). Thereafter, solution 2 was put into solution 1 drop by drop and the collected mixture was stirred for 1 h. Next, the obtained solution was transferred to a Teflon-lined solvothermal autoclave which was kept inside an oven at a temperature of 160 °C for 16 h. After that the precipitate was rinsed with DI water (four times) and ethanol (four times) and finally collected by centrifugation techniques. At the end, the final product, CuS nanoparticles, was collected and dried at 60 °C for 16 h.Synthesis of the CNT–CuS composite
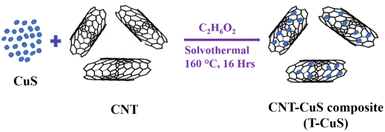
Here, a similar solvothermal method was used to synthesise the CNT–CuS composites (T-CuS). In this process, a certain amount (3%) of carbon nanotubes (CNTs) was dispersed in Cu(NO3)2 precursor solution and then stirred for 30 min. After that, Na2S solution was dropwise added into the previous mixer. This final prepared solution was kept under magnetic stirring for 6 h. Then, the final solution was transferred to a Teflon-lined autoclave. After that, the autoclave was placed in a hot air oven at a temperature of 160 °C for 16 h. Finally, the collected samples were washed multiple times with DI water and absolute ethanol and then kept on a hot plate at 60 °C for 12 h. The synthesis process of the CNT–CuS composite is shown in Fig. 1.Material characterization techniques
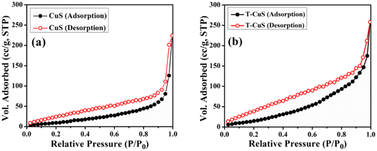
The crystallographic structure and phase purity of the synthesized materials (CuS and T-CuS) were analysed using a powder X-ray diffractometer (Bruker D8 Advance) having Cu-Kα (λ = 1.5418 Å) radiation, operated at a scan rate of 0.02° s−1. The surface morphology was studied with the help of a scanning electron microscope (FEI Inspect F50) and the elemental combination was determined using an EDX (energy dispersive X-ray) analyser. Information regarding the microstructure of the synthesised materials was analysed with the help of a transmission electron microscope (JEOL JEM 2100 F). XPS (X-ray Photoelectron Spectroscopy; Omicron Nanotechnology) with Al-Kα radiation (E = 1486.7 eV) was utilised to examine the electronic states of the elements present on the surface of the samples. The absorption spectra and the photocatalytic behaviour of the synthesized materials were recorded using a UV-vis (PerkinElmer, Lambda 365) spectrophotometer and a solar simulator [Model 10500, Abet Technologies], respectively. The photoluminescence (PL) spectra were collected using a spectrofluorimeter (Cary Eclipse fluorescence spectrometer, Agilent Technologies). The thermal stability of both of the materials was investigated using a thermogravimetric analyser (DTG-60H, Shimadzu) within the temperature range from 30 °C to 800 °C in a N2 atmosphere. The estimation of the Brunauer–Emmett–Teller (BET) surface area of the synthesised materials by N2 adsorption–desorption was done using an Autosorb iQ2 (Quantachrome, USA) at 77 K. The measurements of current–voltage (I–V) characteristics were performed with a source measurement unit (Keithley 2635B).Results and discussion
Structural properties
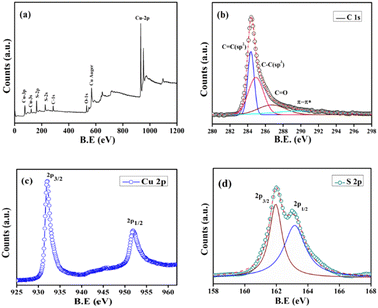
![[double bond, length as m-dash]](https://www.rsc.org/images/entities/char_e001.gif) C, C–C, C
C, C–C, C![[double bond, length as m-dash]](https://www.rsc.org/images/entities/char_e001.gif) O and π–π* shake-up features respectively (Fig. 5b).18 This suggests the probable existence of graphitic layers which prefer fast electron transfer and the O2-containing group establishes strong interaction in between the aqueous solution and the nanocomposite at the time of photocatalytic decomposition, which will be discussed in the following. The higher resolution XPS of Cu 2p which is shown in Fig. 5c displays two distinct peaks at 932.4 eV and 952.3 eV. The difference between these states is 19.9 eV, which is consistent with the previously reported data for Cu 2p3/2 and Cu 2p1/2 states.19 These peaks can be assigned to the Cu2+ state in CuS nanostructures. The higher resolution XPS spectrum of S 2p (Fig. 5d) indicates the existence of two peaks at B.E. values of 161.9 eV and 163.3 eV, which could be attributed to S 2p3/2 and S 2p1/2 states, respectively.20 S2− species are responsible for the detection of these two peaks.
O and π–π* shake-up features respectively (Fig. 5b).18 This suggests the probable existence of graphitic layers which prefer fast electron transfer and the O2-containing group establishes strong interaction in between the aqueous solution and the nanocomposite at the time of photocatalytic decomposition, which will be discussed in the following. The higher resolution XPS of Cu 2p which is shown in Fig. 5c displays two distinct peaks at 932.4 eV and 952.3 eV. The difference between these states is 19.9 eV, which is consistent with the previously reported data for Cu 2p3/2 and Cu 2p1/2 states.19 These peaks can be assigned to the Cu2+ state in CuS nanostructures. The higher resolution XPS spectrum of S 2p (Fig. 5d) indicates the existence of two peaks at B.E. values of 161.9 eV and 163.3 eV, which could be attributed to S 2p3/2 and S 2p1/2 states, respectively.20 S2− species are responsible for the detection of these two peaks.
Optical properties
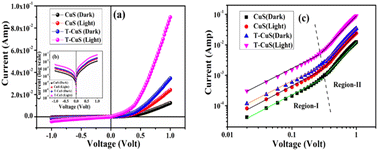 | ||
Fig. 10 (a) Current–voltage (I–V) plots, (b) log scale I vs. V curves and (c) log![[thin space (1/6-em)]](https://www.rsc.org/images/entities/char_2009.gif) I–log I–log![[thin space (1/6-em)]](https://www.rsc.org/images/entities/char_2009.gif) V plot of the bare CuS and T-CuS composite-based Schottky diodes under dark and illumination conditions. V plot of the bare CuS and T-CuS composite-based Schottky diodes under dark and illumination conditions. | ||
| Sample | Photosensitivity (S) | Conditions | |||||
|---|---|---|---|---|---|---|---|
| Dark conditions | Light conditions | Dark conditions | Light conditions | Dark conditions | Light conditions | ||
| Conductivity (σ) (S m−1) | Mobility (μeff) (m2 V−1 s−1) | Transition time (τ) (s) | |||||
| CuS | 1.01 | 3.42 × 10⁻⁴ | 6.71 × 10⁻⁴ | 2.32 × 10⁻⁵ | 5.39 × 10⁻⁵ | 1.54 × 10⁻⁸ | 8.32 × 10⁻⁹ |
| T-CuS | 2.05 | 9.57 × 10⁻⁴ | 2.48 × 10⁻³ | 7.98 × 10⁻⁵ | 2.67 × 10⁻⁴ | 7.92 × 10⁻⁹ | 3.20 × 10⁻⁹ |
To observe the overall effect of CNT in the photo-degradation process and to better understand the charge transfer mechanism, the current–voltage (I–V) mechanism was further analyzed by introducing transit time (τ) and carrier mobility (μeff). For this purpose, log![[thin space (1/6-em)]](https://www.rsc.org/images/entities/char_2009.gif) I vs. log
I vs. log![[thin space (1/6-em)]](https://www.rsc.org/images/entities/char_2009.gif) V graphs are plotted for the positive voltages as shown in Fig. 10b, which shows two distinct linear regions, suggesting different conduction mechanisms. Interfacial trap states at the metal–semiconductor junction modify the conduction mechanism of charge carriers which revised the I–V characteristics. In small bias (region I), current shows ohmic (I ∝ V) behaviour with a slope value of approximately one. At this region, the current is guided by the intrinsic charge carriers of the material.31 The carriers injected from the junction spread over the space at the intermediate potential difference (region II) and create a spatially distributed field of charge. This field dominates the charge carriers and their “mobility” becomes a key factor for the quadratic current (I ∝ V2).32,33 Furthermore, space charge limited current (SCLC) theory was used in this region to determine the effective carrier mobility (μeff) and carrier transit time (τ).
V graphs are plotted for the positive voltages as shown in Fig. 10b, which shows two distinct linear regions, suggesting different conduction mechanisms. Interfacial trap states at the metal–semiconductor junction modify the conduction mechanism of charge carriers which revised the I–V characteristics. In small bias (region I), current shows ohmic (I ∝ V) behaviour with a slope value of approximately one. At this region, the current is guided by the intrinsic charge carriers of the material.31 The carriers injected from the junction spread over the space at the intermediate potential difference (region II) and create a spatially distributed field of charge. This field dominates the charge carriers and their “mobility” becomes a key factor for the quadratic current (I ∝ V2).32,33 Furthermore, space charge limited current (SCLC) theory was used in this region to determine the effective carrier mobility (μeff) and carrier transit time (τ).
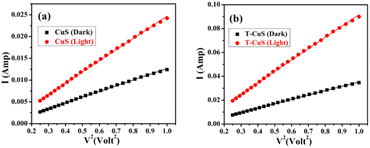
The electron mobility was evaluated from the slope of the I–V2 plot (Fig. 11a and b), using the equation of Mott–Gurney,33
 | (1) |
 | (2) |
The calculated values of μeff and t are given below in Table 1. Our results reflected higher mobility for the carbon nanotube and its effective contribution to the transfer of charge carriers smoothly. The CNT-based composite showed greater mobility & transit time than the bare CuS NPs. The result shows compatibility with previously reported data of a carbon-based (rGO) composite.35,36 Both under dark and illumination conditions, the mobility of carriers increased remarkably up to 4–5 times. The enrichment of mobility & transition time can increase the efficiency of charge transfer and thus the photocatalytic activity.
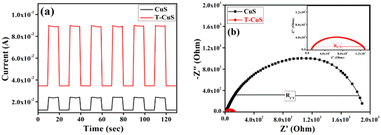
Transient photo-response measurements and electrochemical impedance spectroscopy (EIS) were performed to investigate the photo-electrochemical characteristics of the as-prepared catalysts, and the results are shown in Fig. 12a and b respectively. The photocurrent intensity of the T-CuS composite was found to be significantly higher (Fig. 12a) than that of the bare CuS, as expected. This result suggests that incorporating CNT into the CuS nanoparticles could facilitate the separation of photo-generated electrons and holes and their swift transfer through the complex network. Furthermore, the EIS Nyquist spectra, which constitute an effective tool for investigating the conductance and charge transfer properties, revealed that the diameter of the semi-circular arc for the T-CuS composite was significantly smaller than for the bare CuS (Fig. 12b). This finding confirms that the addition of CNT significantly reduced the charge transfer resistance in the composite material, allowing electrons and holes to migrate to active sites during the degradation process, as discussed further below.
 | (3) |
The reactive species trapping experiments were carried out to determine the active species in the 3% T-CuS photocatalytic system. First, 0.1 mmol of methyl alcohol (MeOH), a scavenger of photogenerated h+, 0.1 mmol of isopropyl alcohol (IPA), a scavenger of hydroxyl ˙OH, and 0.1 mmol of benzoquinone (BQ), a scavenger of superoxide ˙O2− (ref. 39), were separately added in the photodegradation system. Further, the photodegradation experiment was performed under the same procedure without adding scavengers. The absorption plots of degraded RhB by T-CuS in the presence of different scavengers are shown in Fig. S7 (ESI†). Fig. 14 shows the effect of the scavengers on the degradation percentage of RhB with 60 min irradiation time.
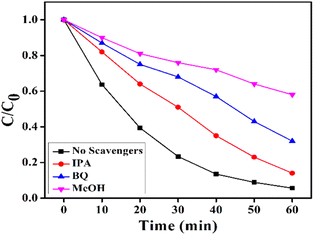 | ||
| Fig. 14 Photocatalytic degradation of RhB aqueous solution by T-CuS in the presence of IPA, BQ, MeOH and no scavengers. | ||
As seen in Fig. 14, the RhB solution degraded up to 86% of its initial concentration which demonstrates that the decomposition of RhB was slightly suppressed in the presence of IPA, as compared to 94% in the absence of scavengers. This finding indicates that ˙OH has a minor impact on the degradation of RhB using the T-CuS catalyst. In case of MeOH, the value of (C/C0) was not reduced below 42%, indicating that holes (h+) play a significant role in RhB degradation. However, when BQ was present during the reaction, the concentration of (C/C0) was somewhat reduced by up to 68%. This suggests that the ˙O2− radical is also markedly responsible for photocatalytic degradation of RhB. Here, RhB degradation was observed to be obviously inhibited on the addition of BQ and MeOH; in contrast, IPA had a very small effect on the dye degradation. This implies that the photogenerated holes (h+) and ˙O2− radicals play the main role in the removal process of the dye, whereas ˙OH plays a minor role in the dye degradation.
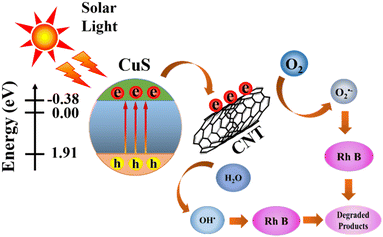
To explain the synergistic effect of CNTs and CuS in the composite, we analysed the photocatalytic degradation process. In the presence of visible light illumination, excitons of interfaces are generated on the surface of CuS NPs and segregated into free holes in the valence band (VB) & free electrons in the conduction band (CB). However, the photogenerated h+ and e− tended to recombine before the appearance of the active site resulting in a poor photocatalytic response. When the CuS NPs bind with CNTs, the photo-induced e− in the conduction band of CuS can be separated effectively at the carbon nanotube interfaces, leaving h+ in the valence band of CuS due to its favourable energy level (Fig. 15).40,41 CNT is photoexcited to produce electrons in its lowest unoccupied molecular orbital (LUMO) and holes in its highest occupied molecular orbital (HOMO). It is well known that CNT is an excellent electron acceptor, which will trap the CB electrons of CuS. Simultaneously, the photoexcited CNT is a good electron donor, readily leading to the migration of the photoexcited electrons in the LUMO of CNT to the CB of CuS. The interesting electron transfer process can efficiently prevent the recombination of the CB electrons with the VB holes in CuS. This is the dominant mechanism resulting in the enhanced photodegradation performance of the T-CuS composites compared to bare CuS.42 Therefore, photo-generated electrons in CuS can effortlessly reach the active site through the CNT network and reduce the dissolved O2 present in the aqueous medium into the highly reactive superoxide anion (O2−) and react further with H2O to form hydroxyl (OH*) radicals.43 Furthermore, photo-induced h+ can react also with H2O or OH− to oxidize them to OH˙.44 The O2˙−, OH˙ and the photo-generated h+ are jointly involved in the decomposition process of RhB solutions.45,46Fig. 15 shows a pictorial representation of the photocatalytic activity of the T-CuS photocatalyst.
Conclusion
CuS NPs were synthesized successfully and the CNT incorporation with CuS was assisted by PXRD, FESEM, FEG-TEM, XPS, UV-vis and PL data. The importance of charge transport kinetics and higher charge carrier mobility of the photocatalysts for RhB decomposition was reported. It was seen that in the presence of visible light, the T-CuS exhibited higher photocatalytic activity than the bare CuS. The higher mobility of the composites helped the photo-induced charges to quickly transfer between the active site and the target molecules in the course of the degradation process. Strong interfacial contact, higher absorption of visible light and reduced recombination of e−–h+ pairs are the additional crucial key factors for enhancing the photocatalytic performance of the composites. Overall, addressing the challenge of visible light-induced photocatalysis, the superiority of the CNT composites over the as-synthesized bare CuS catalysts was demonstrated in this study. Finally, our results shed light on the design of carbon-based semiconductor (T-CuS) composites and established them as promising photocatalysts for various potential applications in wastewater treatment.Conflicts of interest
There are no conflicts to declare.Acknowledgements
The authors would like to give special thanks to the University Grants Commission (UGC) for providing the NET-SRF fellowship programme.References
- R. Al-Tohamy, S. S. Ali, F. Li, K. M. Okasha, Y. A. G. Mahmoud, T. Elsamahy, H. Jiao, Y. Fu and J. Sun, Ecotoxicol. Environ. Saf., 2022, 231 Search PubMed.
- V. Selvaraj, T. Swarna Karthika, C. Mansiya and M. Alagar, J. Mol. Struct., 2021, 1224, 129195 CrossRef CAS.
- M. A. Al-Nuaim, A. A. Alwasiti and Z. Y. Shnain, Chem. Pap., 2022, 77, 677–701 CrossRef PubMed.
- S.-Y. Wang, J.-Y. Ma, Z.-J. Li, H. Q. Su, N. R. Alkurd, W.-L. Zhou, L. Wang, B. Du, Y.-L. Tang, D.-Y. Ao, S.-C. Zhang, Q. K. Yu and X.-T. Zu, J. Hazard. Mater., 2015, 285, 368–374 CrossRef CAS PubMed.
- O. Elbanna, M. Zhu, M. Fujitsuka and T. Majima, ACS Catal., 2019, 9, 3618–3626 CrossRef CAS.
- T. Aarthi and G. Madras, Ind. Eng. Chem. Res., 2007, 46, 7–14 CrossRef CAS.
- F. Ghribi, A. Alyamani, Z. ben Ayadi, K. Djessas and L. el Mir, in Energy Procedia, Elsevier Ltd, 2015, vol. 84, pp. 197–203 Search PubMed.
- T. Kajana, A. Pirashanthan, D. Velauthapillai, A. Yuvapragasam, S. Yohi, P. Ravirajan and M. Senthilnanthanan, RSC Adv., 2022, 12, 18041–18062 RSC.
- D. Wang, M. Sun, G. Feng and C. Song, J. Mater. Eng. Perform., 2019, 28, 6649–6655 CrossRef CAS.
- N. Ul Ain, J. A. Nasir, Z. Khan, I. S. Butler and Z. Rehman, RSC Adv., 2022, 12, 7550–7567 RSC.
- M. Baláž, E. Dutková, Z. Bujňáková, E. Tóthová, N. G. Kostova, Y. Karakirova, J. Briančin and M. Kaňuchová, J. Alloys Compd., 2018, 746, 576–582 CrossRef.
- X. Meng, L. Shi, L. Cui, L. Yao and Y. Zhang, Mater. Res. Bull., 2021, 135, 111156 CrossRef CAS.
- J. C. Ortiz-Herrera, H. Cruz-Martínez, O. Solorza-Feria and D. I. Medina, Int. J. Hydrogen Energy, 2022, 47, 30213–30224 CrossRef CAS.
- Y. Huang, R. Li, D. Chen, X. Hu, P. Chen, Z. Chen and D. Li, Catalysts, 2018, 8, 151 CrossRef.
- R. Sarkar, M. Kar, M. Habib, G. Zhou, T. Frauenheim, P. Sarkar, S. Pal and O. v. Prezhdo, J. Am. Chem. Soc., 2021, 143, 6649–6656 CrossRef CAS PubMed.
- X. He, X. Xu, G. Bo and Y. Yan, RSC Adv., 2020, 10, 2180–2190 RSC.
- Y.-L. Chen, Z.-A. Hu, Y.-Q. Chang, H.-W. Wang, Z.-Y. Zhang, Y.-Y. Yang and H.-Y. Wu, J. Phys. Chem. C, 2011, 115, 2563–2571 CrossRef CAS.
- M. Varga, T. Izak, V. Vretenar, H. Kozak, J. Holovsky, A. Artemenko, M. Hulman, V. Skakalova, D. S. Lee and A. Kromka, Carbon, 2017, 111, 54–61 CrossRef CAS.
- M. Chandra, K. Bhunia and D. Pradhan, Inorg. Chem., 2018, 57, 4524–4533 CrossRef CAS PubMed.
- Y. Yan, H. Yang, Z. Yi, T. Xian, R. Li and X. Wang, Desalin. Water Treat., 2019, 170, 349–360 CrossRef CAS.
- J. Tauc, R. Grigorovici and A. Vancu, Phys. Status Solidi B, 1966, 15, 627–637 CrossRef CAS.
- Z. Huang, L. Wang, H. Wu, H. Hu, H. Lin, L. Qin and Q. Li, J. Alloys Compd., 2022, 896, 163045 CrossRef CAS.
- M. Tanveer, C. Cao, I. Aslam, Z. Ali, F. Idrees, M. Tahir, W. S. Khan, F. K. Butt and A. Mahmood, RSC Adv., 2014, 4, 63447–63456 RSC.
- P. Borthakur, P. K. Boruah, G. Darabdhara, P. Sengupta, M. R. Das, A. I. Boronin, L. S. Kibis, M. N. Kozlova and V. E. Fedorov, J. Environ. Chem. Eng., 2016, 4, 4600–4611 CrossRef CAS.
- Z. Chen, S. Berciaud, C. Nuckolls, T. F. Heinz and L. E. Brus, ACS Nano, 2010, 4, 2964–2968 CrossRef CAS PubMed.
- S. Iqbal, A. Bahadur, A. Saeed, K. Zhou, M. Shoaib and M. Waqas, J. Colloid Interface Sci., 2017, 502, 16–23 CrossRef CAS PubMed.
- P. Madhusudan, J. Zhang, B. Cheng and G. Liu, CrystEngComm, 2013, 15, 231–240 RSC.
- Y. Quan, M. Zhang, G. Wang, L. Lu, Z. Wang, H. Xu, S. Liu and Q. Min, New J. Chem., 2019, 43, 10906–10914 RSC.
- Q. Yang, X. Guo, W. Wang, Y. Zhang, S. Xu, D. H. Lien and Z. L. Wang, ACS Nano, 2010, 4, 6285–6291 CrossRef CAS PubMed.
- T. Dürkop, S. A. Getty, E. Cobas and M. S. Fuhrer, Nano Lett., 2004, 4, 35–39 CrossRef.
- İ. Taşçıoğlu, U. Aydemir and Ş. Altındal, J. Appl. Phys., 2010, 108, 064506 CrossRef.
- I. Ullah, M. Shah, M. Khan and F. Wahab, J. Electron. Mater., 2016, 45, 1175–1183 CrossRef CAS.
- M. Soylu and B. Abay, Phys. E, 2010, 43, 534–538 CrossRef CAS.
- S. Sil, A. Dey, J. Datta, M. Das, R. Jana, S. Halder, J. Dhar, D. Sanyal and P. P. Ray, Mater. Res. Bull., 2018, 106, 337–345 CrossRef CAS.
- M. Das, J. Datta, A. Dey, R. Jana, A. Layek, S. Middya and P. P. Ray, RSC Adv., 2015, 5, 101582–101592 RSC.
- D. Das, M. Das, S. Sil, P. Sahu and P. P. Ray, ACS Omega, 2022, 7, 26483–26494 CrossRef CAS PubMed.
- S. Khanchandani, S. Kundu, A. Patra and A. K. Ganguli, J. Phys. Chem. C, 2013, 117, 5558–5567 CrossRef CAS.
- J.-M. Herrmann, Catal. Today, 1999, 53, 115–129 CrossRef CAS.
- Y. Ye, H. Yang, H. Zhang and J. Jiang, Environ. Technol., 2020, 41, 1486–1503 CrossRef CAS PubMed.
- S. Rawalekar, S. Kaniyankandy, S. Verma and H. N. Ghosh, J. Phys. Chem. C, 2011, 115, 12335–12342 CrossRef CAS.
- D. K. Padhi and K. Parida, J. Mater. Chem. A, 2014, 2, 10300–10312 RSC.
- E. Alimohammadi, V. Mahdikhah and S. Sheibani, Appl. Surf. Sci., 2022, 598, 153816 CrossRef CAS.
- L. Huang, F. Peng, H. Yu and H. Wang, Solid State Sci., 2009, 11, 129–138 CrossRef CAS.
- M. Wang, L. Sun, Z. Lin, J. Cai, K. Xie and C. Lin, Energy Environ. Sci., 2013, 6, 1211 RSC.
- Y. Du, Z. Niu, T. Yan, K. Zhu, Y. Yu and Z. Jing, Front. Mater. Sci., 2021, 15, 241–252 CrossRef.
- Z. Zhang, S. Zhai, M. Wang, H. Ji, L. He, C. Ye, C. Wang, S. Fang and H. Zhang, J. Alloys Compd., 2016, 659, 101–111 CrossRef CAS.
Footnote |
| † Electronic supplementary information (ESI) available: Device fabrication method, calculation of bandgap and dielectric constant, weight (%) test of CNT, charge transfer characteristics of CNT, adsorption of RhB by the catalysts, photodegradation process, function of H2O2 in the degradation process, optimization of the composite material with different CNT content, identification of reactive species, recycling test, photocatalytic activity of a non-azo dye, Fig. S1–S9, and eqn (S1) and (S2). See DOI: https://doi.org/10.1039/d3na00204g |
| This journal is © The Royal Society of Chemistry 2023 |

