 Open Access Article
Experimental probing of dynamic self-organized columnar assemblies in colloidal liquid crystals†
Taiki
Hoshino‡
 *abc,
Masanari
Nakayama‡
 *d,
Yoshihiro
Hosokawa
d,
Kohei
Mochizuki
d,
Satoshi
Kajiyama
 d,
Yoshiki
Kohmura
b and
Takashi
Kato
 *de
*de
aInternational Center for Synchrotron Radiation Innovation Smart (SRIS), Tohoku University, 2-1-1 Katahira, Aoba-ku, Sendai 980-8577, Japan. E-mail: taiki.hoshino.c7@tohoku.ac.jp
bRIKEN SPring-8 Center, 1-1-1, Kouto, Sayo-cho, Sayo-gun, Hyogo 679-5148, Japan
cInstitute of Multidisciplinary Research for Advanced Materials (IMRAM), Tohoku University, 2-1-1 Katahira, Aoba-ku, Sendai 980-8577, Japan
dDepartment of Chemistry and Biotechnology, School of Engineering, The University of Tokyo, 7-3-1, Hongo, Bunkyo-ku, Tokyo 113-8656, Japan. E-mail: masanarinakayama@gmail.com; kato@chiral.t.u-tokyo.ac.jp
eResearch Initiative for Supra-Materials, Shinshu University, 4-17-1, Wakasato, Nagano, Japan
First published on 19th May 2023
Abstract
Self-organized supramolecular assemblies are widespread in nature and technology in the form of liquid crystals, colloids, and gels. The reversible nature of non-covalent bonding leads to dynamic functions such as stimuli-responsive switching and self-healing, which are unachievable from an isolated molecule. However, multiple intermolecular interactions generate diverse conformational and configurational molecular motions over various time scales in their self-assembled states, and their specific dynamics remains unclear. In the present study, we have experimentally unveiled the static structures and dynamical behaviors in columnar colloidal liquid crystals by a coherent X-ray scattering technique using refined model samples. We have found that controlling the size distribution of the colloidal nanoplates dramatically changed their static and dynamic properties. Furthermore, the resulting dynamical behaviors obtained by X-ray photon correlation spectroscopy have been successfully decomposed into multiple distinct modes, allowing us to explore the dynamical origin in the colloidal liquid-crystalline state. The present approaches using a columnar liquid crystal may contribute to a better understanding of the dynamic nature of molecular assemblies and dense colloidal systems and bring valuable insights into rational design of functional properties of self-assembled materials such as stimuli-responsive liquid crystals, self-healing gels, and colloidal crystals. For these materials, the motion of constituent particles and molecules in the self-assembled state is a key factor for structural formation and dynamically responsive performance.
1 Introduction
For self-assembled materials such as liquid crystals, a variety of molecules or particles spontaneously organize into ordered assemblies.1–7 They show dynamical and responsive functions that cannot be obtained from a single molecular component. A colloidal liquid crystal is one of the self-assembled functional materials.7–12 The components with anisotropic shapes of particles form ordered and mobile assembled states. Recently we reported that biomineralization-inspired colloidal liquid crystals were formed based on calcium carbonate (CaCO3)13,14 and hydroxyapatite15–18 particles complexed with an acidic macromolecule, poly(acrylic acid) (PAA). For hydroxyapatite-based liquid crystals, stimuli responsive properties and biofunctions, e.g., magnetic field responsive colloidal liquid crystals composed of nanorods, were reported.16,18,19There has been an attractive challenge of capturing the dynamic nature of functional self-organized soft materials for designing their material applications. For further functionalization of these colloidal nanorod liquid crystals, it is important to understand the dynamic nature of the materials in their self-organized states. Our intention is to examine the dynamic behaviors of colloidal columnar liquid-crystalline (LC) phases displayed by plate-like nanoparticles in aqueous solution. X-ray photon correlation spectroscopy (XPCS) is a powerful technique for probing the dynamics of opaque concentrated colloidal systems and heterogeneous dynamics on a wide range of spatial scales by analyzing the temporal fluctuations of the scattered speckles obtained by partially coherent X-ray scattering.20–27 We previously studied the behavior of nematic colloidal liquid crystals formed by biomineral-based rod-like hybrids by XPCS.28 We observed that they exhibited faster dynamics in the direction of the director than in the perpendicular direction in the LC phase when kept for a long period.
Simulation studies on colloidal liquid crystals suggested that the dynamics of rod-like and plate-like particles are quite different.29–31 The diffusion in the direction parallel to the nematic director is faster than the diffusion in the direction perpendicular to the director in rod-like particles in the liquid crystal colloid phase, while the opposite tendency can appear in plate-like liquid crystal colloids. Experimental studies on dynamics of rod-like colloids in LC phases were performed;28,32–34 however, the dynamics of plate-like colloids were only studied for isotropic and lamellar phases.35–37 The experimental measurement for the columnar colloidal liquid crystals composed of plate-like particles has not yet been performed. It is expected that the dynamical behavior of well-controlled plate-like colloids in the LC phase can provide significant information for understanding colloidal dynamic properties.
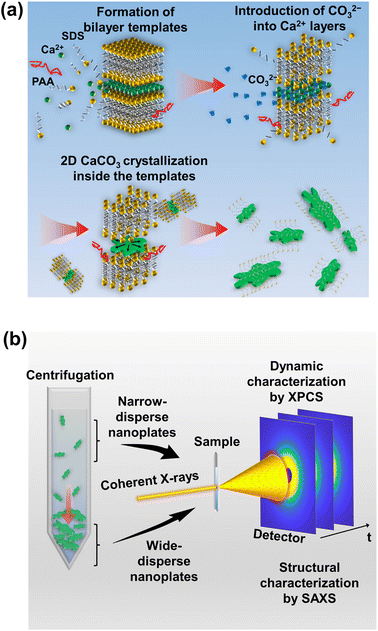
Here, we report new colloidal liquid crystals formed by biomineralization-inspired hybrid plate-like nanoparticles and their dynamical properties using XPCS (Fig. 1). We also show that acidic molecules of sodium dodecyl sulfonate (SDS) and PAA are available as a new synthetic template mixture for the preparation of colloidal CaCO3 nanoplates (Fig. 1a).
2 Results and discussion
We have developed a biomineralization-inspired method for synthesizing CaCO3 nanoplates (Fig. 1a). Furthermore, narrow-disperse nanoplates were fractionated from wide-disperse nanoplates by centrifugation processes, and the static structures and dynamical behavior were characterized using X-ray scattering measurements (Fig. 1b).2.1 Synthesis of nanoplates
The nanoplates were obtained by crystal growth of CaCO3 in new bilayer templates. The procedure for preparing templates using SDS and PAA molecules and subsequently synthesizing nanoplates is shown below.In the initial synthetic procedure, SDS and PAA molecules were dissolved in an aqueous CaCl2 solution. The electrostatic interactions among these molecular components and Ca2+ ions resulted in the formation of layered structures of Ca2+ ions covered with dodecyl sulfonate (DS−) bilayers that functioned as a template for two-dimensional (2D) crystal growth of CaCO3. The 2D morphologies of layered templates were confirmed by scanning electron microscopy (SEM) observation (Fig. S1†). The X-ray diffraction (XRD) measurements of the layered templates revealed an interlayer distance of 30.1 Å, which was consistent with the value previously reported (Fig. S2†).38 On the other hand, no change of the interlayer distance was observed by varying the concentration of PAA in the XRD patterns (Fig. S2†), which suggests that PAA molecules existed outside the templates. Thermogravimetric (TG) analysis showed the presence of organic compounds together with Ca2+ ions in the template (Fig. S3†), and energy-dispersive X-ray spectroscopy (EDS) analysis revealed a 1![[thin space (1/6-em)]](https://www.rsc.org/images/entities/char_2009.gif) :
:![[thin space (1/6-em)]](https://www.rsc.org/images/entities/char_2009.gif) 2 molar ratio of Ca2+ ions to sulfonate groups (Fig. S4†), which is well in accordance with the layered structures.
2 molar ratio of Ca2+ ions to sulfonate groups (Fig. S4†), which is well in accordance with the layered structures.
The addition of Na2CO3 after template formation was expected to induce dissociation of a part of the DS− molecules from the Ca2+ ions in the template and replacement with the CO32− ions, which induced the crystallization of CaCO3. We also expected the residual DS− molecules to act as a template for 2D crystal growth. In the time course of crystallization tracked by XRD measurements and Fourier-transform infrared (FTIR) spectroscopy (Fig. S5†), the peaks attributed to calcium dodecyl sulfonate crystals were observed before the addition of Na2CO3, whereas the peaks characteristic of calcite, which is a polymorph of CaCO3 crystals, appeared 1 h after the addition of Na2CO3. In 72 h, only the peaks for calcite crystals were identified, which shows that the crystal growth of CaCO3 was completed in the templates.
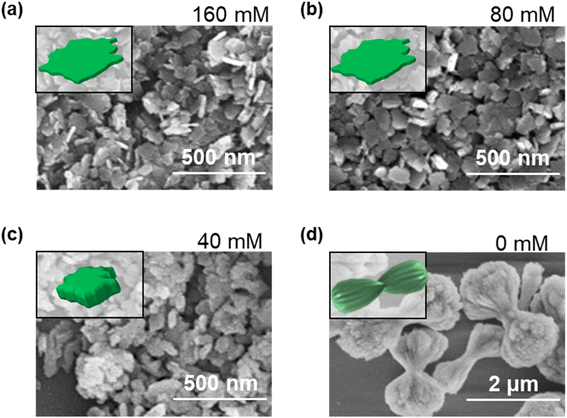
Fig. 2 shows the SDS concentration dependence of the morphology of the precipitates at a PAA concentration of 0.14 wt%, which was observed by SEM. When the SDS concentration was over 80 mM, plate-like crystals were obtained. For a concentration below 80 mM, no plate-like particles but thick aggregates and dumbbell-shaped crystals were formed due to the absence of 2D templates. The effects of the concentration of PAA were examined as shown in Fig. S6,† the SEM images of the precipitates at an SDS concentration of 80 mM. In the absence of PAA, larger plates were formed (Fig. S6a†), which suggests that PAA molecules suppressed excessive crystal growth of CaCO3 and imparted a uniformity in the particle size. When the PAA concentration increased from 0.14 to 0.29 wt%, no defined crystal morphologies were observed (Fig. S6c†) probably because PAA interfered with DS− binding with Ca2+ ions, and inhibited the formation of 2D templates. The inorganic/organic composite structures of nanoplates were examined by TG analysis. Organic compounds and CaCO3 decomposed at around 200 and 600 °C, respectively, and the weight fraction of organic components in the template was estimated to be 11.4 wt% (Fig. S7†). The EDS analysis revealed a molar ratio of Ca2+ ions to sulfonate groups of 1![[thin space (1/6-em)]](https://www.rsc.org/images/entities/char_2009.gif) :
:![[thin space (1/6-em)]](https://www.rsc.org/images/entities/char_2009.gif) 0.04 in the nanoplate particles (Fig. S8†). This ratio means that 4.84 DS− molecules per 1 nm2 were adsorbed on the surfaces of the nanoplates. The dense DS− molecules can form bilayers on the nanoplate surfaces. Indeed, the zeta potential of the particle surfaces was −23.4 ± 6 mV, and the negative electrostatic forces stabilized colloidal dispersion (Fig. S9†).
0.04 in the nanoplate particles (Fig. S8†). This ratio means that 4.84 DS− molecules per 1 nm2 were adsorbed on the surfaces of the nanoplates. The dense DS− molecules can form bilayers on the nanoplate surfaces. Indeed, the zeta potential of the particle surfaces was −23.4 ± 6 mV, and the negative electrostatic forces stabilized colloidal dispersion (Fig. S9†).
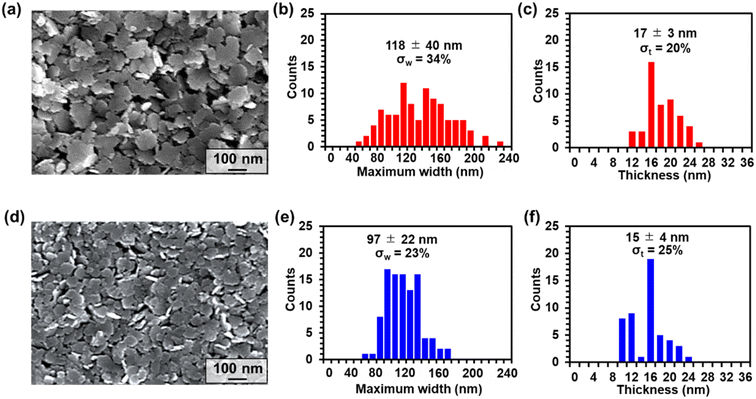
Tuning the SDS concentration to 80 mM and the PAA concentration to 0.14 wt%, we have successfully achieved the synthesis of plate-like CaCO3 crystals as shown in the SEM image in Fig. 3a. The CaCO3 nanocrystals affected by the organic matrix exhibit thin nanoplate morphologies. In the synthetic processes, SDS and PAA played significant roles in the morphological control of the CaCO3 nanoplates. Although the shape of the nanoplates was inhomogeneous, the maximum widths and the thicknesses were estimated to be 118 ± 40 nm and 17.4 ± 3.5 nm, respectively, based on the SEM observations (Fig. 3b and c). The relative standard deviations of the maximum width σw and the thickness σt were 34% and 20%, respectively. The nanoplates had a broad width distribution and were named as wide-disperse nanoplates. If nanoplates with a narrower size distribution were obtained, deeper analysis of the structure and dynamical behavior would be expected. By further centrifuging the supernatant of the wide-disperse nanoplates, nanoplates with a narrower width distribution were fractionated (Fig. 3d), and were namednarrow-disperse nanoplates. In this case, the maximum widths and the thicknesses were estimated to be 97 ± 22 nm and 14.9 ± 3.7 nm, respectively (Fig. 3e and f) and the relative standard deviations of the maximum width σw and the thickness σt were 23 and 25%, respectively, indicative of the significant reduction in the polydispersity of the maximum width compared with that of wide-disperse nanoplates. The polydispersity changes were also observed as the difference in optical transparency for the colloidal dispersions of wide-disperse and narrow-disperse nanoplates (Fig. S10†).
2.2 Static and dynamic characterization by X-ray scattering measurements
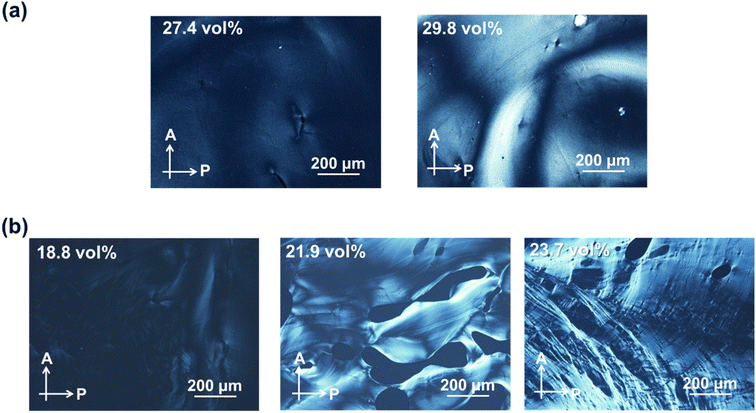
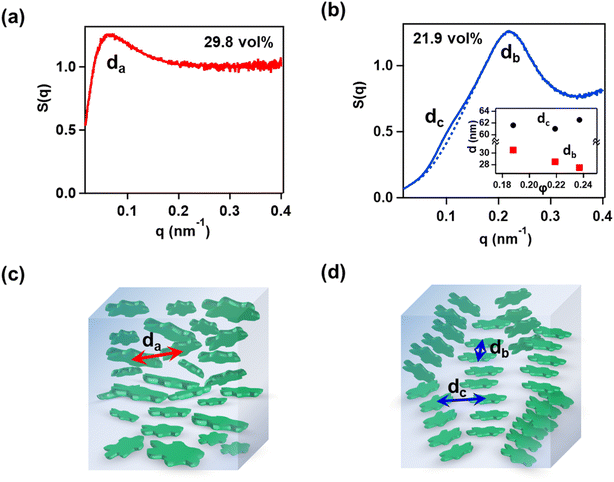
The self-assembly of dispersed nanoplates resulted in the formation of specific morphologies. While forming a specific morphology, the nanoplates are not completely stationary, but dynamically fluctuate due to the thermal motion of the solvent molecules. Both static structures and dynamic properties are important for their functional properties. To investigate these properties, we conducted coherent X-ray scattering measurements in the small-angle X-ray scattering (SAXS) geometry (see Section 4.3 for details). This setup enabled us to analyze both the static structure and dynamic properties under the same conditions. By analyzing scattering images obtained from a certain exposure time, we could evaluate the static structures through SAXS profiles. Meanwhile, we performed XPCS analysis on the fluctuations of scattering images obtained through time-resolved measurements to evaluate dynamics.In the SAXS measurements, isotropic 2D images were obtained at all the measured concentrations for both wide-disperse and narrow-disperse nanoplates (Fig. S11a and S12a†). It indicates that even in the LC phase, the domain size is sufficiently smaller than the X-ray irradiation volume (ca. 0.02 × 0.02 × 2 mm3). The intensity profiles I(q), where q is the scattering vector, showed differences between wide-disperse and narrow-disperse nanoplates (Fig. S11b and S12b†). The structure factor S(q) can be obtained by dividing I(q) by that for the diluted dispersion (Fig. S11c and S12c†). The representative S(q) for wide-disperse nanoplates at 29.8 vol% and narrow-disperse nanoplates at 21.9 vol% is shown in Fig. 5a and b, respectively. S(q) for the wide-disperse nanoplates has only one peak at q = 0.067 nm−1. This suggests that the LC phase of the wide-disperse nanoplates was a discotic nematic (ND) phase, with an average interparticle distance (da) of 94 nm as schematically shown in Fig. 5c. On the other hand, for the narrow-disperse nanoplates, S(q) has a peak and a shoulder at different q values of around 0.220 nm−1 and 0.103 nm−1, respectively. This suggests that the LC phase of narrow-disperse nanoplates was a columnar nematic (NC) phase, with an intra-columnar distance (db) of 29 nm and an inter-columnar distance (dc) of 61 nm as schematically shown in Fig. 5d.39–41 Reasonably, the intra-columnar and inter-columnar distances were larger than the thickness and the minimum width of the nanoplates, respectively. db decreased on increasing the concentration although dc had no clear concentration dependence (Fig. 5b inset). The lack of a clear concentration dependence of dc can be due to the inhomogeneous in-plane morphologies of the nanoplates.
Similar SAXS profiles suggesting two short-range orders were previously observed in columnar nematic phases for plate-like particles such as Al(OH)3 nanoplates,39 Sb3P2O143− nanosheets,40 and CeF3 nanodisks.42 A Schlieren texture similar to that in Fig. 4b was also observed by POM in a columnar nematic phase of lyotropic discotic liquid crystals.43 These previous reports support the presence of the columnar nematic phase for narrow-disperse nanoplates, which were analyzed combining POM and SAXS.
| g2(q, t) = 〈I(q, t′)I(q, t′ + t)〉/〈I(q, t′)〉2, | (1) |
g2(q, t) = β![[thin space (1/6-em)]](https://www.rsc.org/images/entities/char_2009.gif) exp exp![[thin space (1/6-em)]](https://www.rsc.org/images/entities/char_2009.gif) [−2(Γt)α] + 1, [−2(Γt)α] + 1, | (2) |
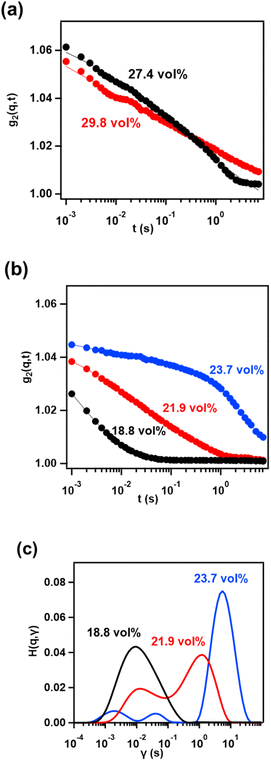
Fig. 6b shows the plots of g2 at q = 0.0426 nm−1 as representative data for the colloidal dispersions of narrow-disperse nanoplates at different concentrations of 18.8, 21.9, and 23.7 vol%. The relaxation slowed down on increasing the concentration. The significant slowdown on increasing the concentration, despite the small change in the interparticle distance, is a similar feature to that of our previously reported nanorod colloidal liquid crystals.28 Focusing on g2 at 23.7 vol%, inflection points that indicate the existence of several relaxation modes were found, rather than extremely stretched relaxation as observed in the wide-disperse systems. Therefore, we performed Laplace transform analysis to decompose the relaxation modes. The Siegert relationship relates g2 to the intermediate scattering function g1,44
| g2(q, t) = β[g1(q, t)]2 + 1. | (3) |
We performed the Laplace transform via CONTIN analysis for the experimentally obtained g2.45 In the analysis, g1 was expressed by using the following function with a continuous distribution of exp(−γt) given by
| g1(q, t) = A∫H(q, γ)exp(−γt)dγ, | (4) |
Based on the results of the Laplace transform analysis, we performed the fitting analysis by substituting the following g1 into eqn (3),
 | (5) |
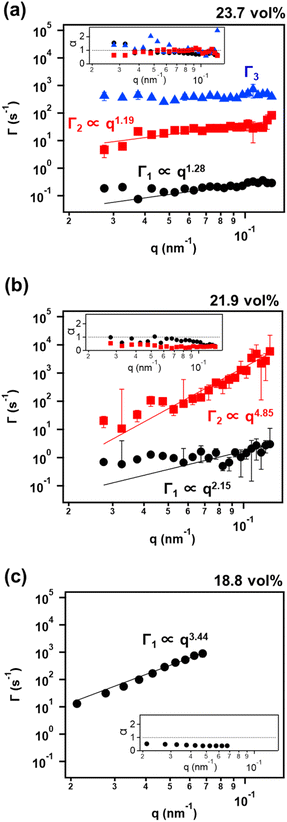
The obtained q dependences of Γi and αi are shown in Fig. 7. For a concentration of 23.7 vol%, three relaxation modes were obtained. The q dependences of Γi were Γ1 ∝ q1.28 and Γ2 ∝ q1.19 for the two slow modes, and Γ3 had no clear q dependence for the fast mode (Fig. 7a). Note that the exponents of αi (i = 1, 2, 3) should be regarded as αi > 1 although they approximately take 1 because αi could be reduced by the effect of the particle size polydispersity which was more than 20% even in the narrow-disperse systems as shown in Fig. 3. The behaviors of Γi ∝ qn (n < 2) and αi > 1 (i = 1, 2) can be attributed to hyperdiffusive motions, which have been frequently observed in concentrated particle systems such as colloidal glasses and gels, due in part to a series of discrete rearrangement events.46 On the other hand, Γ3, which is q-independent and much faster than the other two modes, may originate from a rotational diffusion, in reference to past studies for plate-like colloids.36,37
For 21.9 vol%, two different types of motion were observed. The faster dynamics (Γ2) behaved as Γ2 ∝ q4.85, α2 < 1 as shown in Fig. 7b. The behavior of Γ2 ∝ qn (n > 2) and α2 < 1 can represent the subdiffusive motions which have been observed in systems where particle motions are constrained.47–50 On the other hand, the slower dynamics (Γ1) behaved as Γ1 ∝ q2.15, α1 ∼ 1, representing almost simple diffusive motion. These behaviors are quite different from those for 23.7 vol%. The differences may arise from the increased inter-particle distance. As the inter-particle distance increases, the effect of the electrostatic interaction increases relative to the effect of excluded volume due to particle collisions. In such a situation, individual nanoplates can be trapped in cages, keeping a constant distance from the neighboring nanoplates under an electrostatic repulsive force. Such a cage effect based on inter-particle interactions suppresses diffusive motions of the particles, resulting in subdiffusive behaviors.48,50,51 The behaviors of the individual nanoplates changed from hyperdiffusive to subdiffusive dynamics when the concentration decreased from 23.7 to 21.9%, as with the case of a dense colloidal ellipsoid system.34 The subdiffusive dynamical behavior observed at 18.8 vol%, Γ1 ∝ q3.44, α1 < 1 (Fig. 7c), is also understood to be due to the effect of trapping by the electrostatic interactions. The change from hyperdiffusive to subdiffusive motion with increasing interparticle distance might be universal in certain dense colloidal systems. There are only a few reported studies, and further investigation is needed.
The dynamics of anisotropic colloidal particles is governed by a complex interplay of factors such as particle shape, size, interparticle distance, excluded volume effects, electrostatic interactions, and hydrodynamic interactions. Despite the limited experimental data available on the dynamics of anisotropic particles, simulation studies have been vigorously conducted with the developing calculations of interparticle interactions.29–31,52,53 Combined with findings from experiments and simulations, it would be possible to gain a deeper understanding of anisotropic particle dynamics.
3 Conclusions
In conclusion, we have prepared CaCO3 nanoplates with uniform thickness by a bio-inspired method using organic molecular templates combining SDS and PAA for 2D crystal growth of CaCO3. The narrow-disperse nanoplates were isolated through size-fractionation using centrifugation. The POM and SAXS measurements revealed that the narrow-disperse nanoplates formed the NC phase instead of the ND phase without columnar structures. In the NC phase, three distinct non-diffusive dynamics were clarified with the XPCS-based analytical techniques combined with the Laplace transform for the designed colloidal liquid crystals with simpler and slower dynamics than molecular liquid crystals. These dynamical behaviors were analyzed in association with the relaxation rates, the q dependences of the relaxation rates, and the magnitudes of the stretched or compressed exponents. We believe that our experimental analyses will disclose underlying mechanisms in the dynamic and responsive phenomena of self-organized supramolecular columnar assemblies, contributing to their further functionalization.4 Experimental
4.1 Synthesis of the nanoparticles
A 160 mM aqueous SDS (obtained from Wako) solution containing PAA (MW = 2.0 × 10³, 2.9 × 10⁻¹ wt%, obtained from Polysciences) was mixed with an equal volume of 200 mM aqueous CaCl2 (obtained from Wako) solution. After 1 h of vigorous stirring of the mixed solution, an equal volume of 100 mM aqueous Na2CO3 (obtained from Kanto Chemical) solution was added, and the mixture was stirred for 5 days at room temperature. The resulting colloidal solution was filtered, and the residual precipitates were then centrifuged for 15 min at 10![[thin space (1/6-em)]](https://www.rsc.org/images/entities/char_2009.gif) 000 rpm.
000 rpm.
To remove excess salts, the precipitates were dispersed in an equal volume of 40 mM aqueous SDS solution and centrifuged again for 15 min at 10![[thin space (1/6-em)]](https://www.rsc.org/images/entities/char_2009.gif) 000 rpm. Subsequently, an aqueous solution of 40 mM SDS was added to the precipitates to obtain colloidal dispersions of wide-disperse nanoplates with adjusted nanoplate concentrations.
000 rpm. Subsequently, an aqueous solution of 40 mM SDS was added to the precipitates to obtain colloidal dispersions of wide-disperse nanoplates with adjusted nanoplate concentrations.
The supernatant after collecting wide-disperse nanoplates was further centrifuged for 90 min at 10![[thin space (1/6-em)]](https://www.rsc.org/images/entities/char_2009.gif) 000 rpm. Then, the sediment was dispersed in an equal volume of 40 mM aqueous SDS solution and centrifuged again for 90 min at 10
000 rpm. Then, the sediment was dispersed in an equal volume of 40 mM aqueous SDS solution and centrifuged again for 90 min at 10![[thin space (1/6-em)]](https://www.rsc.org/images/entities/char_2009.gif) 000 rpm. Finally, narrow-disperse nanoplates with adjusted nanoplate concentrations were obtained by addition of an aqueous solution of 40 mM SDS to the sediment.
000 rpm. Finally, narrow-disperse nanoplates with adjusted nanoplate concentrations were obtained by addition of an aqueous solution of 40 mM SDS to the sediment.
4.2 Characterization of the nanoparticles
XRD patterns were recorded using a SmartLab (Rigaku) diffractometer with Cu Kα radiation. FTIR spectra were recorded on a Jasco FT/IR-6100 spectrometer (Jasco) with the KBr method. TG measurements (Rigaku, TG-8120) were performed up to 1000 °C at a heating rate of 10 °C min−1 under an air flow (100 mL min−1). The optical properties of the samples were observed using a POM (Olympus, BX53). The crystal morphologies were examined using SEM (Hitachi, S-4700) after applying conductive treatment with a Hitachi E-1030 ion sputterer. Transmission electron microscope (TEM) observations were performed with a conventional TEM (JEOL, JEM-2000EX and JEM-2800, operated at 200 and 100 kV, respectively). The EDS analyses were conducted with a selected-area electron probe, for supporting grid free 2D templates and wide-disperse CaCO3 nanoplates. Zeta potential measurements were conducted with a Zetasizer (Nano-ZS, from Malvern Instruments Ltd). UV-vis transmittance spectra were recorded using a JASCO FS-110 spectrometer.4.3 X-ray scattering measurements
The SAXS and XPCS measurements were conducted on BL29XUL at SPring-8.54 The undulator source and Si(111) monochromator were tuned to an energy of 12.40 keV and higher harmonic X-rays were removed using Pt-coated mirrors. The sample was irradiated with partially coherent X-rays obtained by passing the beam through 20 × 20 μm2 slits. The scattered X-rays were detected using an EIGER 1 M 2D detector (Dectris, Switzerland) mounted approximately 6 m downstream of the sample. For X-ray scattering measurements, the samples were sealed in 10 μm-thick quartz capillary tubes with a diameter of 2 mm. All the X-ray scattering measurements were conducted after 2 or 3 days after sealing at room temperature.The SAXS and XPCS data were obtained from the same sample and setup. The SAXS analysis of the static structure was performed from scattering images obtained with an exposure time of 1 s. On the other hand, the XPCS analysis of the dynamic behavior was performed by the time-resolved measurements of 10![[thin space (1/6-em)]](https://www.rsc.org/images/entities/char_2009.gif) 000 frames with an exposure time of 1 ms.
000 frames with an exposure time of 1 ms.
Conflicts of interest
There are no conflicts to declare.Acknowledgements
The X-ray scattering experiments at beam line BL29XUL were performed with the approval of RIKEN (Proposals No. 20200048, and No. 20210006). This study was partially supported by KAKENHI JP19H05715 (Grant-in-Aid for Scientific Research on Innovative Areas of Aquatic Functional Materials, No. 6104). T. H. acknowledges the partial support of JSPS KAKENHI Grant No. JP23H05403.References
- Handbook of Liquid Crystals, ed. J. W. Goodby, P. J. Collings, T. Kato, C. Tschierske, H. Gleeson and P. Raynes, Wiley-VCH, Weinheim, 2nd edn, 2014 Search PubMed.
- J. Uchida, B. Soberats, M. Gupta and T. Kato, Adv. Mater., 2022, 34, 2109063 CrossRef CAS PubMed.
- H. K. Bisoyi and Q. Li, Chem. Rev., 2021, 122, 4887–4926 CrossRef PubMed.
- J. P. F. Lagerwall and G. Scalia, Curr. Appl. Phys., 2012, 12, 1387–1412 CrossRef.
- T. Kato, J. Uchida, T. Ichikawa and T. Sakamoto, Angew. Chem., Int. Ed., 2018, 57, 4355–4371 CrossRef CAS PubMed.
- I. Dierking and S. Al-Zangana, Nanomaterials, 2017, 7, 305 CrossRef PubMed.
- T. Kato, M. Gupta, D. Yamaguchi, K. P. Gan and M. Nakayama, Bull. Chem. Soc. Jpn., 2021, 94, 357–376 CrossRef CAS.
- F. M. van der Kooij and H. N. W. Lekkerkerker, J. Phys. Chem. B, 1998, 102, 7829–7832 CrossRef CAS.
- J. C. Gabriel, F. Camerel, B. J. Lemaire, H. Desvaux, P. Davidson and P. Batail, Nature, 2001, 413, 504–508 CrossRef CAS PubMed.
- N. Miyamoto and T. Nakato, Adv. Mater., 2002, 14, 1267–1270 CrossRef CAS.
- Z. Xu and C. Gao, Nat. Commun., 2011, 2, 571 CrossRef PubMed.
- J. E. Kim, T. H. Han, S. H. Lee, J. Y. Kim, C. W. Ahn, J. M. Yun and S. O. Kim, Angew. Chem., Int. Ed., 2011, 50, 3043–3047 CrossRef CAS PubMed.
- M. Nakayama, S. Kajiyama, T. Nishimura and T. Kato, Chem. Sci., 2015, 6, 6230–6234 RSC.
- M. Nakayama, S. Kajiyama, A. Kumamoto, Y. Ikuhara and T. Kato, Nanoscale Adv., 2020, 2, 2326–2332 RSC.
- M. Nakayama and T. Kato, Acc. Chem. Res., 2022, 55, 1796–1808 CrossRef CAS PubMed.
- M. Nakayama, S. Kajiyama, A. Kumamoto, T. Nishimura, Y. Ikuhara, M. Yamato and T. Kato, Nat. Commun., 2018, 9, 568 CrossRef PubMed.
- S. Kajiyama, H. Iwase, M. Nakayama, R. Ichikawa, D. Yamaguchi, H. Seto and T. Kato, Nanoscale, 2020, 12, 11468–11479 RSC.
- M. Nakayama, W. Q. Lim, S. Kajiyama, A. Kumamoto, Y. Ikuhara, T. Kato and Y. Zhao, ACS Appl. Mater. Interfaces, 2019, 11, 17759–17765 CrossRef CAS PubMed.
- L. A. Benedini, Y. Moglie, J. M. Ruso, S. Nardi and P. V. Messina, Cryst. Growth Des., 2021, 21, 2154–2166 CrossRef CAS.
- M. Sutton, C. R. Phys., 2008, 9, 657–667 CrossRef CAS.
- G. Grübel, A. Madsen and A. Robert, in Soft Matter Characterization, ed. R. Borsali and R. Pecora, Springer Netherlands, Dordrecht, 2008, pp. 954–995 Search PubMed.
- A. Madsen, R. L. Leheny, H. Guo, M. Sprung and O. Czakkel, New J. Phys., 2010, 12, 055001 CrossRef.
- O. Bikondoa, X-Ray Photon Correlation Spectroscopy for the Characterization of Soft and Hard Condensed Matter, in X-ray and Neutron Techniques for Nanomaterials Characterization, ed. C. Kumar, Springer, Berlin, Heidelberg, 2016 Search PubMed.
- T. Hoshino, S. Fujinami, T. Nakatani and Y. Kohmura, Phys. Rev. Lett., 2020, 124, 118004 CrossRef CAS PubMed.
- C. H. Cheng, K. Kamitani, S. Masuda, K. Uno, N. Dechnarong, T. Hoshino, K. Kojio and A. Takahara, Polymer, 2021, 229, 124003 CrossRef CAS.
- T. Hoshino, Y. Okamoto, A. Yamamoto and H. Masunaga, Sci. Rep., 2021, 11, 9767 CrossRef CAS PubMed.
- B. M. Yavitt, L. Wiegart, D. Salatto, Z. Huang, L. Tsapatsaris, M. K. Endoh, S. Poeller, M. Schiel, S. Petrash and T. Koga, ACS Appl. Eng. Mater., 2023, 1, 868–876 CrossRef CAS.
- T. Hoshino, M. Nakayama, S. Fujinami, T. Nakatani, Y. Kohmura and T. Kato, Soft Matter, 2019, 15, 3315–3322 RSC.
- A. Patti, D. El Masri, R. van Roij and M. Dijkstra, Phys. Rev. Lett., 2009, 103, 248304 CrossRef PubMed.
- A. Patti, S. Belli, R. van Roij and M. Dijkstra, Soft Matter, 2011, 7, 3533 RSC.
- N. Morillo, A. Patti and A. Cuetos, J. Chem. Phys., 2019, 150, 204905 CrossRef PubMed.
- A. S. Poulos, D. Constantin, P. Davidson, B. Pansu, E. Freyssingeas, A. Madsen and C. Chaneac, J. Chem. Phys., 2010, 132, 091101 CrossRef PubMed.
- A. Pal, V. A. Martinez, T. H. Ito, J. Arlt, J. J. Crassous, W. C. K. Poon and P. Schurtenberger, Sci. Adv., 2020, 6, eaaw9733 CrossRef CAS PubMed.
- A. Pal, M. A. Kamal, P. Holmqvist and P. Schurtenberger, Phys. Rev. Res., 2021, 3, 023254 CrossRef CAS.
- D. Constantin, P. Davidson, E. Freyssingeas and A. Madsen, J. Chem. Phys., 2010, 133, 224902 CrossRef PubMed.
- D. Kleshchanok, M. Heinen, G. Nägele and P. Holmqvist, Soft Matter, 2012, 8, 1584–1592 RSC.
- P. Holmqvist, V. Meester, F. Westermeier and D. Kleshchanok, J. Chem. Phys., 2013, 139, 084905 CrossRef CAS PubMed.
- G. Sakane, M. Tomohara, Y. Katayama and K. Hayashi, Acta Crystallogr., Sect. E: Struct. Rep. Online, 2010, 66, m749 CrossRef CAS PubMed.
- M. C. Mourad, D. V. Byelov, A. V. Petukhov, D. A. Matthijs de Winter, A. J. Verkleij and H. N. Lekkerkerker, J. Phys. Chem. B, 2009, 113, 11604–11613 CrossRef CAS PubMed.
- P. Davidson, C. Penisson, D. Constantin and J. P. Gabriel, Proc. Natl. Acad. Sci. U. S. A., 2018, 115, 6662–6667 CrossRef CAS PubMed.
- M. Zeng, D. King, D. Huang, C. Do, L. Wang, M. Chen, S. Lei, P. Lin, Y. Chen and Z. Cheng, Proc. Natl. Acad. Sci. U. S. A., 2019, 116, 18322–18327 CrossRef CAS PubMed.
- F. Chaput, F. Lerouge, A.-L. Bulin, D. Amans, M. Odziomek, A.-C. Faure, M. Monteil, I. Dozov, S. Parola, F. Bouquet, M. Lecouvey, P. Davidson and C. Dujardin, Langmuir, 2019, 35, 16256–16265 CrossRef CAS PubMed.
- K. Kanie, T. Yasuda, M. Nishii, S. Ujiie and T. Kato, Chem. Lett., 2001, 30, 480–481 CrossRef.
- B. J. Berne and R. Pecora, Dynamic light scattering: with applications to chemistry, biology, and physics, Wiley, New York, 1976 Search PubMed.
- S. W. Provencher, Comput. Phys. Commun., 1982, 27, 229–242 CrossRef.
- L. Cipelletti and L. Ramos, J. Phys.: Condens. Matter, 2005, 17, R253–R285 CrossRef CAS.
- A. Duri and L. Cipelletti, Europhys. Lett., 2006, 76, 972–978 CrossRef CAS.
- J. Sprakel, J. van der Gucht, M. A. Cohen Stuart and N. A. Besseling, Phys. Rev. Lett., 2007, 99, 208301 CrossRef PubMed.
- C. Caronna, Y. Chushkin, A. Madsen and A. Cupane, Phys. Rev. Lett., 2008, 100, 055702 CrossRef PubMed.
- T. Hoshino, D. Murakami, Y. Tanaka, M. Takata, H. Jinnai and A. Takahara, Phys. Rev. E: Stat., Nonlinear, Soft Matter Phys., 2013, 88, 032602 CrossRef PubMed.
- E. R. Weeks and D. A. Weitz, Chem. Phys., 2002, 284, 361–367 CrossRef CAS.
- C. De Michele, R. Schilling and F. Sciortino, Phys. Rev. Lett., 2007, 98, 265702 CrossRef PubMed.
- R. Yamamoto, J. J. Molina and Y. Nakayama, Soft Matter, 2021, 17, 4226–4253 RSC.
- K. Tamasaku, Y. Tanaka, M. Yabashi, H. Yamazaki, N. Kawamura, M. Suzuki and T. Ishikawa, Nucl. Instrum. Methods Phys. Res., Sect. A, 2001, 467, 686–689 CrossRef.
Footnotes |
| † Electronic supplementary information (ESI) available. See DOI: https://doi.org/10.1039/d3na00183k |
| ‡ Equal contribution. |
| This journal is © The Royal Society of Chemistry 2023 |

