Coster–Kronig and super Coster–Kronig transitions from the Xe 4s core-hole state
Yasumasa
Hikosaka
 *a and
Stephan
Fritzsche
 bcd
bcd
aInstitute of Liberal Arts and Sciences, University of Toyama, Toyama 930-0194, Japan. E-mail: hikosaka@las.u-toyama.ac.jp
bTheoretisch-Physikalisches Institut, Friedrich-Schiller-Universität Jena, D-07743 Jena, Germany
cGSI Helmholtzzentrum für Schwerionenforschung GmbH, D-64291 Darmstadt, Germany
dHelmholtz-Institut Jena, D-07743 Jena, Germany
First published on 13th July 2022
Abstract
Coster–Kronig and super Coster–Kronig transitions from the Xe 4s core-hole state are investigated by coincidence detection of all the emitted electrons and product ions. The branching ratios of the transitions are determined by analyzing the coincidence data and comparing them to calculations. Subsequent decay pathways following these first-step Auger decays are also clarified.
I. Introduction
A core-hole state created by inner-shell photoionization of an atom in the soft X-ray regime predominantly undergoes Auger decay, leading to a dication or a higher charged ion. Although Auger spectroscopy is a standard method for studying such electron emission processes, it is often impossible to identify the individual Auger pathways, owing to the overlap of structures associated with different core-hole states and the large number of Auger steps. However, these core-hole states and Auger decay pathways can be disentangled if the photo- and Auger electrons are observed in coincidence.To perform such electron coincidence measurements, magnetic bottle electron spectrometers have been found to be highly efficient. The introduction of this spectrometer into electron coincidence spectroscopy by Eland and co-workers occurred as early as in 1989.1 Its practical use for highly efficient electron coincidence was demonstrated again by Eland et al. in 2003.2 Since then, a good number of Auger decay processes in atoms have been revealed by electron coincidence spectroscopy using a magnetic bottle electron spectrometer,3–11 where the Auger decays of the core-hole states in Xe have been the subject of intensive research. For the 4d core-hole state, for example, an electron coincidence measurement helped to reveal the direct and cascade double Auger pathways.3 For the 4p core-hole states, which are known to be strongly mixed with the 4d−2nf configurations,12 the triple Auger decay was identified along with the single and double Auger decays.5 The strong configuration mixing of the inner-shell holes with the virtual 4f excitations enhances the creation of 4d double core-hole states and multi-electron coincidence spectroscopy supported to clarify the associated sequential Auger decay.11 The Auger decay from the next 4s core-hole state, in contrast, has not yet been studied in detail, while the decays from the 3d core-hole states were investigated and have revealed the most important quadruple Auger decay pathway.9
The power of multi-electron coincidence measurements can be boosted further if ions are also measured in coincidence, because various Auger processes that lead to different ion products can thus be distinguished by means of the additional coincidence. Indeed, efficient multi-electron–ion coincidence measurements of multiple Auger decays in Xe have been implemented with magnetic bottle electron spectrometers by applying the ion detection capability.13,14 The branching ratios to product ions from individual core-hole states in Xe was investigated by a multi-electron–ion coincidence measurement.13 In another study, the important quadruple Auger decay pathway from the 3d core-hole states could be clearly isolated by measuring the Xe5+ ion in coincidence.14
In this study, the Auger decay of the Xe+ 4s−1 state has been investigated by multi-electron–ion coincidence spectroscopy. This core-hole state is characterized by a wide natural width (2.9 eV15), which is caused by its Coster–Kronig (CK) and super Coster–Kronig (SCK) type electron emission. Conventional Auger spectroscopy can hardly provide information on the Auger decay paths from the 4s−1 state and the transition rates, because these 4s Auger structures are almost hidden behind the intense structures associated with other core-hole states. Until the present, however, the SCK transition to the 4d−2 states has only been identified in the multi-electron coincidence study of the 4d double photoionization.11 A photoelectron–ion coincidence measurement revealed important formations of XeZ+ ions with Z = 3–5 in the 4s Auger decay.13 In the present work, the probabilities of the CK and SCK transitions and the subsequent decay pathways after these transitions are analyzed and clarified by coincidence detections of the emitted electrons and product ions.
II. Experimental
The experiment was carried out at the bending-magnet beamline BL4B of the UVSOR synchrotron facility. The electron storage ring was operated in the single-bunch and top-up injection mode, providing light pulses with 110 ps width and at a 178 ns repetition period. A magnetic bottle electron spectrometer16 with ion detection capability17 was employed in order to perform multi-electron–ion coincidence spectroscopy. Electrons emitted by the interaction between the photons and sample gases were captured over the entire 4π solid angle by an inhomogeneous magnetic field and then guided by the uniform magnetic field through a 1.5 m flight path to a microchannel plate detector of 90% open area ratio (Hamamatsu F2225-21P, funnel-processed).14 According to the first electron detection after the incidence of each synchrotron light pulse, the interaction region was polarized by a pulsed electric field in order to extract ions toward the same detector. The heights of the high voltage pulses applied to the repeller and extractor electrodes17 were 2 kV and 1.8 kV, respectively. The data acquisition scheme for measuring the long flight time of electrons and ions beyond the light pulse repetitions is described elsewhere.17A multi-electron–ion coincidence measurement was implemented for Xe at a photon energy of 391.7 eV and with a bandwidth of ∼0.2 eV. This photon energy is high enough to ionize a 4s electron (binding energy of 213.32 eV15), but well below the binding energy of the deeper 3d electron. The measurements were carried out over five hours. The local pressure around the ionization region was estimated to be around 1 × 10⁻³ Pa. The intensity of the incident light was adjusted so that the count rate becomes about 2000 counts per sec for this pressure. Fig. 1 shows a time-of-flight spectrum of all the detected electrons and ions. In this spectrum, electron structures appear within the first 3 μs, while the ions follow only after 8 μs. The energy resolution of the electrons was nearly constant at around 3% of the kinetic energy, over a kinetic energy range below 600 eV. The electron detection efficiency is fairly constant at around 70% in this kinetic energy range.17 The peaks for the formations of different XeZ+ ions are well resolved in Fig. 1, where the XeZ+ ions (Z > 6) were produced by second-order light. It was estimated that the ion detection efficiencies for XeZ+ depend on the charge states and are 39%, 71%, 80%, 85% and 85% for Z = 1–5, respectively.17
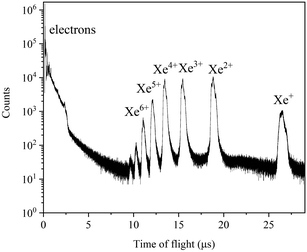 | ||
| Fig. 1 Time-of-flight spectrum of all the electrons and ions produced for Xe at a photon energy of 391.7 eV. | ||
III. Computations
To model the decay of inner-shell ionized atoms, detailed computations of the level energies and transition rates are typically required for different hole-state configurations and charge states in order to predict the thresholds, branching fractions or even final ion charge-state distributions. Such cascade-type computations were performed below using JAC,18 the Jena Atomic Calculator, which integrates different processes within a single framework and thus ensures good (self-) consistency of all generated data. This toolbox is based on the multi-configuration Dirac–Hartree–Fock (MCDHF) method19 and has already been employed to analyze different cascades.20However, the cascade computations are not free of limitations and usually require special care. Serious restrictions especially arise from missing bound–continuum correlations that cannot be incorporated by the present implementation, while the relativistic fine-structure splitting itself appears to be less relevant for predicting the CK and SCK branching ratios. For the 4s photoionization of Xe, in particular, parts of the 4d−2nf and 4d−2n′l′ configurations lay as independent resonances in the continuum and cannot be captured by the bound-state density alone.21 A further practical limitation in predicting reliable branching fractions arise moreover from the set-in of the 4f orbital contraction which, for Xe, roughly starts for doubly-ionized atoms and is quite difficult to control as the nuclear charge increases.22 Unfortunately, therefore, a more complete treatment of missing – and especially (almost) all continuum–continuum – correlations is presently out of sight.
Below, we applied the JAC toolbox to calculate the energies, rates and branching fractions for initially 4s ionized Xe. In particular, the Auger and CK rates have been computed, by ad hoc incorporating the energy shifts of 4s and 4p holes due to their coupling to the continuum.23 The main computational effort has been on the representation of the fine-structure levels at each step of the decay pathways as well as the transition amplitudes. To formalize such cascades, different cascade schemes and building blocks have been implemented24 and now support elaborate calculations of inner-shell excited atoms and ions. We applied this recent implementation especially to analyze the formation of the 4s hole and its subsequent decay to the 4d−2, 4l−15l−1 and 5l−2 states. Because of the complexity of these double-hole states, however, the representation of the fine-structure levels needs to be restricted with regard to the size of the wave function expansion and the ionic potential as seen by the emitted electrons, which need to be chosen separately for each final configuration of interest.25 In the JAC toolbox, these two limitations are treated by specifying a hierarchy of cascade approaches for calculating the ionic level energies and state functions. In general, the size of such cascade computations increases rapidly with (i) the number of electrons that need to be replaced, and (ii) the depth of the cascade, i.e., the maximum number of electrons that can be released, as well as (iii) the number of fine-structure transitions. Details of the implementation have been summarized elsewhere.18,24
IV. Results and discussion
IV-1. Photoelectron spectrum and ion branching ratio
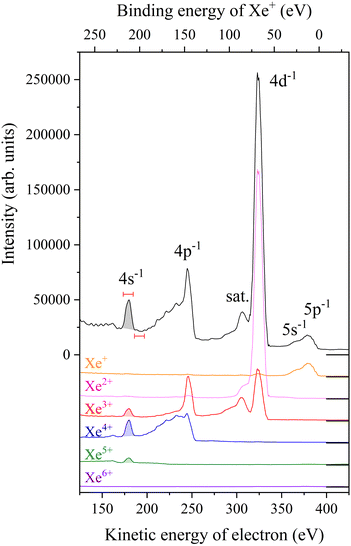
Fig. 2 presents the photoelectron spectra as extracted from the total events as well as from those filtered by coincidences with different XeZ+ ions (Z = 1–6). Photoelectron structures associated with photoionization from the Xe N and O shells are clearly seen in these spectra. The intensities of the coincidence spectra were corrected by the ion detection efficiencies, and thus the relative intensities of individual photoelectron structures in these spectra reflect the branching ratios from the corresponding core-hole states to these ion charge states. The ion branching ratios of the individual core-hole states have also been studied by Eland et al. using the same coincidence method.13While the present study focuses on the decay of the 4s−1 state, some findings on the 4p structure seen in Fig. 2 are worth mentioning as well. The strongly correlated 4p−1 states12 appear in the total electron spectrum as an anomalous photoelectron structure consisting of a peak around a kinetic energy of 245 eV and a distinct shoulder on the lower kinetic energy side. As already pointed out by Eland et al.,13 determining the ion branching ratio of the 4p decay is not straightforward, since it varies greatly with the photoelectron range considered as the 4p−1 contribution. A multi-electron coincidence study reported a dominant Xe3+ formation for the main 4p photoelectron peak,5 which has indeed been confirmed by a recent calculation.26 The shoulder part of the photoelectron structure is associated with double photoionization into the 4d−2 states, enhanced by virtual SCK transition12 of 4p−1 → 4d−2εf over several tens of electron volts.11 The two 4d holes formed are predominantly filled sequentially,11 resulting in the formation of Xe4+. In practice, therefore, the shoulder part of the photoelectron structure essentially appears in the spectrum coincident with Xe4+.
The total photoelectron spectrum in Fig. 2 exhibits a peak for the formation of the 4s−1 state at a kinetic energy of 178.5 eV. The peak width appears to be wider than the natural width of the 4s−1 state (2.9 eV15) owing to the spectrometer resolution. This peak lies on a large background to which double photoionization into Xe2+ 4d−15l−1 and 4d−2 can contribute sizably. The formation of the Z = 2–5 ions from the 4s−1 state is identified in the coincidence spectra, and the branching ratios for the product ions are estimated from the net peak intensities in the coincidence spectra. They are found to be 1%, 27%, 55%, and 16% for Z = 2, 3, 4 and 5, respectively. These values differ somewhat from the findings by Eland et al.,13 which show a fairly even ratio among the Z = 3–5 ions. The estimation by Eland et al., based on the measurement at a photon energy only 37 eV above the 4s threshold, would have a difficulty due to the large background associated with Auger decays from the 4s and other core-hole states. In the meantime, the calculations by Kochur et al.27 (1.0%, 16.5%, 77.4%, 5.1% for Z = 2, 3, 4 and 5, respectively) show a similar trend to the present results. The Auger decay pathways forming these product ions will be revealed in this study. For a reference to follow the various Auger decay paths, the energy level diagram of the XeZ+ states (Z = 1–5) lying below a binding energy of 220 eV is presented in Fig. 3.
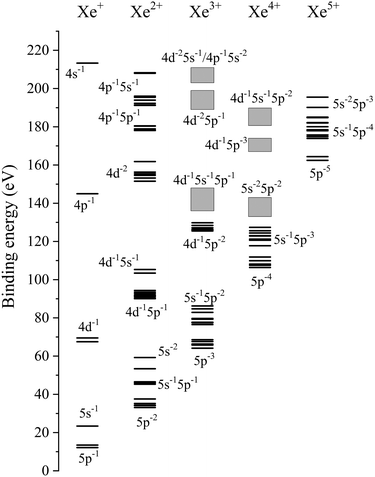 | ||
| Fig. 3 Energy level diagram for the XeZ+ states (Z = 1–5) lying below a binding energy of 220 eV. The energy levels for the 4p−15l−1 states are from the present calculations, while the other levels shown with horizontal bars are from the literature.10,11,28 Boxes indicate the binding energy ranges for the corresponding Auger structures observed in the 3d Auger decay.9 | ||
IV-2. Coster–Kronig and super Coster–Kronig transitions from the Xe 4s core-hole state
The Auger spectrum associated with the 4s−1 state, displayed in Fig. 4(a), was obtained by filtering coincidence events together with the 4s photoelectron. Here, the coincidence spectrum extracted for a neighbored photoelectron range (as shown in Fig. 2) is presented as a shaded curve in order to account for the background contribution. Note that a simple subtraction of the reference spectrum from the 4s Auger spectrum does not yield the net 4s Auger structures. This is because the double photoionization into Xe2+ states is an important part of the background that underlies the 4s peak and the high-energy selection of one of the two emitted photoelectrons leads to the Xe2+ photoelectron structures at correspondingly lower kinetic energies in the reference spectrum. Apart from the spectral range in this figure, a weak structure, associated with the N1O1,2.3O1,2.3 Auger transition to the 5l−2 states, should appear in the kinetic energy range of 160–180 eV with an intensity corresponding to the branching ratio of Xe2+ production (1%); at the given photon energy, however, the Auger electrons are rather close in kinetic energy to the 4s photoelectron, and the coincidence of these events is almost lost owing to the detection deadtime.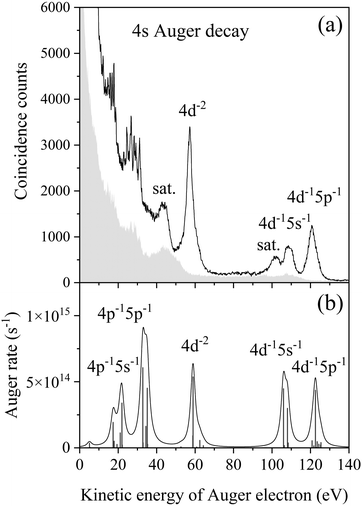 | ||
| Fig. 4 (a) Auger spectrum (solid line) coincident with 4s photoelectron, and spectrum (shaded) delineating the background contribution. They are obtained in coincidence with an electron in either energy range indicated in Fig. 2. “sat.” denotes correlated satellite structures analogue to Fig. 2. (b) Calculated Auger spectrum. The Auger rates for the formations of individual Xe2+ levels are plotted with vertical bars, and the solid line shows convolution with the Lorenz function reflecting the natural width (2.9 eV15) of the 4s−1 state. | ||
In the 4s Auger spectrum, the N1N4,5O1,2.3 CK transition to the 4d−15l−1 states leads to structures that are observed in the kinetic energy range of 90–130 eV. The most prominent peak at a kinetic energy of 57 eV can be assigned to the N1N4,5N4,5 SCK transition to the 4d−2 states. The calculated Auger spectrum, displayed in Fig. 4(b), reproduces the energy positions of these structures reasonably well. While a broad peak is observed in the experimental spectrum around a kinetic energy of 43 eV, the corresponding transition could not be identified uniquely in the calculation. This structure should presumably be assigned to the 4d−2 satellites, which were not included in the present calculation and likely refer to 5p → np shake-up contributions. The same applies for several 4d−14l−1 satellites which were not included in the present calculation either. While the calculation predicts the N1N2,3O1,2.3 CK transitions to the 4p−15l−1 states at kinetic energies below 40 eV, identification of the corresponding structures is hindered in the experimental spectrum by the intense blending of lines from secondary Auger processes.
The branching ratios of the CK and SCK transitions in the total 4s decay can be determined by normalizing the net coincidence counts for the corresponding Auger structures in Fig. 4(a) with regard to the net 4s photoelectron counts in Fig. 2, where the detection efficiency for one Auger electron has to be compensated for in counting the coincidence. In this determination, the contribution from the background underlying the Auger structures has to be appropriately subtracted, which can be done by estimating the intensities from the double photoionization structures in the shaded spectrum. As for the 4d−2 satellites, the branching ratio had to be obtained as described in the next section, since estimation of the background contribution was deemed dubious.
The branching ratios obtained are presented in Table 1, together with the present calculation and earlier Hartree–Fock calculation.27 In addition to these relatively strong decays, the Auger decay into the 5l−2 states shares a fraction of 1%. In practice, however, the combined share of these allocated transitions is only 62% of the total 4s decay. It is expected that the CK transitions into the uncovered 4p−15l−1 states contribute significantly to the remaining 38% fraction in the 4s decay, as the calculation predicts the important contributions of the transitions. Apart from these single Auger transitions, direct double Auger decays into Xe3+ states also contribute to the 4s decay. In fact, a weak structure associated with the direct double Auger decay into 4d−15l−2 states is observed in the present data, as presented in next section. A similar amount of the direct double Auger decay into the 4d−25l−1 states would also contribute to the 4s decay.
| Formed Xe2+ states | Experiment | Present calculation | Hartree–Fock calculation [Kuc94] |
|---|---|---|---|
| 4d−15p−1 | 0.13 | 0.1512 | 0.0861 |
| 4d−15s−1 | 0.08 | 0.1876 | 0.0924 |
| 4d−15s−1 Satellites | 0.05 | ||
| 4d−2 | 0.28 | 0.1678 | 0.1152 |
| 4d−2 Satellites | 0.07 | ||
| 4p−15p−1 | ? | 0.4277 | 0.5446 |
| 4p−15s−1 | ? | 0.0657 | 0.1489 |
Although both the present and Hartree–Fock calculations reproduce the general trend in the experimental branching ratios reasonably well, they clearly underestimate the contribution from the SCK transition to 4d−2. Apart from missing correlations in the representation of the final states, this low branching fraction is likely associated with the localization of the 4s core-hole state and its coupling to the resonances in the continuum. As indicated before, furthermore, a series of computations showed that the SCK transition to 4d−2 states appears highly sensitive to a contraction of the 4d orbital as it results from a deliberate increase of the nuclear charge.
IV-3. Subsequent decay after the Coster–Kronig and super Coster–Kronig transitions
Xe2+ states that are produced by CK and SCK transitions can decay further, as these states still hold one or two core holes. To investigate the final product ions correlated to these Xe2+ states, the Auger spectra coincident further with XeZ+ (Z = 3–5) ions are extracted and presented in Fig. 5. The intensities of these coincidence spectra were corrected by the ion detection efficiencies, and in practice, the sum of these three spectra well agrees with the total Auger spectrum replotted at the top. This agreement implies that the ion detection efficiencies adopted are very reasonable.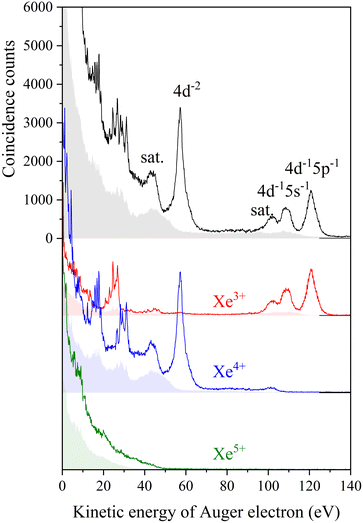 | ||
| Fig. 5 Auger spectra (solid line) coincident with 4s photoelectron, and spectra (shaded) delineating the background contribution. The black spectra on top are the replots of those in Fig. 4(a), and the other spectra are derived by further coincidence with product ions of Z = 3–5. The intensities of the spectra coincident with ions were corrected by the ion detection efficiencies. “sat.” denotes correlated satellite structures analogue to Fig. 2. | ||
The spectrum coincident with the Xe3+ ion (red curve) shows the N1N4,5O1,2.3 CK transition to the 4d−15l−1 states as well as structures lying below a kinetic energy of 50 eV. The 4d−15l−1 states are populated predominantly by subsequent Auger processes filling the 4d core-hole, while the structures below a kinetic energy of 50 eV in this spectrum are due to the consecutive processes. A detailed investigation of secondary Auger processes has already been conducted for the same processes contributing to the 4p decay.5 The present study reveals that the N1N4,5O1,2.3 CK transitions are indeed crucial for determining the Xe3+ production. In practice, the fraction (26%) of the total N1N4,5O1,2.3 CK transition for Xe3+ formation is nearly identical to the branching ratio (27%) observed for the formation of Xe3+ in the 4s decay.
The 4d−15l−1 satellites all lie around a kinetic energy of 100 eV and partly undergo double Auger decay to produce Xe4+ states,5 giving rise to the weak structure (corresponding to a 1% fraction in the 4s decay) in the spectrum coincident with the Xe4+ ion (blue curve). A continuous intensity is found by starting from the 4d−15l−1 satellites towards lower kinetic energies, which is due to the double Auger decay into the 4d−15l−2 states. The formed Xe3+ states predominantly decay by further Auger processes, filling the 4d core-hole, and thus a double Auger structure appears in the Xe4+ spectrum. The more pronounced structure in this spectrum belongs to the 4d−2 states and appears around a kinetic energy of 57 eV. The sequential fillings of the double 4d holes lead to the emissions of two additional Auger electrons,11 resulting in the formation of the final Xe4+ ions. The sharp peaks seen below the kinetic energy of 40 eV are mostly assigned to the stepwise decays of the 4d−2 states.
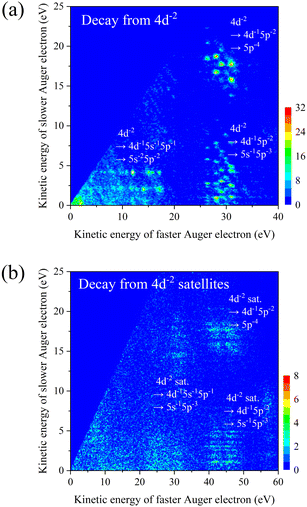
Fig. 6(a) presents a two-dimensional map showing the correlated energies of the two Auger electrons as emitted in the stepwise decays from the 4d−2 states. In this figure, several island structures are clearly seen and refer to level-to-level transitions from Xe3+ to Xe4+. The structures in the region x = 25–35 eV, which are essentially the same as those observed in a previous study on 4d double photoionization,11 are associated with the first-step transitions of 4d−2 → 4d−15p−2 and the second-step transitions of 4d−15p−2 → 5p−4/5s−15p−3. Moreover, several intense islands in the region x = 5–18 eV can be assigned to the transitions of 4d−2 → 4d−15s−15p−1 → 5s−25p−2.
The structure of the 4d−2 satellites is also observed in the Auger spectrum coincident with Xe4+ ions (blue curve in Fig. 5), where the intensity of the peak structure is almost equal to that in the total Auger spectrum. This implies that the decay of these states mainly leads to the formation of Xe4+ levels, while the 4d−2 satellite states lie above the Xe5+ threshold. The energy correlations between the two Auger electrons emitted in the decay from the 4d−2 satellites (see Fig. 6(b)) show structures that are formed by the transitions of 4d−2 satellites → 4d−15l−2 → 5l−4. These islands reflect the dense distribution of 4d−2 satellites and are observed less distinctly than those in Fig. 6(a). The first-step transitions of 4d−2 satellites → 4d−15l−2 emit Auger electrons in the kinetic energy range of 40–50 eV, and the associated structures lie below the 4d−2 satellite peak in the coincidence Auger spectrum (blue curve in Fig. 5). A reliable estimate of the net intensity of the CK transition to the 4d−2 satellites can be obtained from the total intensity of the island structures due to the stepwise decay of 4d−2 satellites. The total intensity of the island structures in Fig. 6(b) is about one-fifth of that shown in Fig. 6(a), and which implies for the 4s decay a branching ratio of Xe4+ formation via 4d−2 satellites of about 6%. The processes that have been linked with Xe4+ production account for only ∼40% of the 4s decay, while the remaining ∼15%, i.e., the difference from the branching ratio of total Xe4+ formation (55%), should presumably be attributed to processes that follow the N1N2,3O1,2.3 CK transitions to the 4p−15l−1 states.
The Auger spectrum coincident with the Xe5+ ion (green curve in Fig. 5) shows a gradual increase in intensity as the kinetic energy decreases, and weakly embeds shape peaks around a kinetic energy of 10 eV. The electron distribution extends up to a kinetic energy of 45 eV. Here, the energy level diagram in Fig. 3 suggests that only the transition of 4s−1 → 4d−2 satellites can emit such high-energy electrons along the path to the final formation of Xe5+, implying that a small fraction of the 4d−2 satellites finally emits a total of three electrons. It is estimated from the coincidence counts in the kinetic energy range of 38–45 eV that the subsequent decay path of the 4d−2 satellites forms at most a 1% fraction of the 4s decay. It is very likely that the N1N2,3O1,2.3 CK transitions to 4p−15l−1 and the subsequent decays with three electron emission are the main pathways to the Auger spectrum coincident with Xe5+, though the overlap of structures associated with different decay steps prevents us from isolating the CK structures in this spectrum. A detailed inspection of the correlated energies of Auger electrons could yield information on quadruple Auger decay pathways but such an analysis is beyond the scope of this study.
V. Conclusions
The Auger decay of the Xe 4s core-hole state was studied by multi-electron–ion coincidence spectroscopy using a magnetic bottle electron spectrometer. The first-step Auger decay included several CK transitions and an SCK transition, whose branching ratios were determined from the intensities of the corresponding Auger structures. Information on the energy correlations between the emitted electrons enabled us to identify subsequent transitions that formed double, triple, and quadruple Auger pathways. A further coincidence with product ions helped to isolate the Auger structures relevant to the formation of individual charge states. The present work demonstrates that further coincidence with the product ion enhances the power of multi-electron coincidence measurements and helps to elucidate complicated Auger decay processes.Author contributions
Y. H. performed the measurements and data analysis; S. F. performed the calculation; Y. H. drafted the manuscript, which was completed in consultation with S. F.Conflicts of interest
There are no conflicts to declare.Acknowledgements
This work was performed at the UVSOR Synchrotron Facility with the approval of the Institute for Molecular Science (proposal numbers 20-752 and 21-654). The author is grateful to the UVSOR staff for the stable operation of the UVSOR-III storage ring. This work was supported in part by JSPS KAKENHI (Grant number 21K03430), Research Foundation for Opto-Science and Technology, and the Matsuo Foundation.References
- K. Okuyama, J. H. D. Eland and K. Kimura, Phys. Rev. A: At., Mol., Opt. Phys., 1990, 41, 4930 CrossRef CAS PubMed.
- J. H. D. Eland, O. Vieuxmaire, T. Kinugawa, P. Lablanquie, R. I. Hall and F. Penent, Phys. Rev. Lett., 2003, 90, 053003 CrossRef CAS PubMed.
- F. Penent, J. Palaudoux, P. Lablanquie, L. Andric, R. Feifel and J. H. D. Eland, Phys. Rev. Lett., 2005, 95, 083002 CrossRef CAS PubMed.
- P. Lablanquie, L. Andric, J. Palaudoux, U. Becker, M. Braune, J. Viefhaus, J. H. D. Eland and F. Penent, J. Electron Spectrosc. Relat. Phenom., 2007, 156–158, 51 CrossRef CAS.
- Y. Hikosaka, P. Lablanquie, F. Penent, T. Kaneyasu, E. Shigemasa, J. H. D. Eland, T. Aoto and K. Ito, Phys. Rev. A: At., Mol., Opt. Phys., 2007, 76, 032708 CrossRef.
- J. Palaudoux, P. Lablanquie, L. Andric, K. Ito, E. Shigemasa, J. H. D. Eland, V. Jonauskas, S. Kučas, R. Karazija and F. Penent, Phys. Rev. A: At., Mol., Opt. Phys., 2010, 82, 043419 CrossRef.
- E. Andersson, S. Fritzsche, P. Linusson, L. Hedin, J. H. D. Eland, J.-E. Rubensson, L. Karlsson and R. Feifel, Phys. Rev. A: At., Mol., Opt. Phys., 2010, 82, 043418 CrossRef.
- P. Lablanquie, S.-M. Huttula, M. Huttula, L. Andric, J. Palaudoux, J. H. D. Eland, Y. Hikosaka, E. Shigemasa, K. Ito and F. Penent, Phys. Chem. Chem. Phys., 2011, 13, 18355 RSC.
- I. H. Suzuki, Y. Hikosaka, E. Shigemasa, P. Lablanquie, F. Penent, K. Soejima, M. Nakano, N. Kouchi and K. Ito, J. Phys. B: At., Mol. Opt. Phys., 2011, 44, 075003 CrossRef.
- Y. Hikosaka, T. Kaneyasu, P. Lablanquie, F. Penent, E. Shigemasa and K. Ito, Phys. Rev. A: At., Mol., Opt. Phys., 2015, 92, 033413 CrossRef.
- Y. Hikosaka, P. Lablanquie, F. Penent, T. Kaneyasu, E. Shigemasa, J. H. D. Eland, T. Aoto and K. Ito, Phys. Rev. Lett., 2007, 98, 183002 CrossRef CAS PubMed.
- G. Wendin and M. Ohno, Phys. Scr., 1976, 14, 148 CrossRef CAS.
- J. H. D. Eland, C. Slater, S. Zagorodskikh, R. Singh, J. Andersson, A. Hult-Roos, A. Lauer, R. J. Squibb and R. Feifel, J. Phys. B: At., Mol. Opt. Phys., 2015, 48, 205001 CrossRef.
- Y. Hikosaka, J. Electron Spectrosc. Relat. Phenom., 2022, 255, 147158 CrossRef CAS.
- S. Svensson, N. Mårtensson, E. Basilier, P.-Å. Malmquist, U. Gelius and K. Siegbahn, Phys. Scr., 1976, 14, 141 CrossRef CAS.
- Y. Hikosaka, M. Sawa, K. Soejima and E. Shigemasa, J. Electron Spectrosc. Relat. Phenom., 2014, 192, 69 CrossRef CAS.
- Y. Hikosaka and E. Shigemasa, Int. J. Mass Spectrom., 2019, 439, 13 CrossRef CAS.
- S. Fritzsche, Comput. Phys. Commun., 2019, 240, 1 CrossRef CAS.
- I. P. Grant, Relativistic Quantum Theory of Atoms and Molecules, Springer Series on Atomic, Optical, and Plasma Physics, Springer, New York, 2007 Search PubMed.
- S. Schippers, M. Martins, R. Beerwerth, S. Bari, K. Holste, K. Schubert, J. Viefhaus, D. W. Savin, S. Fritzsche and A. Müller, Astrophys. J., 2017, 849, 5 CrossRef.
- S. Fritzsche, G. Zschornack, G. Musiol and G. Soff, Phys. Rev. A: At., Mol., Opt. Phys., 1991, 44, 388 CrossRef CAS PubMed.
- S. Schippers, A. Borovik Jr., T. Buhr, J. Hellhund, K. Holste, A. L. D. Kilcoyne, S. Klumpp, M. Martins, A. Müller, S. Ricz and S. Fritzsche, J. Phys. B: At., Mol. Opt. Phys., 2015, 48, 144003 CrossRef.
- M. H. Chen, B. Crasemann, N. Martensson and B. Johansson, Phys. Rev. A: At., Mol., Opt. Phys., 1985, 31, 556 CrossRef CAS PubMed.
- S. Fritzsche, P. Palmeri and S. Schippers, Symmetry, 2021, 13, 520 CrossRef CAS.
- S. Fritzsche, B. Fricke and W.-D. Sepp, Phys. Rev. A: At., Mol., Opt. Phys., 1992, 245, 1465 CrossRef PubMed.
- Z. Liu, Q. Liu, Y. Ma, F. Zhou and Y. Qu, Chin. Phys. Lett., 2021, 38, 023201 CrossRef CAS.
- A. G. Kochur, A. I. Dudenko, V. L. Sukhorukov and I. D. Petrov, J. Phys. B: At., Mol. Opt. Phys., 1994, 27, 1709 CrossRef CAS.
- A. Kramida, Yu Ralchenko and J. Reader, NIST ASD Team, 2020. NIST Atomic Spectra Database (ver. 5.8). Available: https://physics.nist.gov/asd.
| This journal is © the Owner Societies 2022 |

