DOI:
10.1039/C4RA16594B
(Paper)
RSC Adv., 2015,
5, 19865-19873
Supercapacitor performance of carbon nanofiber electrodes derived from immiscible PAN/PMMA polymer blends
Received
17th December 2014
, Accepted 6th February 2015
First published on 6th February 2015
1. Introduction
Supercapacitors have gained a lot of attention recently as energy storage devices, due to their high power density, long cycle life, wide working potential and broad temperature range of operation.1 Although supercapacitors have a higher energy density than conventional capacitors, they have lower energy density compared to batteries.1,2
Therefore, there has been a keen interest in the field to improve the energy density of supercapacitors while retaining their high power density. The methods used to increase energy density depend on the type of the supercapacitor, since the charge storage mechanism varies with the type of supercapacitor. Mainly, these can be categorized into electrical double-layer capacitors (EDLCs), pseudocapacitors and hybrid capacitors.1 EDLCs, studied here, are based on two carbon electrodes that electrostatically store energy in a non-Faradic manner within the double layer formed between the surface of the electrode material and the electrolyte ions in the pores of electrodes.3 Therefore, high surface area and porosity of the electrode material are essential to enhance the energy density of EDLCs to achieve high performances.1–5
The performance of EDLCs primarily depends on the types of the electrode materials used.6 Recently, several types of carbon materials have been reported for EDLCs, such as activated carbons,7,8 carbon nanofibers,9–11 carbide-derived carbons (CDCs),12 templated carbons,13 carbon nanotubes,14 and graphene.15 Among these, carbon nanofibers are one of the more promising candidates for EDLC because of their mechanical strength, high surface area, relatively high conductivity, freestanding nature and flexibility.16,17 Electrospinning is a simple and widely used technique to produce nanofibers from a wide range of polymers.18 The electrolyte is also important for high supercapacitor performance, and the size of the electrolyte ions should be comparable with the pore sizes of the electrode materials.19,20
Thus, the major challenge is to prepare the carbon materials which have very high surface area and suitable pore size. The polymer blend technique is a promising route to obtain carbon materials with such fine and controlled pores. This can be achieved by blending of two immiscible polymers which allows control over the blend texture to obtain desired pore sizes.21 There are a few studies reported for the carbonization of nanofibers prepared from immiscible polymer blends as a precursor for supercapacitor electrode materials.22–24 Tran et al. reported fabrication of the porous CNFs using Nafion as a sacrificial polymer.22 They obtained CNFs with specific surface area of 1600 m2 g−1 and large specific gravimetric capacitances of 210 F g−1 in 1 M H2SO4 at a scan rate of 100 mV s−1. Jo et al. have investigated the performance of electrode materials using carbon nanofibers derived from immiscible binary polymer blend, consisting 75 wt% of PAN as the carbonizing polymer and with 25 wt% of different sacrificial polymers such as polyacrylic acid (PAA), polyethylene glycol (PEG), polymethyl methacrylate (PMMA) and polystyrene (PS).21 They correlated the pore size created on the CNFs after decomposition of sacrificial polymers with the difference in solubility parameter of the selected polymers. Also they showed that CNF prepared with controlled meso-sized pores demonstrated best cyclic voltammetry measurements. In these methods the polymer blends are comprised of two polymers with different degrees of thermal stability. The polymer with high thermal stability forms the carbon fiber, while the polymer with very low thermal stability acts as a sacrificial material, which completely decomposes at a high temperature. During the thermal decomposition, pores are generated within the carbon fibers and the pore sizes can be controlled by varying the amount of the sacrificial polymer in the blend composition.
Herein, we report the preparation of activated carbon nanofibers from electrospun immiscible PAN/PMMA polymer blends followed by thermal treatments of carbonization and activation. PAN is used as the carbon precursor of choice due to its high carbon yield, good thermal stability, spinnability and commercial availability.25 The electrospinning of the incompatible PAN/PMMA blend introduces a phase separated morphology in the fiber, which leads to porous carbonized fibers suitable as supercapacitor electrodes (Fig. 1).
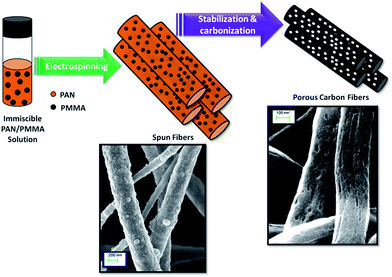 |
| | Fig. 1 Schematic illustration of the porous carbon nanofiber formation using PAN/PMMA immiscible polymer blends. During carbonization, PMMA decomposes creating pores in PAN nanofibers. | |
2. Experimental
2.1 Materials
Polyacrylonitrile (PAN, Mw = 150![[thin space (1/6-em)]](https://www.rsc.org/images/entities/char_2009.gif) 000 g mol−1) was purchased from Pfaltz and Bauer, Inc. Polymethyl methacrylate (PMMA, Mw = 120
000 g mol−1) was purchased from Pfaltz and Bauer, Inc. Polymethyl methacrylate (PMMA, Mw = 120![[thin space (1/6-em)]](https://www.rsc.org/images/entities/char_2009.gif) 000 g mol−1) and anhydrous N,N′-dimethylformamide (DMF) were purchased from Sigma Aldrich and used as received without further purification. Electrochemical grade ethylmethylimidazolium bis(trifluoromethylsulfonyl)imide (EMITFSI), (99.5% purity) was purchased from IoLiTec, Inc. and was used as received. The coin cell assembly parts were obtained from Shenzhen Yongxingye Precision Machinery Mould Co. Ltd., China.
000 g mol−1) and anhydrous N,N′-dimethylformamide (DMF) were purchased from Sigma Aldrich and used as received without further purification. Electrochemical grade ethylmethylimidazolium bis(trifluoromethylsulfonyl)imide (EMITFSI), (99.5% purity) was purchased from IoLiTec, Inc. and was used as received. The coin cell assembly parts were obtained from Shenzhen Yongxingye Precision Machinery Mould Co. Ltd., China.
2.2 Preparation of carbon nanofibers
First, PAN and PMMA were dissolved in DMF in separate vials by stirring for 4 h at 50 °C. Then three types of 10 wt% polymer blend solutions were prepared for electrospinning comprising PAN![[thin space (1/6-em)]](https://www.rsc.org/images/entities/char_2009.gif) :
:![[thin space (1/6-em)]](https://www.rsc.org/images/entities/char_2009.gif) PMMA (95
PMMA (95![[thin space (1/6-em)]](https://www.rsc.org/images/entities/char_2009.gif) :
:![[thin space (1/6-em)]](https://www.rsc.org/images/entities/char_2009.gif) 5), PAN
5), PAN![[thin space (1/6-em)]](https://www.rsc.org/images/entities/char_2009.gif) :
:![[thin space (1/6-em)]](https://www.rsc.org/images/entities/char_2009.gif) PMMA (90
PMMA (90![[thin space (1/6-em)]](https://www.rsc.org/images/entities/char_2009.gif) :
:![[thin space (1/6-em)]](https://www.rsc.org/images/entities/char_2009.gif) 10) and PAN
10) and PAN![[thin space (1/6-em)]](https://www.rsc.org/images/entities/char_2009.gif) :
:![[thin space (1/6-em)]](https://www.rsc.org/images/entities/char_2009.gif) PMMA (75
PMMA (75![[thin space (1/6-em)]](https://www.rsc.org/images/entities/char_2009.gif) :
:![[thin space (1/6-em)]](https://www.rsc.org/images/entities/char_2009.gif) 25) blend compositions. These solutions were further stirred for 24 h at room temperature. In addition, a 10 wt% PAN control solution was also prepared by following the same procedure. The solutions were electrospun using a custom-built electrospinner under an applied voltage of 15 kV (Gamma High Voltage Research, Inc., power supply). The polymer solutions were loaded into the syringe and the attached needle tip was connected to the positive voltage of the power supply. The polymer solutions were delivered to the tip at a constant flow rate of 0.8 ml h−1 controlled by a syringe pump and the grounded drum collector was placed 15 cm away from the needle tip and rotated at 300 rpm. Electrospun nanofiber mats were stabilized at 280 °C for 1 h under air flow at a heating rate of 2 °C min−1 and then carbonized and CO2 activated for 1 h at 1000 °C under helium at a heating rate of 5 °C min−1.
25) blend compositions. These solutions were further stirred for 24 h at room temperature. In addition, a 10 wt% PAN control solution was also prepared by following the same procedure. The solutions were electrospun using a custom-built electrospinner under an applied voltage of 15 kV (Gamma High Voltage Research, Inc., power supply). The polymer solutions were loaded into the syringe and the attached needle tip was connected to the positive voltage of the power supply. The polymer solutions were delivered to the tip at a constant flow rate of 0.8 ml h−1 controlled by a syringe pump and the grounded drum collector was placed 15 cm away from the needle tip and rotated at 300 rpm. Electrospun nanofiber mats were stabilized at 280 °C for 1 h under air flow at a heating rate of 2 °C min−1 and then carbonized and CO2 activated for 1 h at 1000 °C under helium at a heating rate of 5 °C min−1.
2.3 Characterization
The surface morphology of as-spun, stabilized and carbonized fibers were investigated by a Zeiss SUPRA 40 Scanning Electron Microscope (SEM) with a field emission gun operating at 10 keV. As-spun and stabilized nanofibers were sputter coated using gold/palladium target before collecting data and SEM images of carbonized fibers were obtained without sputter coating. The fiber diameters were determined by averaging the diameter of 100 fibers for each sample. To investigate the phase morphology of the blends, thin film membranes were prepared by solvent-casting method. First polymer solutions were cast onto a glass substrate using a Sheen automatic applicator (1133N) equipped with a doctor blade and then PMMA polymer phase was extracted from the thin film membrane by using methylene chloride as a solvent in a Soxhelt extractor. Then the morphology of the extracted films were examined by SEM after sputter coating with gold/palladium. Fourier transform infrared (FTIR) spectra for all the samples were acquired using a Nicolet 360 FTIR spectrophotometer. Thermogravimetric analysis (TGA) for pure PMMA, as-spun fiber mat of neat PAN and the PAN/PMMA blends was done under nitrogen at a flow rate of 50 ml min−1 using a TA Instruments SDT Q600 Analyzer at a heating rate of 10 °C min−1 from room temperature to 1000 °C. The ratio of graphitic and amorphous carbons was determined using a JobinYvon HORIBA LabRam Raman spectrometer equipped with a 633 nm He–Ne laser. The porosity and pore volume were measured from the nitrogen adsorption isotherms at 77 K (Quantachrome Instruments Autosorb-1). The specific surface area of the carbonized nanofibers was determined by the Brunauer–Emmett–Teller (BET) method. The pore size distribution was calculated using the Density Functional Theory (DFT).
2.4 Electrochemical tests
CR2032 coin cells were assembled to test the electrochemical performance of the obtained electrodes. First, the electrodes were punched out directly from the carbonized fiber mat. In the assembly of the coin cells, two electrodes were placed in between stainless steel spacers and two current collectors (carbon coated aluminum) and PTFE (Gore™) separator was placed in between the electrodes to separate them. EMITFSI was used as an ionic liquid electrolyte and these components were pressed together using a crimper inside the nitrogen filled glove box. To obtain electrochemical performances of the fibers, cyclic voltammetry and charge discharge tests were done using an Arbin Supercapacitor Test Station (SCTS). Electrochemical impedance spectroscopy was obtained using a PARSTAT 2273 Galvanostat (Princeton Applied Research) at 0 V DC bias in between the frequency range of 100 kHz to 10 mHz and analyzed using a PowerSuite software.
3. Results and discussion
3.1 Characterization of the material
The SEM images in Fig. 2 show the fibrous morphology of the electrospun nanofibers obtained from neat PAN and the PAN/PMMA blends. Flexible freestanding fiber mats were obtained after electrospinning of these blend solutions. All the electrospun solutions with different weight ratios of PMMA show uniform nanofibers without beading. The fiber diameter is one of the important factors determining the electrochemical properties of carbon materials formed from electrospun fibres. SEM images (Fig. 2) revealed that the average diameter of fibers decreases with increasing PMMA amount in the blend compositions. The fiber diameter obtained for neat PAN was 692 ± 98 nm decreasing to 511 ± 127 nm for PAN![[thin space (1/6-em)]](https://www.rsc.org/images/entities/char_2009.gif) :
:![[thin space (1/6-em)]](https://www.rsc.org/images/entities/char_2009.gif) PMMA (95
PMMA (95![[thin space (1/6-em)]](https://www.rsc.org/images/entities/char_2009.gif) :
:![[thin space (1/6-em)]](https://www.rsc.org/images/entities/char_2009.gif) 5), 472 ± 97 nm for PAN
5), 472 ± 97 nm for PAN![[thin space (1/6-em)]](https://www.rsc.org/images/entities/char_2009.gif) :
:![[thin space (1/6-em)]](https://www.rsc.org/images/entities/char_2009.gif) PMMA (90
PMMA (90![[thin space (1/6-em)]](https://www.rsc.org/images/entities/char_2009.gif) :
:![[thin space (1/6-em)]](https://www.rsc.org/images/entities/char_2009.gif) 10) and 353 ± 88 nm for PAN
10) and 353 ± 88 nm for PAN![[thin space (1/6-em)]](https://www.rsc.org/images/entities/char_2009.gif) :
:![[thin space (1/6-em)]](https://www.rsc.org/images/entities/char_2009.gif) PMMA (75
PMMA (75![[thin space (1/6-em)]](https://www.rsc.org/images/entities/char_2009.gif) :
:![[thin space (1/6-em)]](https://www.rsc.org/images/entities/char_2009.gif) 25). The trend can be attributed to the lower viscosity of the solutions with higher amount of PMMA compared to that of neat PAN solution.26 During electrospinning, the dispersed PMMA droplets, having a lower viscosity compared to that of PAN, would be elongated more by the electrical forces and thus the fiber diameter is reduced further.26
25). The trend can be attributed to the lower viscosity of the solutions with higher amount of PMMA compared to that of neat PAN solution.26 During electrospinning, the dispersed PMMA droplets, having a lower viscosity compared to that of PAN, would be elongated more by the electrical forces and thus the fiber diameter is reduced further.26
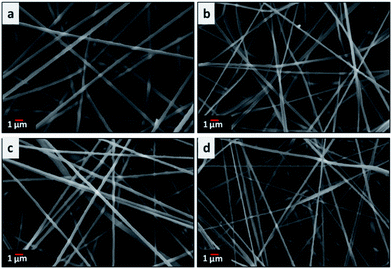 |
| | Fig. 2 SEM images of electrospun (a) neat PAN, (b) PAN![[thin space (1/6-em)]](https://www.rsc.org/images/entities/char_2009.gif) : :![[thin space (1/6-em)]](https://www.rsc.org/images/entities/char_2009.gif) PMMA (95 PMMA (95![[thin space (1/6-em)]](https://www.rsc.org/images/entities/char_2009.gif) : :![[thin space (1/6-em)]](https://www.rsc.org/images/entities/char_2009.gif) 5), (c) PAN 5), (c) PAN![[thin space (1/6-em)]](https://www.rsc.org/images/entities/char_2009.gif) : :![[thin space (1/6-em)]](https://www.rsc.org/images/entities/char_2009.gif) PMMA (90 PMMA (90![[thin space (1/6-em)]](https://www.rsc.org/images/entities/char_2009.gif) : :![[thin space (1/6-em)]](https://www.rsc.org/images/entities/char_2009.gif) 10) and (d) PAN 10) and (d) PAN![[thin space (1/6-em)]](https://www.rsc.org/images/entities/char_2009.gif) : :![[thin space (1/6-em)]](https://www.rsc.org/images/entities/char_2009.gif) PMMA (75 PMMA (75![[thin space (1/6-em)]](https://www.rsc.org/images/entities/char_2009.gif) : :![[thin space (1/6-em)]](https://www.rsc.org/images/entities/char_2009.gif) 25) nanofiber mats. 25) nanofiber mats. | |
Fig. 3 and 4 show the morphology of carbonized and CO2 activated fibers at different magnifications. After the thermal treatments, the mats retained their fibrous morphology without collapsing. All the CNFs demonstrate a very uniform diameter. The fibers shrank after carbonization due to the removal of PMMA which is most obvious in PAN![[thin space (1/6-em)]](https://www.rsc.org/images/entities/char_2009.gif) :
:![[thin space (1/6-em)]](https://www.rsc.org/images/entities/char_2009.gif) PMMA (75
PMMA (75![[thin space (1/6-em)]](https://www.rsc.org/images/entities/char_2009.gif) :
:![[thin space (1/6-em)]](https://www.rsc.org/images/entities/char_2009.gif) 25). The average fiber diameter of CNFs for PAN is 260 ± 27 nm while diameters of CNFs from the PAN/PMMA blends are 197 ± 48 nm (PAN
25). The average fiber diameter of CNFs for PAN is 260 ± 27 nm while diameters of CNFs from the PAN/PMMA blends are 197 ± 48 nm (PAN![[thin space (1/6-em)]](https://www.rsc.org/images/entities/char_2009.gif) :
:![[thin space (1/6-em)]](https://www.rsc.org/images/entities/char_2009.gif) PMMA, 95
PMMA, 95![[thin space (1/6-em)]](https://www.rsc.org/images/entities/char_2009.gif) :
:![[thin space (1/6-em)]](https://www.rsc.org/images/entities/char_2009.gif) 5), 106 ± 21 nm (PAN
5), 106 ± 21 nm (PAN![[thin space (1/6-em)]](https://www.rsc.org/images/entities/char_2009.gif) :
:![[thin space (1/6-em)]](https://www.rsc.org/images/entities/char_2009.gif) PMMA, 90
PMMA, 90![[thin space (1/6-em)]](https://www.rsc.org/images/entities/char_2009.gif) :
:![[thin space (1/6-em)]](https://www.rsc.org/images/entities/char_2009.gif) 10), and 87 ± 19 nm (PAN
10), and 87 ± 19 nm (PAN![[thin space (1/6-em)]](https://www.rsc.org/images/entities/char_2009.gif) :
:![[thin space (1/6-em)]](https://www.rsc.org/images/entities/char_2009.gif) PMMA 75
PMMA 75![[thin space (1/6-em)]](https://www.rsc.org/images/entities/char_2009.gif) :
:![[thin space (1/6-em)]](https://www.rsc.org/images/entities/char_2009.gif) 25) nm, respectively.
25) nm, respectively.
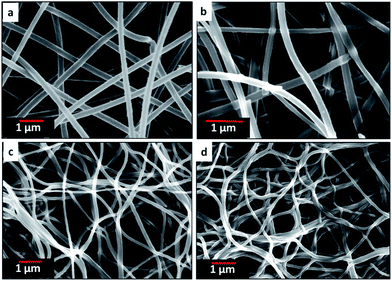 |
| | Fig. 3 SEM images of carbon nanofiber mats of (a) neat PAN, (b) PAN![[thin space (1/6-em)]](https://www.rsc.org/images/entities/char_2009.gif) : :![[thin space (1/6-em)]](https://www.rsc.org/images/entities/char_2009.gif) PMMA (95 PMMA (95![[thin space (1/6-em)]](https://www.rsc.org/images/entities/char_2009.gif) : :![[thin space (1/6-em)]](https://www.rsc.org/images/entities/char_2009.gif) 5), (c) PAN 5), (c) PAN![[thin space (1/6-em)]](https://www.rsc.org/images/entities/char_2009.gif) : :![[thin space (1/6-em)]](https://www.rsc.org/images/entities/char_2009.gif) PMMA (90 PMMA (90![[thin space (1/6-em)]](https://www.rsc.org/images/entities/char_2009.gif) : :![[thin space (1/6-em)]](https://www.rsc.org/images/entities/char_2009.gif) 10) and (d) PAN 10) and (d) PAN![[thin space (1/6-em)]](https://www.rsc.org/images/entities/char_2009.gif) : :![[thin space (1/6-em)]](https://www.rsc.org/images/entities/char_2009.gif) PMMA (75 PMMA (75![[thin space (1/6-em)]](https://www.rsc.org/images/entities/char_2009.gif) : :![[thin space (1/6-em)]](https://www.rsc.org/images/entities/char_2009.gif) 25). 25). | |
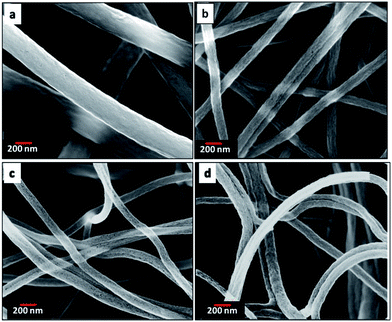 |
| | Fig. 4 SEM images of carbon nanofiber mats from (a) neat PAN, (b) PAN![[thin space (1/6-em)]](https://www.rsc.org/images/entities/char_2009.gif) : :![[thin space (1/6-em)]](https://www.rsc.org/images/entities/char_2009.gif) PMMA (95 PMMA (95![[thin space (1/6-em)]](https://www.rsc.org/images/entities/char_2009.gif) : :![[thin space (1/6-em)]](https://www.rsc.org/images/entities/char_2009.gif) 5), (c) PAN 5), (c) PAN![[thin space (1/6-em)]](https://www.rsc.org/images/entities/char_2009.gif) : :![[thin space (1/6-em)]](https://www.rsc.org/images/entities/char_2009.gif) PMMA (90 PMMA (90![[thin space (1/6-em)]](https://www.rsc.org/images/entities/char_2009.gif) : :![[thin space (1/6-em)]](https://www.rsc.org/images/entities/char_2009.gif) 10) and (d) PAN 10) and (d) PAN![[thin space (1/6-em)]](https://www.rsc.org/images/entities/char_2009.gif) : :![[thin space (1/6-em)]](https://www.rsc.org/images/entities/char_2009.gif) PMMA (75 PMMA (75![[thin space (1/6-em)]](https://www.rsc.org/images/entities/char_2009.gif) : :![[thin space (1/6-em)]](https://www.rsc.org/images/entities/char_2009.gif) 25). 25). | |
Fig. 5 shows the SEM images of the surface morphology of the blend films in which PMMA phase has been selectively extracted with methylene chloride. In immiscible polymer blends, the continuous phase is formed by the major component while the dispersed phase is formed with the minor component.27 Similarly, here PAN became the continuous phase while PMMA became the dispersed phase as evident by the holes resulting from selective solvent extraction. As the incorporated percentage of PMMA in the blends is increased, the domain size of the dispersed phase also became larger and more irregular in shape. Whereas the PAN![[thin space (1/6-em)]](https://www.rsc.org/images/entities/char_2009.gif) :
:![[thin space (1/6-em)]](https://www.rsc.org/images/entities/char_2009.gif) PMMA (95
PMMA (95![[thin space (1/6-em)]](https://www.rsc.org/images/entities/char_2009.gif) :
:![[thin space (1/6-em)]](https://www.rsc.org/images/entities/char_2009.gif) 5) blend exhibited a fairly uniform distribution of PMMA, larger domains with irregular shapes can be observed PAN
5) blend exhibited a fairly uniform distribution of PMMA, larger domains with irregular shapes can be observed PAN![[thin space (1/6-em)]](https://www.rsc.org/images/entities/char_2009.gif) :
:![[thin space (1/6-em)]](https://www.rsc.org/images/entities/char_2009.gif) PMMA (75
PMMA (75![[thin space (1/6-em)]](https://www.rsc.org/images/entities/char_2009.gif) :
:![[thin space (1/6-em)]](https://www.rsc.org/images/entities/char_2009.gif) 25) blend. This may be due to the enhanced coalescence of the PMMA domains occurring during the phase separation process which lowers the interfacial area by forming larger domains.28 It is also possible that the higher amount of PMMA leads to aggregation of PMMA before it disperses within the PAN matrix during polymer mixing. This can account for the irregular shape of the dispersed phase. In either case, a change of blend composition leads to changes in the size and the shape of the dispersed phase and eventually allows the control of the pore size of the resulting CNFs.
25) blend. This may be due to the enhanced coalescence of the PMMA domains occurring during the phase separation process which lowers the interfacial area by forming larger domains.28 It is also possible that the higher amount of PMMA leads to aggregation of PMMA before it disperses within the PAN matrix during polymer mixing. This can account for the irregular shape of the dispersed phase. In either case, a change of blend composition leads to changes in the size and the shape of the dispersed phase and eventually allows the control of the pore size of the resulting CNFs.
 |
| | Fig. 5 SEM images of the surface morphology of the PMMA extracted (a) PAN![[thin space (1/6-em)]](https://www.rsc.org/images/entities/char_2009.gif) : :![[thin space (1/6-em)]](https://www.rsc.org/images/entities/char_2009.gif) PMMA (95 PMMA (95![[thin space (1/6-em)]](https://www.rsc.org/images/entities/char_2009.gif) : :![[thin space (1/6-em)]](https://www.rsc.org/images/entities/char_2009.gif) 5) (b) PAN 5) (b) PAN![[thin space (1/6-em)]](https://www.rsc.org/images/entities/char_2009.gif) : :![[thin space (1/6-em)]](https://www.rsc.org/images/entities/char_2009.gif) PMMA (90 PMMA (90![[thin space (1/6-em)]](https://www.rsc.org/images/entities/char_2009.gif) : :![[thin space (1/6-em)]](https://www.rsc.org/images/entities/char_2009.gif) 10) and (c) PAN 10) and (c) PAN![[thin space (1/6-em)]](https://www.rsc.org/images/entities/char_2009.gif) : :![[thin space (1/6-em)]](https://www.rsc.org/images/entities/char_2009.gif) PMMA (75 PMMA (75![[thin space (1/6-em)]](https://www.rsc.org/images/entities/char_2009.gif) : :![[thin space (1/6-em)]](https://www.rsc.org/images/entities/char_2009.gif) 25) films. 25) films. | |
Thermal decomposition behavior of the electrospun PAN/PMMA blends and the carbon yield at 1000 °C were studied with TGA analysis. Fig. 6(a) shows the TGA curves of the as-spun fiber mats of PAN/PMMA blends with different PMMA loadings. Pure PMMA starts to decompose at 250 °C and it completely decomposes around 400 °C whereupon it is completely converted to volatile products.29 Therefore, no residue of PMMA was observed after 400 °C on the carbonized fibers. During the pyrolysis process of the blends, porous fibers are generated as a result of the degradation of PMMA, which also accounts for a higher surface area. The weight losses mainly occurred in two temperature ranges: 250–300 °C and 300–450 °C. The first weight loss results from the cyclization of nitrile groups in the PAN.30 The second weight loss arises from the decomposition of PMMA.31 PAN![[thin space (1/6-em)]](https://www.rsc.org/images/entities/char_2009.gif) :
:![[thin space (1/6-em)]](https://www.rsc.org/images/entities/char_2009.gif) PMMA (95
PMMA (95![[thin space (1/6-em)]](https://www.rsc.org/images/entities/char_2009.gif) :
:![[thin space (1/6-em)]](https://www.rsc.org/images/entities/char_2009.gif) 5) shows the highest carbon yield of 28.0% among the blends studied and it is similar to that of neat PAN 29.0% at 1000 °C. The carbon yield of PAN/PMMA (90
5) shows the highest carbon yield of 28.0% among the blends studied and it is similar to that of neat PAN 29.0% at 1000 °C. The carbon yield of PAN/PMMA (90![[thin space (1/6-em)]](https://www.rsc.org/images/entities/char_2009.gif) :
:![[thin space (1/6-em)]](https://www.rsc.org/images/entities/char_2009.gif) 10) was 27.1% while PAN/PMMA (75
10) was 27.1% while PAN/PMMA (75![[thin space (1/6-em)]](https://www.rsc.org/images/entities/char_2009.gif) :
:![[thin space (1/6-em)]](https://www.rsc.org/images/entities/char_2009.gif) 25) shows the lowest carbon yield of 17.9%, as expected.
25) shows the lowest carbon yield of 17.9%, as expected.
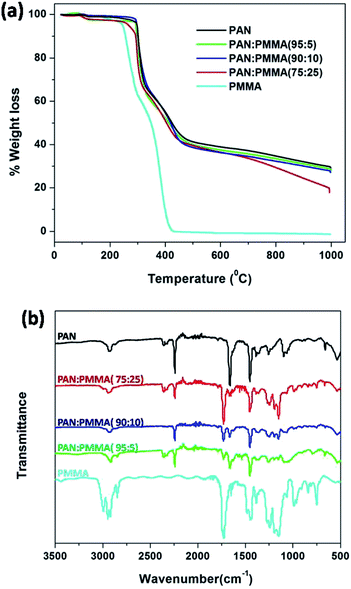 |
| | Fig. 6 (a) TGA analysis and (b) FTIR analysis of PMMA, as-spun mat of PAN and blends. | |
FTIR spectra of pure PMMA, as-spun mats of neat PAN and blends were obtained to confirm actual incorporation of PMMA into the PAN. The FTIR spectrum of PMMA is shown in Fig. 6(b) and the characteristic absorption band of carbonyl stretching is observed at 1730 cm−1.32 FTIR spectrum of neat PAN shows an absorption band at 2243 cm−1, which is assigned to the –C![[triple bond, length as m-dash]](https://www.rsc.org/images/entities/char_e002.gif) N stretching of acrylonitrile unit in the polymer chain.30 After blending, all the blends show the absorptions at 1730 cm−1 and 2243 cm−1 indicating the presence of both PMMA and PAN. Furthermore, the carbonyl stretching absorption at 1730 cm−1 becomes more intense upon increasing the amount of PMMA.
N stretching of acrylonitrile unit in the polymer chain.30 After blending, all the blends show the absorptions at 1730 cm−1 and 2243 cm−1 indicating the presence of both PMMA and PAN. Furthermore, the carbonyl stretching absorption at 1730 cm−1 becomes more intense upon increasing the amount of PMMA.
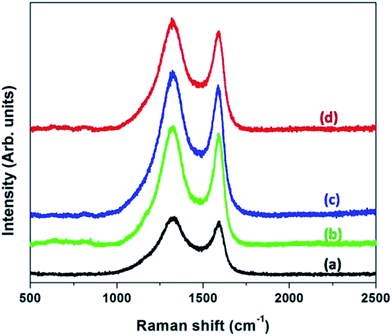 |
| | Fig. 7 Raman spectra of CNFs derived from (a) neat PAN (b) PAN![[thin space (1/6-em)]](https://www.rsc.org/images/entities/char_2009.gif) : :![[thin space (1/6-em)]](https://www.rsc.org/images/entities/char_2009.gif) PMMA (95 PMMA (95![[thin space (1/6-em)]](https://www.rsc.org/images/entities/char_2009.gif) : :![[thin space (1/6-em)]](https://www.rsc.org/images/entities/char_2009.gif) 5) (c) PAN 5) (c) PAN![[thin space (1/6-em)]](https://www.rsc.org/images/entities/char_2009.gif) : :![[thin space (1/6-em)]](https://www.rsc.org/images/entities/char_2009.gif) PMMA (90 PMMA (90![[thin space (1/6-em)]](https://www.rsc.org/images/entities/char_2009.gif) : :![[thin space (1/6-em)]](https://www.rsc.org/images/entities/char_2009.gif) 10) and (d) PAN 10) and (d) PAN![[thin space (1/6-em)]](https://www.rsc.org/images/entities/char_2009.gif) : :![[thin space (1/6-em)]](https://www.rsc.org/images/entities/char_2009.gif) PMMA (75 PMMA (75![[thin space (1/6-em)]](https://www.rsc.org/images/entities/char_2009.gif) : :![[thin space (1/6-em)]](https://www.rsc.org/images/entities/char_2009.gif) 25). 25). | |
Raman spectroscopy was used to estimate the degree of graphitization of the activated samples (Fig. 7). The band centered at 1350 cm−1 is known as the “D-band” which is indicative of disordered carbonaceous structures and amorphous carbon while the band centered at 1580 cm−1 is known as the “G-band” and corresponds to the ordered graphitic structures.33 Table 1 shows the ID/IG ratios of CNFs derived from PAN and PAN/PMMA blends and these ratios are obtained based on the area of the two peaks. According to the Table 1, CNFs derived from PAN shows the ID/IG Ratio of 3.33 indicating the presence of a high amount of amorphous carbon. Addition of PMMA is advantageous, since it causes the ID/IG ratio to decrease as a result of the formation of more ordered carbon structures. Even though the addition of PMMA to PAN increases the degree of graphitization compared to PAN, as the PMMA loading increases the degree of graphitization decreases as evident by the ID/IG ratio (Table 1). The effect on the morphology of electrospun fibers upon incorporated of 25% PMMA in PAN/PMMA precursor blends has been reported.26
Table 1 Ratios of peak intensities of CNFs derived from PAN and the PAN/PMMA blends
| Precursor |
ID/IG ratio |
| PAN |
3.33 |
PAN![[thin space (1/6-em)]](https://www.rsc.org/images/entities/char_2009.gif) : :![[thin space (1/6-em)]](https://www.rsc.org/images/entities/char_2009.gif) PMMA (95 PMMA (95![[thin space (1/6-em)]](https://www.rsc.org/images/entities/char_2009.gif) : :![[thin space (1/6-em)]](https://www.rsc.org/images/entities/char_2009.gif) 5) 5) |
2.89 |
PAN![[thin space (1/6-em)]](https://www.rsc.org/images/entities/char_2009.gif) : :![[thin space (1/6-em)]](https://www.rsc.org/images/entities/char_2009.gif) PMMA (90 PMMA (90![[thin space (1/6-em)]](https://www.rsc.org/images/entities/char_2009.gif) : :![[thin space (1/6-em)]](https://www.rsc.org/images/entities/char_2009.gif) 10) 10) |
3.02 |
PAN![[thin space (1/6-em)]](https://www.rsc.org/images/entities/char_2009.gif) : :![[thin space (1/6-em)]](https://www.rsc.org/images/entities/char_2009.gif) PMMA (75 PMMA (75![[thin space (1/6-em)]](https://www.rsc.org/images/entities/char_2009.gif) : :![[thin space (1/6-em)]](https://www.rsc.org/images/entities/char_2009.gif) 25) 25) |
3.03 |
3.2 Electrochemical properties of CNFs
The cyclic voltammograms (CV) for the PAN/PMMA precursor blends with different ratios of PMMA are shown in Fig. 9. CV curves were collected in the potential range −2.0 to 2.0 V at five different scan rates ranging from 10 to 100 mV s−1. In EDLC, the rectangular shaped CV indicates the ideal double layer capacitive behavior. The highest specific capacitance obtained for the carbonized PAN was 91 F g−1. The specific capacitances of CNFs of PAN![[thin space (1/6-em)]](https://www.rsc.org/images/entities/char_2009.gif) :
:![[thin space (1/6-em)]](https://www.rsc.org/images/entities/char_2009.gif) PMMA (95
PMMA (95![[thin space (1/6-em)]](https://www.rsc.org/images/entities/char_2009.gif) :
:![[thin space (1/6-em)]](https://www.rsc.org/images/entities/char_2009.gif) 5), PAN
5), PAN![[thin space (1/6-em)]](https://www.rsc.org/images/entities/char_2009.gif) :
:![[thin space (1/6-em)]](https://www.rsc.org/images/entities/char_2009.gif) PMMA (90
PMMA (90![[thin space (1/6-em)]](https://www.rsc.org/images/entities/char_2009.gif) :
:![[thin space (1/6-em)]](https://www.rsc.org/images/entities/char_2009.gif) 10) and PAN
10) and PAN![[thin space (1/6-em)]](https://www.rsc.org/images/entities/char_2009.gif) :
:![[thin space (1/6-em)]](https://www.rsc.org/images/entities/char_2009.gif) PMMA (75
PMMA (75![[thin space (1/6-em)]](https://www.rsc.org/images/entities/char_2009.gif) :
:![[thin space (1/6-em)]](https://www.rsc.org/images/entities/char_2009.gif) 25) at the scan rate of 10 mV s−1 were determined to be 140, 135, and 128 F g−1, respectively. PAN
25) at the scan rate of 10 mV s−1 were determined to be 140, 135, and 128 F g−1, respectively. PAN![[thin space (1/6-em)]](https://www.rsc.org/images/entities/char_2009.gif) :
:![[thin space (1/6-em)]](https://www.rsc.org/images/entities/char_2009.gif) PMMA (95
PMMA (95![[thin space (1/6-em)]](https://www.rsc.org/images/entities/char_2009.gif) :
:![[thin space (1/6-em)]](https://www.rsc.org/images/entities/char_2009.gif) 5), which has the highest percentage of mesopores and surface area, showed the best electrochemical performance (Table 3).
5), which has the highest percentage of mesopores and surface area, showed the best electrochemical performance (Table 3).
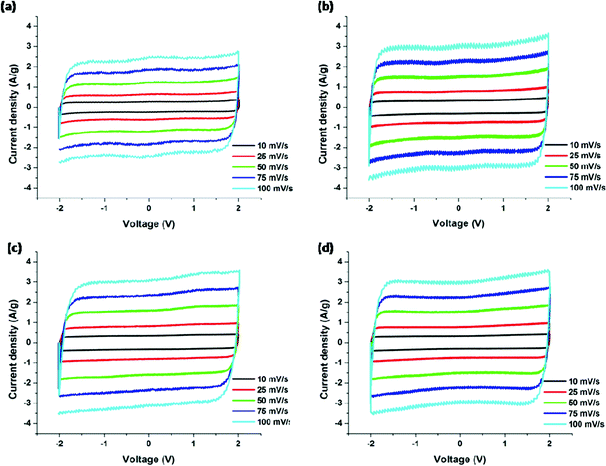 |
| | Fig. 9 Cyclic voltammograms of carbonized nanofibers derived from (a) PAN, (b) PAN/PMMA (95![[thin space (1/6-em)]](https://www.rsc.org/images/entities/char_2009.gif) : :![[thin space (1/6-em)]](https://www.rsc.org/images/entities/char_2009.gif) 5), (c) PAN/PMMA (90 5), (c) PAN/PMMA (90![[thin space (1/6-em)]](https://www.rsc.org/images/entities/char_2009.gif) : :![[thin space (1/6-em)]](https://www.rsc.org/images/entities/char_2009.gif) 10) and (d) PAN/PMMA (75 10) and (d) PAN/PMMA (75![[thin space (1/6-em)]](https://www.rsc.org/images/entities/char_2009.gif) : :![[thin space (1/6-em)]](https://www.rsc.org/images/entities/char_2009.gif) 25). 25). | |
Table 3 Specific capacitance F g−1 of the CNFs derived from the PAN and the PAN/PMMA blends at five different scan rates
| Scan rate (mV S−1) |
Specific capacitance (F g−1) |
| PAN |
PAN![[thin space (1/6-em)]](https://www.rsc.org/images/entities/char_2009.gif) : :![[thin space (1/6-em)]](https://www.rsc.org/images/entities/char_2009.gif) PMMA (95 PMMA (95![[thin space (1/6-em)]](https://www.rsc.org/images/entities/char_2009.gif) : :![[thin space (1/6-em)]](https://www.rsc.org/images/entities/char_2009.gif) 5) 5) |
PAN![[thin space (1/6-em)]](https://www.rsc.org/images/entities/char_2009.gif) : :![[thin space (1/6-em)]](https://www.rsc.org/images/entities/char_2009.gif) PMMA (90 PMMA (90![[thin space (1/6-em)]](https://www.rsc.org/images/entities/char_2009.gif) : :![[thin space (1/6-em)]](https://www.rsc.org/images/entities/char_2009.gif) 10) 10) |
PAN![[thin space (1/6-em)]](https://www.rsc.org/images/entities/char_2009.gif) : :![[thin space (1/6-em)]](https://www.rsc.org/images/entities/char_2009.gif) PMMA (75 PMMA (75![[thin space (1/6-em)]](https://www.rsc.org/images/entities/char_2009.gif) : :![[thin space (1/6-em)]](https://www.rsc.org/images/entities/char_2009.gif) 25) 25) |
| 10 |
97.2 |
140.2 |
135.1 |
128.1 |
| 25 |
96.6 |
139.3 |
133.7 |
127.9 |
| 50 |
95.9 |
137.6 |
132.4 |
127.8 |
| 75 |
95.3 |
134.2 |
129.8 |
126.2 |
| 100 |
95.1 |
131.8 |
128.5 |
125.2 |
Energy densities were determined by discharging from 3.5 V for all the samples (Fig. 10(a)). Table 4 summarizes the energy and power densities of the carbonized PAN/PMMA nanofibers at a current discharge density of 1 A g−1 and 10 Ag−1. When the current density was increased, the energy density of the carbonized PAN dropped to 75% of that obtained at 1 Ag−1. In contrast, the PAN/PMMA blends retained between 82–86% of their original energy densities. The activated PAN gave an energy density of 49.4 W h kg−1 and it is remarkably increased to 67.4 W h kg−1 after blending with a small amount (5 wt%) of PMMA, in PAN/PMMA blend nanofibers. Also, PAN/PMMA (90![[thin space (1/6-em)]](https://www.rsc.org/images/entities/char_2009.gif) :
:![[thin space (1/6-em)]](https://www.rsc.org/images/entities/char_2009.gif) 10) and PAN
10) and PAN![[thin space (1/6-em)]](https://www.rsc.org/images/entities/char_2009.gif) :
:![[thin space (1/6-em)]](https://www.rsc.org/images/entities/char_2009.gif) PMMA (75
PMMA (75![[thin space (1/6-em)]](https://www.rsc.org/images/entities/char_2009.gif) :
:![[thin space (1/6-em)]](https://www.rsc.org/images/entities/char_2009.gif) 25) exhibit energy densities of 63.2 W h kg−1 and 61.4 W h kg−1 respectively. PAN
25) exhibit energy densities of 63.2 W h kg−1 and 61.4 W h kg−1 respectively. PAN![[thin space (1/6-em)]](https://www.rsc.org/images/entities/char_2009.gif) :
:![[thin space (1/6-em)]](https://www.rsc.org/images/entities/char_2009.gif) PMMA (95
PMMA (95![[thin space (1/6-em)]](https://www.rsc.org/images/entities/char_2009.gif) :
:![[thin space (1/6-em)]](https://www.rsc.org/images/entities/char_2009.gif) 5) gave an energy density of 101 W h kg−1 when discharged from 4 V. Fig. 10(b) shows the discharge curves for PAN/PMMA blends. Discharge curves for PAN/PMMA blends are linear with no significant IR drop in contrast to PAN. The PAN
5) gave an energy density of 101 W h kg−1 when discharged from 4 V. Fig. 10(b) shows the discharge curves for PAN/PMMA blends. Discharge curves for PAN/PMMA blends are linear with no significant IR drop in contrast to PAN. The PAN![[thin space (1/6-em)]](https://www.rsc.org/images/entities/char_2009.gif) :
:![[thin space (1/6-em)]](https://www.rsc.org/images/entities/char_2009.gif) PMMA (95
PMMA (95![[thin space (1/6-em)]](https://www.rsc.org/images/entities/char_2009.gif) :
:![[thin space (1/6-em)]](https://www.rsc.org/images/entities/char_2009.gif) 5) showed the longest discharge time followed by PAN
5) showed the longest discharge time followed by PAN![[thin space (1/6-em)]](https://www.rsc.org/images/entities/char_2009.gif) :
:![[thin space (1/6-em)]](https://www.rsc.org/images/entities/char_2009.gif) PMMA (90
PMMA (90![[thin space (1/6-em)]](https://www.rsc.org/images/entities/char_2009.gif) :
:![[thin space (1/6-em)]](https://www.rsc.org/images/entities/char_2009.gif) 10), PAN
10), PAN![[thin space (1/6-em)]](https://www.rsc.org/images/entities/char_2009.gif) :
:![[thin space (1/6-em)]](https://www.rsc.org/images/entities/char_2009.gif) PMMA (75
PMMA (75![[thin space (1/6-em)]](https://www.rsc.org/images/entities/char_2009.gif) :
:![[thin space (1/6-em)]](https://www.rsc.org/images/entities/char_2009.gif) 25) and PAN.
25) and PAN.
Table 4 Energy densities and the power densities of the CNF derived from PAN and PAN/PMMA blends
| Current density (A g−1) |
Parameters |
PAN |
PAN![[thin space (1/6-em)]](https://www.rsc.org/images/entities/char_2009.gif) : :![[thin space (1/6-em)]](https://www.rsc.org/images/entities/char_2009.gif) PMMA (95 PMMA (95![[thin space (1/6-em)]](https://www.rsc.org/images/entities/char_2009.gif) : :![[thin space (1/6-em)]](https://www.rsc.org/images/entities/char_2009.gif) 5) 5) |
PAN![[thin space (1/6-em)]](https://www.rsc.org/images/entities/char_2009.gif) : :![[thin space (1/6-em)]](https://www.rsc.org/images/entities/char_2009.gif) PMMA (90 PMMA (90![[thin space (1/6-em)]](https://www.rsc.org/images/entities/char_2009.gif) : :![[thin space (1/6-em)]](https://www.rsc.org/images/entities/char_2009.gif) 10) 10) |
PAN![[thin space (1/6-em)]](https://www.rsc.org/images/entities/char_2009.gif) : :![[thin space (1/6-em)]](https://www.rsc.org/images/entities/char_2009.gif) PMMA (75 PMMA (75![[thin space (1/6-em)]](https://www.rsc.org/images/entities/char_2009.gif) : :![[thin space (1/6-em)]](https://www.rsc.org/images/entities/char_2009.gif) 25) 25) |
| 1 |
Energy density (W h kg−1) |
50.1 |
67.4 |
63.2 |
61.4 |
| Power density (W kg−1) |
1724 |
1715 |
1727 |
1727 |
| 10 |
Energy density (W h kg−1) |
37.4 |
55.4 |
51.9 |
52.9 |
| Power density (W kg−1) |
15![[thin space (1/6-em)]](https://www.rsc.org/images/entities/char_2009.gif) 664 664 |
15![[thin space (1/6-em)]](https://www.rsc.org/images/entities/char_2009.gif) 376 376 |
15![[thin space (1/6-em)]](https://www.rsc.org/images/entities/char_2009.gif) 830 830 |
15![[thin space (1/6-em)]](https://www.rsc.org/images/entities/char_2009.gif) 707 707 |
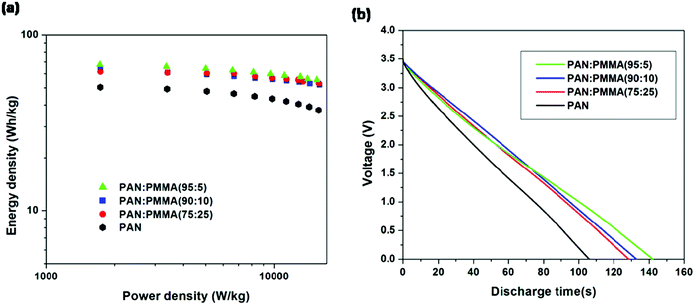 |
| | Fig. 10 (a) Ragone plots (b) galvanostatic discharging curves at a constant current density of 1 A g−1. | |
Fig. 11 displays Nyquist plots for the CNF samples prepared from the PAN and PAN/PMMA blends in EMITFSI electrolyte. Electrochemical impedance spectroscopy (EIS) can provide more detailed information such as pore structure of electrode materials and kinetics in double-layer charging/discharging processes, in which a semi-circle appears in the high frequency region and an almost vertical increase in lower frequency region, indicative of ideal capacitance.34 In the Nyquist plot, the x-intercept at the highest frequency region is called bulk electrolyte resistance which mainly depends on the electrolyte solution. The high frequency semicircle can be assigned to two resistances, namely, the contact resistance between porous electrode and current collector or the ion transfer resistance. The semicircle of the all the CNF samples prepared from the PAN/PMMA blends were smaller than that of CNF prepared from neat PAN, which indicates that the ion transfer resistance is reduced with the incorporation of PMMA. This result can be attributed to the formation of pores that can accommodate ions as a consequence of sacrificial PMMA incorporation. The semi-circle of CNF prepared from the PAN![[thin space (1/6-em)]](https://www.rsc.org/images/entities/char_2009.gif) :
:![[thin space (1/6-em)]](https://www.rsc.org/images/entities/char_2009.gif) PMMA (95
PMMA (95![[thin space (1/6-em)]](https://www.rsc.org/images/entities/char_2009.gif) :
:![[thin space (1/6-em)]](https://www.rsc.org/images/entities/char_2009.gif) 5) blend was the smallest, indicating the lowest ion transfer resistance in the electrode/electrolyte interface. According to the pore size analysis, PAN
5) blend was the smallest, indicating the lowest ion transfer resistance in the electrode/electrolyte interface. According to the pore size analysis, PAN![[thin space (1/6-em)]](https://www.rsc.org/images/entities/char_2009.gif) :
:![[thin space (1/6-em)]](https://www.rsc.org/images/entities/char_2009.gif) PMMA (95
PMMA (95![[thin space (1/6-em)]](https://www.rsc.org/images/entities/char_2009.gif) :
:![[thin space (1/6-em)]](https://www.rsc.org/images/entities/char_2009.gif) 5) shows the formation of a larger number of mesopores, which favors greater ion accessibility into the pores of electrodes which are in contact with the electrolyte.
5) shows the formation of a larger number of mesopores, which favors greater ion accessibility into the pores of electrodes which are in contact with the electrolyte.
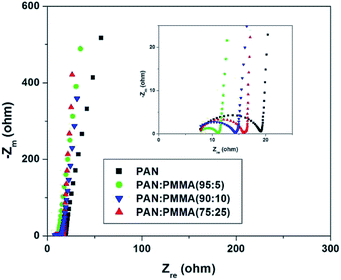 |
| | Fig. 11 Nyquist plots for the CNF samples prepared from the PAN and PAN/PMMA blends in EMITFSI ionic electrolyte. | |
In order to further investigate the electrochemical stability of the electrode material, the best composition of PAN![[thin space (1/6-em)]](https://www.rsc.org/images/entities/char_2009.gif) :
:![[thin space (1/6-em)]](https://www.rsc.org/images/entities/char_2009.gif) PMMA (95
PMMA (95![[thin space (1/6-em)]](https://www.rsc.org/images/entities/char_2009.gif) :
:![[thin space (1/6-em)]](https://www.rsc.org/images/entities/char_2009.gif) 5) was selected for the cycling test in ionic liquid electrolyte (EMITFSI) and result is shown in Fig. 12. After 100th cycle 93.8% of the specific capacitance was retained while after 1000th cycle 85% of the capacitance was retained. These results demonstrate that the activated carbons derived from PAN
5) was selected for the cycling test in ionic liquid electrolyte (EMITFSI) and result is shown in Fig. 12. After 100th cycle 93.8% of the specific capacitance was retained while after 1000th cycle 85% of the capacitance was retained. These results demonstrate that the activated carbons derived from PAN![[thin space (1/6-em)]](https://www.rsc.org/images/entities/char_2009.gif) :
:![[thin space (1/6-em)]](https://www.rsc.org/images/entities/char_2009.gif) PMMA (95
PMMA (95![[thin space (1/6-em)]](https://www.rsc.org/images/entities/char_2009.gif) :
:![[thin space (1/6-em)]](https://www.rsc.org/images/entities/char_2009.gif) 5) exhibit a high degree of reversibility leading to good cycle stability, making them potentially suitable electrode materials for high performing supercapacitors.
5) exhibit a high degree of reversibility leading to good cycle stability, making them potentially suitable electrode materials for high performing supercapacitors.
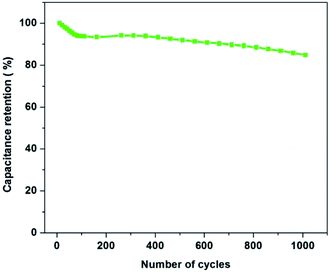 |
| | Fig. 12 Capacitance retention of PAN![[thin space (1/6-em)]](https://www.rsc.org/images/entities/char_2009.gif) : :![[thin space (1/6-em)]](https://www.rsc.org/images/entities/char_2009.gif) PMMA (95 PMMA (95![[thin space (1/6-em)]](https://www.rsc.org/images/entities/char_2009.gif) : :![[thin space (1/6-em)]](https://www.rsc.org/images/entities/char_2009.gif) 5) over 1000 charge/discharge cycles at a current density of 1 A g−1. 5) over 1000 charge/discharge cycles at a current density of 1 A g−1. | |
4. Conclusion
In this study, the correlation between precursor composition of immiscible PAN/PMMA blends and their electrochemical performances were studied. Polymer solutions of PAN, PAN/PMMA (95![[thin space (1/6-em)]](https://www.rsc.org/images/entities/char_2009.gif) :
:![[thin space (1/6-em)]](https://www.rsc.org/images/entities/char_2009.gif) 5), PAN/PMMA (90
5), PAN/PMMA (90![[thin space (1/6-em)]](https://www.rsc.org/images/entities/char_2009.gif) :
:![[thin space (1/6-em)]](https://www.rsc.org/images/entities/char_2009.gif) 10) and PAN/PMMA (75
10) and PAN/PMMA (75![[thin space (1/6-em)]](https://www.rsc.org/images/entities/char_2009.gif) :
:![[thin space (1/6-em)]](https://www.rsc.org/images/entities/char_2009.gif) 25) were prepared, and electrospun to form free standing nanofiber mats. Porous CNFs were obtained from PAN and PAN/PMMA blends after thermal treatments. The introduction of PMMA into the PAN increases the surface area of PAN nanofibers leading to enhanced electrochemical performances of the carbon CNFs. This improvement is attributed to the formation of pores with both microporosity and mesoporosity that afforded ready electrolyte access. PAN/PMMA (95
25) were prepared, and electrospun to form free standing nanofiber mats. Porous CNFs were obtained from PAN and PAN/PMMA blends after thermal treatments. The introduction of PMMA into the PAN increases the surface area of PAN nanofibers leading to enhanced electrochemical performances of the carbon CNFs. This improvement is attributed to the formation of pores with both microporosity and mesoporosity that afforded ready electrolyte access. PAN/PMMA (95![[thin space (1/6-em)]](https://www.rsc.org/images/entities/char_2009.gif) :
:![[thin space (1/6-em)]](https://www.rsc.org/images/entities/char_2009.gif) 5) CNFs show the highest degree of graphitization, highest carbon yield, lowest charge transfer resistance, good cycle stability, highest capacitance of 140 F g−1 as well as energy densities of 67 W h kg−1 at 3.5 V and 101 W h kg−1 at 4 V in EMITFSI electrolyte. The preparation of PAN/PMMA immiscible polymer blends by incorporating PMMA has been found to be an effective method to increase the energy density of supercapacitors with PAN
5) CNFs show the highest degree of graphitization, highest carbon yield, lowest charge transfer resistance, good cycle stability, highest capacitance of 140 F g−1 as well as energy densities of 67 W h kg−1 at 3.5 V and 101 W h kg−1 at 4 V in EMITFSI electrolyte. The preparation of PAN/PMMA immiscible polymer blends by incorporating PMMA has been found to be an effective method to increase the energy density of supercapacitors with PAN![[thin space (1/6-em)]](https://www.rsc.org/images/entities/char_2009.gif) :
:![[thin space (1/6-em)]](https://www.rsc.org/images/entities/char_2009.gif) PMMA (95
PMMA (95![[thin space (1/6-em)]](https://www.rsc.org/images/entities/char_2009.gif) :
:![[thin space (1/6-em)]](https://www.rsc.org/images/entities/char_2009.gif) 5) being especially promising.
5) being especially promising.
Acknowledgements
The authors acknowledge the National Science Foundation (Grant no. IIP-1127564) for financial support. We also thank Dr Ronald A. Smaldone and Dr Christina Thompson and Sajani Basnayake for help with the surface area analysis. Valuable discussions with Dr Lissa Magel (Solarno, Inc.), Dr Nimanka P. Panapitiya and Dr Sumudu N. Wijenayake are also greatly appreciated.
Notes and references
- M. Winter and R. J. Brodd, Chem. Rev., 2004, 104, 4245–4270 CrossRef CAS
 .
. - A. Burke, J. Power Sources, 2000, 91, 37–50 CrossRef CAS
 .
. - R. Kotz and M. Carlen, Electrochim. Acta, 2000, 45, 2483–2498 CrossRef CAS
 .
. - D. Qu and H. Shi, J. Power Sources, 1998, 74, 99–107 CrossRef CAS
 .
. - C. Vix-Guterl, E. Frackowiak, K. Jurewicz, M. Friebe, J. Parmentier and F. Beguin, Carbon, 2005, 43, 1293–1302 CrossRef CAS PubMed
 .
. - Y. Zhai, Y. Dou, D. Zhao, P. F. Fulvio, R. T. Mayes and S. Dai, Adv. Mater., 2011, 23, 4828–4850 CrossRef CAS PubMed
 .
. - H. Shi, Electrochim. Acta, 1996, 41, 1633–1639 CrossRef CAS
 .
. - N. Bui, B. Kim, K. S. Yang, M. E. Dela and J. P. Ferraris, Carbon, 2009, 47, 2538–2539 CrossRef CAS PubMed
 .
. - J. S. Bonso, G. D. Kalaw and J. P. Ferraris, J. Mater. Chem. A, 2014, 2, 418–424 CAS
 .
. - Y. Jang, T. Amna, M. S. Hassan, J. Gu, I. Kim, H. Kim, J. Kim, S. Baik and M. Khil, RSC Adv., 2014, 4, 17268–17273 RSC
 .
. - C. Ma, Y. Song, J. Shi, D. Zhang, M. Zhong, Q. Guo and L. Liu, Mater. Lett., 2012, 76, 211–214 CrossRef CAS PubMed
 .
. - M. Arulepp, J. Leis, M. Laett, F. Miller, K. Rumma, E. Lust and A. F. Burke, J. Power Sources, 2006, 162, 1460–1466 CrossRef CAS PubMed
 .
. - S. Han, M. Kim and T. Hyeon, Carbon, 2003, 41, 1525–1532 CrossRef CAS
 .
. - Z. Zhou, X. Wu and H. Hou, RSC Adv., 2014, 4, 23622–23629 RSC
 .
. - M. D. Stoller, S. Park, Y. Zhu, J. An and R. S. Ruoff, Nano Lett., 2008, 8, 3498–3502 CrossRef CAS PubMed
 .
. - C. Kim and K. S. Yang, Appl. Phys. Lett., 2003, 83, 1216–1218 CrossRef CAS PubMed
 .
. - Y. Du, X. Zhao, Z. Huang, Y. Li and Q. Zhang, RSC Adv., 2014, 4, 39087–39094 RSC
 .
. - D. Li and Y. Xia, Adv. Mater., 2004, 16, 1151–1170 CrossRef CAS
 .
. - C. Largeot, C. Portet, J. Chmiola, P.-L. Taberna, Y. Gogotsi and P. Simon, J. Am. Chem. Soc., 2008, 130, 2730–2731 CrossRef CAS PubMed
 .
. - M. Lazzari, M. Mastragostino, A. G. Pandolfo, V. Ruiz and F. Soavi, J. Electrochem. Soc., 2011, 158, A22–A25 CrossRef CAS PubMed
 .
. - E. Jo, J.-G. Yeo, D. K. Kim, J. S. Oh and C. K. Hong, Polym. Int., 2014, 63, 1471–1477 CrossRef CAS
 .
. - C. Tran and V. Kalra, J. Power Sources, 2013, 235, 289–296 CrossRef CAS PubMed
 .
. - M. Dirican, M. Yanilmaz and X. Zhang, RSC Adv., 2014, 4, 59427–59435 RSC
 .
. - B.-H. Kim, K. S. Yang and J. P. Ferraris, Electrochim. Acta, 2012, 75, 325–331 CrossRef CAS PubMed
 .
. - M. Zhi, S. Liu, Z. Hong and N. Wu, RSC Adv., 2014, 4, 43619–43623 RSC
 .
. - C. K. Hong, K. S. Yang, S. H. Oh, J. H. Ahn, B.-H. Cho and C. Nah, Polym. Int., 2008, 57, 1357–1362 CrossRef CAS
 .
. - X.-G. Li, I. Kresse, J. Springer, J. Nissen and Y. Yang, Polymer, 2001, 42, 6859–6869 CrossRef CAS
 .
. - N. P. Panapitiya, S. N. Wijenayake, Y. Huang, D. Bushdiecker, D. Nguyen, C. Ratanawanate, G. J. Kalaw, C. J. Gilpin, I. H. Musselman, K. J. Balkus and J. P. Ferraris, Polymer, 2014, 55, 2028–2034 CrossRef CAS PubMed
 .
. - A. G. El-Deen, N. A. M. Barakat, K. A. Khalil and H. Y. Kim, J. Mater. Chem. A, 2013, 1, 11001–11010 CAS
 .
. - S. K. Nataraj, K. S. Yang and T. M. Aminabhavi, Prog. Polym. Sci., 2012, 37, 487–513 CrossRef CAS PubMed
 .
. - H. Zhang, F. Dong, S. Fang, C. Ye, M. Wang, H. Cheng, Z. Han and S. Zhai, J. Colloid Interface Sci., 2012, 386, 73–79 CrossRef CAS PubMed
 .
. - G. Duan, C. Zhang, A. Li, X. Yang, L. Lu and X. Wang, Nanoscale Res. Lett., 2008, 3, 118–122 CrossRef CAS PubMed
 .
. - M. Endo, C. Kim, T. Karaki, T. Kasai, M. J. Matthews, S. D. Brown, M. Brown, M. S. Dresselhaus, T. Tamaki and Y. Nishimura, Carbon, 1998, 36, 1633–1641 CrossRef CAS
 .
. - H. D. Yoo, J. H. Jang, J. H. Ryu, Y. Yuwon Park and S. M. Oh, J. Power Sources, 2014, 267, 411–420 CrossRef CAS PubMed
 .
.
|
| This journal is © The Royal Society of Chemistry 2015 |
Click here to see how this site uses Cookies. View our privacy policy here. ![[thin space (1/6-em)]](https://www.rsc.org/images/entities/char_2009.gif) :
:![[thin space (1/6-em)]](https://www.rsc.org/images/entities/char_2009.gif) PMMA (95
PMMA (95![[thin space (1/6-em)]](https://www.rsc.org/images/entities/char_2009.gif) :
:![[thin space (1/6-em)]](https://www.rsc.org/images/entities/char_2009.gif) 5), was found to be the optimum blend composition, affording the highest surface area of 2419 m2 g−1, higher degree of graphitization, higher carbon yield and lower charge transfer resistance among the blend compositions studied. Furthermore, the PAN
5), was found to be the optimum blend composition, affording the highest surface area of 2419 m2 g−1, higher degree of graphitization, higher carbon yield and lower charge transfer resistance among the blend compositions studied. Furthermore, the PAN![[thin space (1/6-em)]](https://www.rsc.org/images/entities/char_2009.gif) :
:![[thin space (1/6-em)]](https://www.rsc.org/images/entities/char_2009.gif) PMMA (95
PMMA (95![[thin space (1/6-em)]](https://www.rsc.org/images/entities/char_2009.gif) :
:![[thin space (1/6-em)]](https://www.rsc.org/images/entities/char_2009.gif) 5) CNFs showed the highest capacitance of 140 F g−1 and energy densities of 67 W h kg−1 at 3.5 V and 101 W h kg−1 at 4 V in an ionic electrolyte (EMITFSI) and also showed good cycling stability with 85% capacitance retention after 1000 cycles.
5) CNFs showed the highest capacitance of 140 F g−1 and energy densities of 67 W h kg−1 at 3.5 V and 101 W h kg−1 at 4 V in an ionic electrolyte (EMITFSI) and also showed good cycling stability with 85% capacitance retention after 1000 cycles.
![[thin space (1/6-em)]](https://www.rsc.org/images/entities/char_2009.gif) 000 g mol−1) was purchased from Pfaltz and Bauer, Inc. Polymethyl methacrylate (PMMA, Mw = 120
000 g mol−1) was purchased from Pfaltz and Bauer, Inc. Polymethyl methacrylate (PMMA, Mw = 120![[thin space (1/6-em)]](https://www.rsc.org/images/entities/char_2009.gif) 000 g mol−1) and anhydrous N,N′-dimethylformamide (DMF) were purchased from Sigma Aldrich and used as received without further purification. Electrochemical grade ethylmethylimidazolium bis(trifluoromethylsulfonyl)imide (EMITFSI), (99.5% purity) was purchased from IoLiTec, Inc. and was used as received. The coin cell assembly parts were obtained from Shenzhen Yongxingye Precision Machinery Mould Co. Ltd., China.
000 g mol−1) and anhydrous N,N′-dimethylformamide (DMF) were purchased from Sigma Aldrich and used as received without further purification. Electrochemical grade ethylmethylimidazolium bis(trifluoromethylsulfonyl)imide (EMITFSI), (99.5% purity) was purchased from IoLiTec, Inc. and was used as received. The coin cell assembly parts were obtained from Shenzhen Yongxingye Precision Machinery Mould Co. Ltd., China.
![[thin space (1/6-em)]](https://www.rsc.org/images/entities/char_2009.gif) :
:![[thin space (1/6-em)]](https://www.rsc.org/images/entities/char_2009.gif) PMMA (95
PMMA (95![[thin space (1/6-em)]](https://www.rsc.org/images/entities/char_2009.gif) :
:![[thin space (1/6-em)]](https://www.rsc.org/images/entities/char_2009.gif) 5), PAN
5), PAN![[thin space (1/6-em)]](https://www.rsc.org/images/entities/char_2009.gif) :
:![[thin space (1/6-em)]](https://www.rsc.org/images/entities/char_2009.gif) PMMA (90
PMMA (90![[thin space (1/6-em)]](https://www.rsc.org/images/entities/char_2009.gif) :
:![[thin space (1/6-em)]](https://www.rsc.org/images/entities/char_2009.gif) 10) and PAN
10) and PAN![[thin space (1/6-em)]](https://www.rsc.org/images/entities/char_2009.gif) :
:![[thin space (1/6-em)]](https://www.rsc.org/images/entities/char_2009.gif) PMMA (75
PMMA (75![[thin space (1/6-em)]](https://www.rsc.org/images/entities/char_2009.gif) :
:![[thin space (1/6-em)]](https://www.rsc.org/images/entities/char_2009.gif) 25) blend compositions. These solutions were further stirred for 24 h at room temperature. In addition, a 10 wt% PAN control solution was also prepared by following the same procedure. The solutions were electrospun using a custom-built electrospinner under an applied voltage of 15 kV (Gamma High Voltage Research, Inc., power supply). The polymer solutions were loaded into the syringe and the attached needle tip was connected to the positive voltage of the power supply. The polymer solutions were delivered to the tip at a constant flow rate of 0.8 ml h−1 controlled by a syringe pump and the grounded drum collector was placed 15 cm away from the needle tip and rotated at 300 rpm. Electrospun nanofiber mats were stabilized at 280 °C for 1 h under air flow at a heating rate of 2 °C min−1 and then carbonized and CO2 activated for 1 h at 1000 °C under helium at a heating rate of 5 °C min−1.
25) blend compositions. These solutions were further stirred for 24 h at room temperature. In addition, a 10 wt% PAN control solution was also prepared by following the same procedure. The solutions were electrospun using a custom-built electrospinner under an applied voltage of 15 kV (Gamma High Voltage Research, Inc., power supply). The polymer solutions were loaded into the syringe and the attached needle tip was connected to the positive voltage of the power supply. The polymer solutions were delivered to the tip at a constant flow rate of 0.8 ml h−1 controlled by a syringe pump and the grounded drum collector was placed 15 cm away from the needle tip and rotated at 300 rpm. Electrospun nanofiber mats were stabilized at 280 °C for 1 h under air flow at a heating rate of 2 °C min−1 and then carbonized and CO2 activated for 1 h at 1000 °C under helium at a heating rate of 5 °C min−1.
![[thin space (1/6-em)]](https://www.rsc.org/images/entities/char_2009.gif) :
:![[thin space (1/6-em)]](https://www.rsc.org/images/entities/char_2009.gif) PMMA (95
PMMA (95![[thin space (1/6-em)]](https://www.rsc.org/images/entities/char_2009.gif) :
:![[thin space (1/6-em)]](https://www.rsc.org/images/entities/char_2009.gif) 5), 472 ± 97 nm for PAN
5), 472 ± 97 nm for PAN![[thin space (1/6-em)]](https://www.rsc.org/images/entities/char_2009.gif) :
:![[thin space (1/6-em)]](https://www.rsc.org/images/entities/char_2009.gif) PMMA (90
PMMA (90![[thin space (1/6-em)]](https://www.rsc.org/images/entities/char_2009.gif) :
:![[thin space (1/6-em)]](https://www.rsc.org/images/entities/char_2009.gif) 10) and 353 ± 88 nm for PAN
10) and 353 ± 88 nm for PAN![[thin space (1/6-em)]](https://www.rsc.org/images/entities/char_2009.gif) :
:![[thin space (1/6-em)]](https://www.rsc.org/images/entities/char_2009.gif) PMMA (75
PMMA (75![[thin space (1/6-em)]](https://www.rsc.org/images/entities/char_2009.gif) :
:![[thin space (1/6-em)]](https://www.rsc.org/images/entities/char_2009.gif) 25). The trend can be attributed to the lower viscosity of the solutions with higher amount of PMMA compared to that of neat PAN solution.26 During electrospinning, the dispersed PMMA droplets, having a lower viscosity compared to that of PAN, would be elongated more by the electrical forces and thus the fiber diameter is reduced further.26
25). The trend can be attributed to the lower viscosity of the solutions with higher amount of PMMA compared to that of neat PAN solution.26 During electrospinning, the dispersed PMMA droplets, having a lower viscosity compared to that of PAN, would be elongated more by the electrical forces and thus the fiber diameter is reduced further.26

![[thin space (1/6-em)]](https://www.rsc.org/images/entities/char_2009.gif) :
:![[thin space (1/6-em)]](https://www.rsc.org/images/entities/char_2009.gif) PMMA (95
PMMA (95![[thin space (1/6-em)]](https://www.rsc.org/images/entities/char_2009.gif) :
:![[thin space (1/6-em)]](https://www.rsc.org/images/entities/char_2009.gif) 5), (c) PAN
5), (c) PAN![[thin space (1/6-em)]](https://www.rsc.org/images/entities/char_2009.gif) :
:![[thin space (1/6-em)]](https://www.rsc.org/images/entities/char_2009.gif) PMMA (90
PMMA (90![[thin space (1/6-em)]](https://www.rsc.org/images/entities/char_2009.gif) :
:![[thin space (1/6-em)]](https://www.rsc.org/images/entities/char_2009.gif) 10) and (d) PAN
10) and (d) PAN![[thin space (1/6-em)]](https://www.rsc.org/images/entities/char_2009.gif) :
:![[thin space (1/6-em)]](https://www.rsc.org/images/entities/char_2009.gif) PMMA (75
PMMA (75![[thin space (1/6-em)]](https://www.rsc.org/images/entities/char_2009.gif) :
:![[thin space (1/6-em)]](https://www.rsc.org/images/entities/char_2009.gif) 25) nanofiber mats.
25) nanofiber mats.![[thin space (1/6-em)]](https://www.rsc.org/images/entities/char_2009.gif) :
:![[thin space (1/6-em)]](https://www.rsc.org/images/entities/char_2009.gif) PMMA (75
PMMA (75![[thin space (1/6-em)]](https://www.rsc.org/images/entities/char_2009.gif) :
:![[thin space (1/6-em)]](https://www.rsc.org/images/entities/char_2009.gif) 25). The average fiber diameter of CNFs for PAN is 260 ± 27 nm while diameters of CNFs from the PAN/PMMA blends are 197 ± 48 nm (PAN
25). The average fiber diameter of CNFs for PAN is 260 ± 27 nm while diameters of CNFs from the PAN/PMMA blends are 197 ± 48 nm (PAN![[thin space (1/6-em)]](https://www.rsc.org/images/entities/char_2009.gif) :
:![[thin space (1/6-em)]](https://www.rsc.org/images/entities/char_2009.gif) PMMA, 95
PMMA, 95![[thin space (1/6-em)]](https://www.rsc.org/images/entities/char_2009.gif) :
:![[thin space (1/6-em)]](https://www.rsc.org/images/entities/char_2009.gif) 5), 106 ± 21 nm (PAN
5), 106 ± 21 nm (PAN![[thin space (1/6-em)]](https://www.rsc.org/images/entities/char_2009.gif) :
:![[thin space (1/6-em)]](https://www.rsc.org/images/entities/char_2009.gif) PMMA, 90
PMMA, 90![[thin space (1/6-em)]](https://www.rsc.org/images/entities/char_2009.gif) :
:![[thin space (1/6-em)]](https://www.rsc.org/images/entities/char_2009.gif) 10), and 87 ± 19 nm (PAN
10), and 87 ± 19 nm (PAN![[thin space (1/6-em)]](https://www.rsc.org/images/entities/char_2009.gif) :
:![[thin space (1/6-em)]](https://www.rsc.org/images/entities/char_2009.gif) PMMA 75
PMMA 75![[thin space (1/6-em)]](https://www.rsc.org/images/entities/char_2009.gif) :
:![[thin space (1/6-em)]](https://www.rsc.org/images/entities/char_2009.gif) 25) nm, respectively.
25) nm, respectively.
![[thin space (1/6-em)]](https://www.rsc.org/images/entities/char_2009.gif) :
:![[thin space (1/6-em)]](https://www.rsc.org/images/entities/char_2009.gif) PMMA (95
PMMA (95![[thin space (1/6-em)]](https://www.rsc.org/images/entities/char_2009.gif) :
:![[thin space (1/6-em)]](https://www.rsc.org/images/entities/char_2009.gif) 5), (c) PAN
5), (c) PAN![[thin space (1/6-em)]](https://www.rsc.org/images/entities/char_2009.gif) :
:![[thin space (1/6-em)]](https://www.rsc.org/images/entities/char_2009.gif) PMMA (90
PMMA (90![[thin space (1/6-em)]](https://www.rsc.org/images/entities/char_2009.gif) :
:![[thin space (1/6-em)]](https://www.rsc.org/images/entities/char_2009.gif) 10) and (d) PAN
10) and (d) PAN![[thin space (1/6-em)]](https://www.rsc.org/images/entities/char_2009.gif) :
:![[thin space (1/6-em)]](https://www.rsc.org/images/entities/char_2009.gif) PMMA (75
PMMA (75![[thin space (1/6-em)]](https://www.rsc.org/images/entities/char_2009.gif) :
:![[thin space (1/6-em)]](https://www.rsc.org/images/entities/char_2009.gif) 25).
25).
![[thin space (1/6-em)]](https://www.rsc.org/images/entities/char_2009.gif) :
:![[thin space (1/6-em)]](https://www.rsc.org/images/entities/char_2009.gif) PMMA (95
PMMA (95![[thin space (1/6-em)]](https://www.rsc.org/images/entities/char_2009.gif) :
:![[thin space (1/6-em)]](https://www.rsc.org/images/entities/char_2009.gif) 5), (c) PAN
5), (c) PAN![[thin space (1/6-em)]](https://www.rsc.org/images/entities/char_2009.gif) :
:![[thin space (1/6-em)]](https://www.rsc.org/images/entities/char_2009.gif) PMMA (90
PMMA (90![[thin space (1/6-em)]](https://www.rsc.org/images/entities/char_2009.gif) :
:![[thin space (1/6-em)]](https://www.rsc.org/images/entities/char_2009.gif) 10) and (d) PAN
10) and (d) PAN![[thin space (1/6-em)]](https://www.rsc.org/images/entities/char_2009.gif) :
:![[thin space (1/6-em)]](https://www.rsc.org/images/entities/char_2009.gif) PMMA (75
PMMA (75![[thin space (1/6-em)]](https://www.rsc.org/images/entities/char_2009.gif) :
:![[thin space (1/6-em)]](https://www.rsc.org/images/entities/char_2009.gif) 25).
25).![[thin space (1/6-em)]](https://www.rsc.org/images/entities/char_2009.gif) :
:![[thin space (1/6-em)]](https://www.rsc.org/images/entities/char_2009.gif) PMMA (95
PMMA (95![[thin space (1/6-em)]](https://www.rsc.org/images/entities/char_2009.gif) :
:![[thin space (1/6-em)]](https://www.rsc.org/images/entities/char_2009.gif) 5) blend exhibited a fairly uniform distribution of PMMA, larger domains with irregular shapes can be observed PAN
5) blend exhibited a fairly uniform distribution of PMMA, larger domains with irregular shapes can be observed PAN![[thin space (1/6-em)]](https://www.rsc.org/images/entities/char_2009.gif) :
:![[thin space (1/6-em)]](https://www.rsc.org/images/entities/char_2009.gif) PMMA (75
PMMA (75![[thin space (1/6-em)]](https://www.rsc.org/images/entities/char_2009.gif) :
:![[thin space (1/6-em)]](https://www.rsc.org/images/entities/char_2009.gif) 25) blend. This may be due to the enhanced coalescence of the PMMA domains occurring during the phase separation process which lowers the interfacial area by forming larger domains.28 It is also possible that the higher amount of PMMA leads to aggregation of PMMA before it disperses within the PAN matrix during polymer mixing. This can account for the irregular shape of the dispersed phase. In either case, a change of blend composition leads to changes in the size and the shape of the dispersed phase and eventually allows the control of the pore size of the resulting CNFs.
25) blend. This may be due to the enhanced coalescence of the PMMA domains occurring during the phase separation process which lowers the interfacial area by forming larger domains.28 It is also possible that the higher amount of PMMA leads to aggregation of PMMA before it disperses within the PAN matrix during polymer mixing. This can account for the irregular shape of the dispersed phase. In either case, a change of blend composition leads to changes in the size and the shape of the dispersed phase and eventually allows the control of the pore size of the resulting CNFs.
![[thin space (1/6-em)]](https://www.rsc.org/images/entities/char_2009.gif) :
:![[thin space (1/6-em)]](https://www.rsc.org/images/entities/char_2009.gif) PMMA (95
PMMA (95![[thin space (1/6-em)]](https://www.rsc.org/images/entities/char_2009.gif) :
:![[thin space (1/6-em)]](https://www.rsc.org/images/entities/char_2009.gif) 5) (b) PAN
5) (b) PAN![[thin space (1/6-em)]](https://www.rsc.org/images/entities/char_2009.gif) :
:![[thin space (1/6-em)]](https://www.rsc.org/images/entities/char_2009.gif) PMMA (90
PMMA (90![[thin space (1/6-em)]](https://www.rsc.org/images/entities/char_2009.gif) :
:![[thin space (1/6-em)]](https://www.rsc.org/images/entities/char_2009.gif) 10) and (c) PAN
10) and (c) PAN![[thin space (1/6-em)]](https://www.rsc.org/images/entities/char_2009.gif) :
:![[thin space (1/6-em)]](https://www.rsc.org/images/entities/char_2009.gif) PMMA (75
PMMA (75![[thin space (1/6-em)]](https://www.rsc.org/images/entities/char_2009.gif) :
:![[thin space (1/6-em)]](https://www.rsc.org/images/entities/char_2009.gif) 25) films.
25) films.![[thin space (1/6-em)]](https://www.rsc.org/images/entities/char_2009.gif) :
:![[thin space (1/6-em)]](https://www.rsc.org/images/entities/char_2009.gif) PMMA (95
PMMA (95![[thin space (1/6-em)]](https://www.rsc.org/images/entities/char_2009.gif) :
:![[thin space (1/6-em)]](https://www.rsc.org/images/entities/char_2009.gif) 5) shows the highest carbon yield of 28.0% among the blends studied and it is similar to that of neat PAN 29.0% at 1000 °C. The carbon yield of PAN/PMMA (90
5) shows the highest carbon yield of 28.0% among the blends studied and it is similar to that of neat PAN 29.0% at 1000 °C. The carbon yield of PAN/PMMA (90![[thin space (1/6-em)]](https://www.rsc.org/images/entities/char_2009.gif) :
:![[thin space (1/6-em)]](https://www.rsc.org/images/entities/char_2009.gif) 10) was 27.1% while PAN/PMMA (75
10) was 27.1% while PAN/PMMA (75![[thin space (1/6-em)]](https://www.rsc.org/images/entities/char_2009.gif) :
:![[thin space (1/6-em)]](https://www.rsc.org/images/entities/char_2009.gif) 25) shows the lowest carbon yield of 17.9%, as expected.
25) shows the lowest carbon yield of 17.9%, as expected.![[triple bond, length as m-dash]](https://www.rsc.org/images/entities/char_e002.gif) N stretching of acrylonitrile unit in the polymer chain.30 After blending, all the blends show the absorptions at 1730 cm−1 and 2243 cm−1 indicating the presence of both PMMA and PAN. Furthermore, the carbonyl stretching absorption at 1730 cm−1 becomes more intense upon increasing the amount of PMMA.
N stretching of acrylonitrile unit in the polymer chain.30 After blending, all the blends show the absorptions at 1730 cm−1 and 2243 cm−1 indicating the presence of both PMMA and PAN. Furthermore, the carbonyl stretching absorption at 1730 cm−1 becomes more intense upon increasing the amount of PMMA.
![[thin space (1/6-em)]](https://www.rsc.org/images/entities/char_2009.gif) :
:![[thin space (1/6-em)]](https://www.rsc.org/images/entities/char_2009.gif) PMMA (95
PMMA (95![[thin space (1/6-em)]](https://www.rsc.org/images/entities/char_2009.gif) :
:![[thin space (1/6-em)]](https://www.rsc.org/images/entities/char_2009.gif) 5) (c) PAN
5) (c) PAN![[thin space (1/6-em)]](https://www.rsc.org/images/entities/char_2009.gif) :
:![[thin space (1/6-em)]](https://www.rsc.org/images/entities/char_2009.gif) PMMA (90
PMMA (90![[thin space (1/6-em)]](https://www.rsc.org/images/entities/char_2009.gif) :
:![[thin space (1/6-em)]](https://www.rsc.org/images/entities/char_2009.gif) 10) and (d) PAN
10) and (d) PAN![[thin space (1/6-em)]](https://www.rsc.org/images/entities/char_2009.gif) :
:![[thin space (1/6-em)]](https://www.rsc.org/images/entities/char_2009.gif) PMMA (75
PMMA (75![[thin space (1/6-em)]](https://www.rsc.org/images/entities/char_2009.gif) :
:![[thin space (1/6-em)]](https://www.rsc.org/images/entities/char_2009.gif) 25).
25).![[thin space (1/6-em)]](https://www.rsc.org/images/entities/char_2009.gif) :
:![[thin space (1/6-em)]](https://www.rsc.org/images/entities/char_2009.gif) PMMA (95
PMMA (95![[thin space (1/6-em)]](https://www.rsc.org/images/entities/char_2009.gif) :
:![[thin space (1/6-em)]](https://www.rsc.org/images/entities/char_2009.gif) 5)
5)![[thin space (1/6-em)]](https://www.rsc.org/images/entities/char_2009.gif) :
:![[thin space (1/6-em)]](https://www.rsc.org/images/entities/char_2009.gif) PMMA (90
PMMA (90![[thin space (1/6-em)]](https://www.rsc.org/images/entities/char_2009.gif) :
:![[thin space (1/6-em)]](https://www.rsc.org/images/entities/char_2009.gif) 10)
10)![[thin space (1/6-em)]](https://www.rsc.org/images/entities/char_2009.gif) :
:![[thin space (1/6-em)]](https://www.rsc.org/images/entities/char_2009.gif) PMMA (75
PMMA (75![[thin space (1/6-em)]](https://www.rsc.org/images/entities/char_2009.gif) :
:![[thin space (1/6-em)]](https://www.rsc.org/images/entities/char_2009.gif) 25)
25)![[thin space (1/6-em)]](https://www.rsc.org/images/entities/char_2009.gif) :
:![[thin space (1/6-em)]](https://www.rsc.org/images/entities/char_2009.gif) PMMA (95
PMMA (95![[thin space (1/6-em)]](https://www.rsc.org/images/entities/char_2009.gif) :
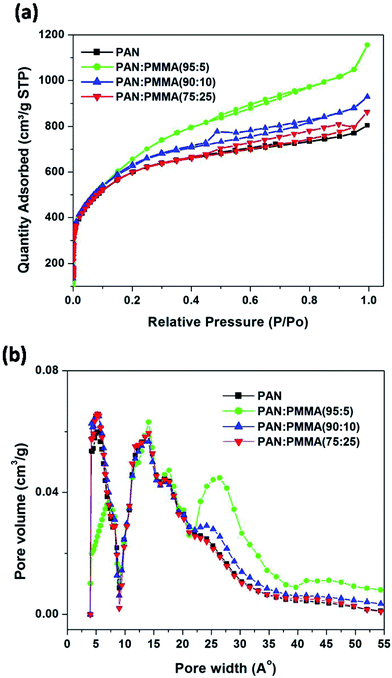
:![[thin space (1/6-em)]](https://www.rsc.org/images/entities/char_2009.gif) 5) has the highest surface area. Also, it is demonstrated that the pore sizes can be tuned by varying the amount of PMMA in the blend. Incorporation of PMMA has increased the percentage of mesopores within the CNFs compared to pure PAN. Previous reports have shown that maximum double-layer capacitance can be obtained when the pore size is close to the ion size of the electrolyte.19 In this work, EMITFSI was used as the ionic liquid electrolyte. The ion sizes of the anion (TFSI) and cation (EMI) are close to each other (0.79 and 0.76 nm, respectively). In order to obtain enhanced supercapacitor performances, it is beneficial for the carbonized and activated blends with different ratios of PMMA to have their pore sizes match (or exceed) the electrolyte's ion sizes.
5) has the highest surface area. Also, it is demonstrated that the pore sizes can be tuned by varying the amount of PMMA in the blend. Incorporation of PMMA has increased the percentage of mesopores within the CNFs compared to pure PAN. Previous reports have shown that maximum double-layer capacitance can be obtained when the pore size is close to the ion size of the electrolyte.19 In this work, EMITFSI was used as the ionic liquid electrolyte. The ion sizes of the anion (TFSI) and cation (EMI) are close to each other (0.79 and 0.76 nm, respectively). In order to obtain enhanced supercapacitor performances, it is beneficial for the carbonized and activated blends with different ratios of PMMA to have their pore sizes match (or exceed) the electrolyte's ion sizes.
![[thin space (1/6-em)]](https://www.rsc.org/images/entities/char_2009.gif) :
:![[thin space (1/6-em)]](https://www.rsc.org/images/entities/char_2009.gif) 5), (c) PAN/PMMA (90
5), (c) PAN/PMMA (90![[thin space (1/6-em)]](https://www.rsc.org/images/entities/char_2009.gif) :
:![[thin space (1/6-em)]](https://www.rsc.org/images/entities/char_2009.gif) 10) and (d) PAN/PMMA (75
10) and (d) PAN/PMMA (75![[thin space (1/6-em)]](https://www.rsc.org/images/entities/char_2009.gif) :
:![[thin space (1/6-em)]](https://www.rsc.org/images/entities/char_2009.gif) 25).
25).![[thin space (1/6-em)]](https://www.rsc.org/images/entities/char_2009.gif) :
:![[thin space (1/6-em)]](https://www.rsc.org/images/entities/char_2009.gif) PMMA (95
PMMA (95![[thin space (1/6-em)]](https://www.rsc.org/images/entities/char_2009.gif) :
:![[thin space (1/6-em)]](https://www.rsc.org/images/entities/char_2009.gif) 5)
5)![[thin space (1/6-em)]](https://www.rsc.org/images/entities/char_2009.gif) :
:![[thin space (1/6-em)]](https://www.rsc.org/images/entities/char_2009.gif) PMMA (90
PMMA (90![[thin space (1/6-em)]](https://www.rsc.org/images/entities/char_2009.gif) :
:![[thin space (1/6-em)]](https://www.rsc.org/images/entities/char_2009.gif) 10)
10)![[thin space (1/6-em)]](https://www.rsc.org/images/entities/char_2009.gif) :
:![[thin space (1/6-em)]](https://www.rsc.org/images/entities/char_2009.gif) PMMA (75
PMMA (75![[thin space (1/6-em)]](https://www.rsc.org/images/entities/char_2009.gif) :
:![[thin space (1/6-em)]](https://www.rsc.org/images/entities/char_2009.gif) 25)
25)![[thin space (1/6-em)]](https://www.rsc.org/images/entities/char_2009.gif) :
:![[thin space (1/6-em)]](https://www.rsc.org/images/entities/char_2009.gif) PMMA (95
PMMA (95![[thin space (1/6-em)]](https://www.rsc.org/images/entities/char_2009.gif) :
:![[thin space (1/6-em)]](https://www.rsc.org/images/entities/char_2009.gif) 5), PAN
5), PAN![[thin space (1/6-em)]](https://www.rsc.org/images/entities/char_2009.gif) :
:![[thin space (1/6-em)]](https://www.rsc.org/images/entities/char_2009.gif) PMMA (90
PMMA (90![[thin space (1/6-em)]](https://www.rsc.org/images/entities/char_2009.gif) :
:![[thin space (1/6-em)]](https://www.rsc.org/images/entities/char_2009.gif) 10) and PAN
10) and PAN![[thin space (1/6-em)]](https://www.rsc.org/images/entities/char_2009.gif) :
:![[thin space (1/6-em)]](https://www.rsc.org/images/entities/char_2009.gif) PMMA (75
PMMA (75![[thin space (1/6-em)]](https://www.rsc.org/images/entities/char_2009.gif) :
:![[thin space (1/6-em)]](https://www.rsc.org/images/entities/char_2009.gif) 25) at the scan rate of 10 mV s−1 were determined to be 140, 135, and 128 F g−1, respectively. PAN
25) at the scan rate of 10 mV s−1 were determined to be 140, 135, and 128 F g−1, respectively. PAN![[thin space (1/6-em)]](https://www.rsc.org/images/entities/char_2009.gif) :
:![[thin space (1/6-em)]](https://www.rsc.org/images/entities/char_2009.gif) PMMA (95
PMMA (95![[thin space (1/6-em)]](https://www.rsc.org/images/entities/char_2009.gif) :
:![[thin space (1/6-em)]](https://www.rsc.org/images/entities/char_2009.gif) 5), which has the highest percentage of mesopores and surface area, showed the best electrochemical performance (Table 3).
5), which has the highest percentage of mesopores and surface area, showed the best electrochemical performance (Table 3).

![[thin space (1/6-em)]](https://www.rsc.org/images/entities/char_2009.gif) :
:![[thin space (1/6-em)]](https://www.rsc.org/images/entities/char_2009.gif) 5), (c) PAN/PMMA (90
5), (c) PAN/PMMA (90![[thin space (1/6-em)]](https://www.rsc.org/images/entities/char_2009.gif) :
:![[thin space (1/6-em)]](https://www.rsc.org/images/entities/char_2009.gif) 10) and (d) PAN/PMMA (75
10) and (d) PAN/PMMA (75![[thin space (1/6-em)]](https://www.rsc.org/images/entities/char_2009.gif) :
:![[thin space (1/6-em)]](https://www.rsc.org/images/entities/char_2009.gif) 25).
25).![[thin space (1/6-em)]](https://www.rsc.org/images/entities/char_2009.gif) :
:![[thin space (1/6-em)]](https://www.rsc.org/images/entities/char_2009.gif) PMMA (95
PMMA (95![[thin space (1/6-em)]](https://www.rsc.org/images/entities/char_2009.gif) :
:![[thin space (1/6-em)]](https://www.rsc.org/images/entities/char_2009.gif) 5)
5)![[thin space (1/6-em)]](https://www.rsc.org/images/entities/char_2009.gif) :
:![[thin space (1/6-em)]](https://www.rsc.org/images/entities/char_2009.gif) PMMA (90
PMMA (90![[thin space (1/6-em)]](https://www.rsc.org/images/entities/char_2009.gif) :
:![[thin space (1/6-em)]](https://www.rsc.org/images/entities/char_2009.gif) 10)
10)![[thin space (1/6-em)]](https://www.rsc.org/images/entities/char_2009.gif) :
:![[thin space (1/6-em)]](https://www.rsc.org/images/entities/char_2009.gif) PMMA (75
PMMA (75![[thin space (1/6-em)]](https://www.rsc.org/images/entities/char_2009.gif) :
:![[thin space (1/6-em)]](https://www.rsc.org/images/entities/char_2009.gif) 25)
25)![[thin space (1/6-em)]](https://www.rsc.org/images/entities/char_2009.gif) :
:![[thin space (1/6-em)]](https://www.rsc.org/images/entities/char_2009.gif) 10) and PAN
10) and PAN![[thin space (1/6-em)]](https://www.rsc.org/images/entities/char_2009.gif) :
:![[thin space (1/6-em)]](https://www.rsc.org/images/entities/char_2009.gif) PMMA (75
PMMA (75![[thin space (1/6-em)]](https://www.rsc.org/images/entities/char_2009.gif) :
:![[thin space (1/6-em)]](https://www.rsc.org/images/entities/char_2009.gif) 25) exhibit energy densities of 63.2 W h kg−1 and 61.4 W h kg−1 respectively. PAN
25) exhibit energy densities of 63.2 W h kg−1 and 61.4 W h kg−1 respectively. PAN![[thin space (1/6-em)]](https://www.rsc.org/images/entities/char_2009.gif) :
:![[thin space (1/6-em)]](https://www.rsc.org/images/entities/char_2009.gif) PMMA (95
PMMA (95![[thin space (1/6-em)]](https://www.rsc.org/images/entities/char_2009.gif) :
:![[thin space (1/6-em)]](https://www.rsc.org/images/entities/char_2009.gif) 5) gave an energy density of 101 W h kg−1 when discharged from 4 V. Fig. 10(b) shows the discharge curves for PAN/PMMA blends. Discharge curves for PAN/PMMA blends are linear with no significant IR drop in contrast to PAN. The PAN
5) gave an energy density of 101 W h kg−1 when discharged from 4 V. Fig. 10(b) shows the discharge curves for PAN/PMMA blends. Discharge curves for PAN/PMMA blends are linear with no significant IR drop in contrast to PAN. The PAN![[thin space (1/6-em)]](https://www.rsc.org/images/entities/char_2009.gif) :
:![[thin space (1/6-em)]](https://www.rsc.org/images/entities/char_2009.gif) PMMA (95
PMMA (95![[thin space (1/6-em)]](https://www.rsc.org/images/entities/char_2009.gif) :
:![[thin space (1/6-em)]](https://www.rsc.org/images/entities/char_2009.gif) 5) showed the longest discharge time followed by PAN
5) showed the longest discharge time followed by PAN![[thin space (1/6-em)]](https://www.rsc.org/images/entities/char_2009.gif) :
:![[thin space (1/6-em)]](https://www.rsc.org/images/entities/char_2009.gif) PMMA (90
PMMA (90![[thin space (1/6-em)]](https://www.rsc.org/images/entities/char_2009.gif) :
:![[thin space (1/6-em)]](https://www.rsc.org/images/entities/char_2009.gif) 10), PAN
10), PAN![[thin space (1/6-em)]](https://www.rsc.org/images/entities/char_2009.gif) :
:![[thin space (1/6-em)]](https://www.rsc.org/images/entities/char_2009.gif) PMMA (75
PMMA (75![[thin space (1/6-em)]](https://www.rsc.org/images/entities/char_2009.gif) :
:![[thin space (1/6-em)]](https://www.rsc.org/images/entities/char_2009.gif) 25) and PAN.
25) and PAN.![[thin space (1/6-em)]](https://www.rsc.org/images/entities/char_2009.gif) :
:![[thin space (1/6-em)]](https://www.rsc.org/images/entities/char_2009.gif) PMMA (95
PMMA (95![[thin space (1/6-em)]](https://www.rsc.org/images/entities/char_2009.gif) :
:![[thin space (1/6-em)]](https://www.rsc.org/images/entities/char_2009.gif) 5)
5)![[thin space (1/6-em)]](https://www.rsc.org/images/entities/char_2009.gif) :
:![[thin space (1/6-em)]](https://www.rsc.org/images/entities/char_2009.gif) PMMA (90
PMMA (90![[thin space (1/6-em)]](https://www.rsc.org/images/entities/char_2009.gif) :
:![[thin space (1/6-em)]](https://www.rsc.org/images/entities/char_2009.gif) 10)
10)![[thin space (1/6-em)]](https://www.rsc.org/images/entities/char_2009.gif) :
:![[thin space (1/6-em)]](https://www.rsc.org/images/entities/char_2009.gif) PMMA (75
PMMA (75![[thin space (1/6-em)]](https://www.rsc.org/images/entities/char_2009.gif) :
:![[thin space (1/6-em)]](https://www.rsc.org/images/entities/char_2009.gif) 25)
25)![[thin space (1/6-em)]](https://www.rsc.org/images/entities/char_2009.gif) 664
664![[thin space (1/6-em)]](https://www.rsc.org/images/entities/char_2009.gif) 376
376![[thin space (1/6-em)]](https://www.rsc.org/images/entities/char_2009.gif) 830
830![[thin space (1/6-em)]](https://www.rsc.org/images/entities/char_2009.gif) 707
707
![[thin space (1/6-em)]](https://www.rsc.org/images/entities/char_2009.gif) :
:![[thin space (1/6-em)]](https://www.rsc.org/images/entities/char_2009.gif) PMMA (95
PMMA (95![[thin space (1/6-em)]](https://www.rsc.org/images/entities/char_2009.gif) :
:![[thin space (1/6-em)]](https://www.rsc.org/images/entities/char_2009.gif) 5) blend was the smallest, indicating the lowest ion transfer resistance in the electrode/electrolyte interface. According to the pore size analysis, PAN
5) blend was the smallest, indicating the lowest ion transfer resistance in the electrode/electrolyte interface. According to the pore size analysis, PAN![[thin space (1/6-em)]](https://www.rsc.org/images/entities/char_2009.gif) :
:![[thin space (1/6-em)]](https://www.rsc.org/images/entities/char_2009.gif) PMMA (95
PMMA (95![[thin space (1/6-em)]](https://www.rsc.org/images/entities/char_2009.gif) :
:![[thin space (1/6-em)]](https://www.rsc.org/images/entities/char_2009.gif) 5) shows the formation of a larger number of mesopores, which favors greater ion accessibility into the pores of electrodes which are in contact with the electrolyte.
5) shows the formation of a larger number of mesopores, which favors greater ion accessibility into the pores of electrodes which are in contact with the electrolyte.
![[thin space (1/6-em)]](https://www.rsc.org/images/entities/char_2009.gif) :
:![[thin space (1/6-em)]](https://www.rsc.org/images/entities/char_2009.gif) PMMA (95
PMMA (95![[thin space (1/6-em)]](https://www.rsc.org/images/entities/char_2009.gif) :
:![[thin space (1/6-em)]](https://www.rsc.org/images/entities/char_2009.gif) 5) was selected for the cycling test in ionic liquid electrolyte (EMITFSI) and result is shown in Fig. 12. After 100th cycle 93.8% of the specific capacitance was retained while after 1000th cycle 85% of the capacitance was retained. These results demonstrate that the activated carbons derived from PAN
5) was selected for the cycling test in ionic liquid electrolyte (EMITFSI) and result is shown in Fig. 12. After 100th cycle 93.8% of the specific capacitance was retained while after 1000th cycle 85% of the capacitance was retained. These results demonstrate that the activated carbons derived from PAN![[thin space (1/6-em)]](https://www.rsc.org/images/entities/char_2009.gif) :
:![[thin space (1/6-em)]](https://www.rsc.org/images/entities/char_2009.gif) PMMA (95
PMMA (95![[thin space (1/6-em)]](https://www.rsc.org/images/entities/char_2009.gif) :
:![[thin space (1/6-em)]](https://www.rsc.org/images/entities/char_2009.gif) 5) exhibit a high degree of reversibility leading to good cycle stability, making them potentially suitable electrode materials for high performing supercapacitors.
5) exhibit a high degree of reversibility leading to good cycle stability, making them potentially suitable electrode materials for high performing supercapacitors.
![[thin space (1/6-em)]](https://www.rsc.org/images/entities/char_2009.gif) :
:![[thin space (1/6-em)]](https://www.rsc.org/images/entities/char_2009.gif) PMMA (95
PMMA (95![[thin space (1/6-em)]](https://www.rsc.org/images/entities/char_2009.gif) :
:![[thin space (1/6-em)]](https://www.rsc.org/images/entities/char_2009.gif) 5) over 1000 charge/discharge cycles at a current density of 1 A g−1.
5) over 1000 charge/discharge cycles at a current density of 1 A g−1.![[thin space (1/6-em)]](https://www.rsc.org/images/entities/char_2009.gif) :
:![[thin space (1/6-em)]](https://www.rsc.org/images/entities/char_2009.gif) 5), PAN/PMMA (90
5), PAN/PMMA (90![[thin space (1/6-em)]](https://www.rsc.org/images/entities/char_2009.gif) :
:![[thin space (1/6-em)]](https://www.rsc.org/images/entities/char_2009.gif) 10) and PAN/PMMA (75
10) and PAN/PMMA (75![[thin space (1/6-em)]](https://www.rsc.org/images/entities/char_2009.gif) :
:![[thin space (1/6-em)]](https://www.rsc.org/images/entities/char_2009.gif) 25) were prepared, and electrospun to form free standing nanofiber mats. Porous CNFs were obtained from PAN and PAN/PMMA blends after thermal treatments. The introduction of PMMA into the PAN increases the surface area of PAN nanofibers leading to enhanced electrochemical performances of the carbon CNFs. This improvement is attributed to the formation of pores with both microporosity and mesoporosity that afforded ready electrolyte access. PAN/PMMA (95
25) were prepared, and electrospun to form free standing nanofiber mats. Porous CNFs were obtained from PAN and PAN/PMMA blends after thermal treatments. The introduction of PMMA into the PAN increases the surface area of PAN nanofibers leading to enhanced electrochemical performances of the carbon CNFs. This improvement is attributed to the formation of pores with both microporosity and mesoporosity that afforded ready electrolyte access. PAN/PMMA (95![[thin space (1/6-em)]](https://www.rsc.org/images/entities/char_2009.gif) :
:![[thin space (1/6-em)]](https://www.rsc.org/images/entities/char_2009.gif) 5) CNFs show the highest degree of graphitization, highest carbon yield, lowest charge transfer resistance, good cycle stability, highest capacitance of 140 F g−1 as well as energy densities of 67 W h kg−1 at 3.5 V and 101 W h kg−1 at 4 V in EMITFSI electrolyte. The preparation of PAN/PMMA immiscible polymer blends by incorporating PMMA has been found to be an effective method to increase the energy density of supercapacitors with PAN
5) CNFs show the highest degree of graphitization, highest carbon yield, lowest charge transfer resistance, good cycle stability, highest capacitance of 140 F g−1 as well as energy densities of 67 W h kg−1 at 3.5 V and 101 W h kg−1 at 4 V in EMITFSI electrolyte. The preparation of PAN/PMMA immiscible polymer blends by incorporating PMMA has been found to be an effective method to increase the energy density of supercapacitors with PAN![[thin space (1/6-em)]](https://www.rsc.org/images/entities/char_2009.gif) :
:![[thin space (1/6-em)]](https://www.rsc.org/images/entities/char_2009.gif) PMMA (95
PMMA (95![[thin space (1/6-em)]](https://www.rsc.org/images/entities/char_2009.gif) :
:![[thin space (1/6-em)]](https://www.rsc.org/images/entities/char_2009.gif) 5) being especially promising.
5) being especially promising.
.
.
.
.
.
.
.
.
.
.
.
.
.
.
.
.
.
.
.
.
.
.
.
.
.
.
.
.
.
.
.
.
.
.

