Helium atom scattering from potassium tantalate/niobate(001) surfaces
David H.
Van Winkle
 *a,
J. G.
Skofronick
a,
T. W.
Trelenberg
a,
S. A.
Safron
b and
F. A.
Flaherty
c
aDepartment of Physics, Florida State University, Tallahassee, Florida 32306-4360, USA. E-mail: dvanwinkle@fsu.edu
bDepartment of Chemistry and Biochemistry, Florida State University, Tallahassee, Florida 32306-4390, USA
cDepartment of Physics, Valdosta State University, Valdosta, Georgia 31698-0055, USA
First published on 4th February 2021
Abstract
The results of He atom scattering experiments on KTa0.48Nb0.52O3(001) surfaces are presented and compared with similar experiments on mixed potassium tantalate/niobate perovskites with lower concentrations of Nb. The results are puzzling, unique and intriguing. Angular distributions of the He scattering intensities (the He surface diffraction pattern) are found to be very similar to those obtained from targets with lower Nb fractions. However, drift spectra (the intensity of the He specular reflection as a function of the He wave vector) are not. Whereas the drift spectra in the 〈10〉 azimuth do resemble those of the 0, 6 and 10% Nb fraction targets, in the 〈11〉 azimuth they are more similar to the strange drift spectra found from the 30% Nb-doped targets. Most intriguing are the surface temperature scans (the He specular intensity as a function of the target surface temperature); for they are quite distinct from those with lower Nb fractions. Finally, the inelastic He scattering experiments provide phonon dispersion results that are similar in most respects to those found for the lower Nb level samples. In particular, the most prominent feature is an Einstein-like mode at about 13.5 meV which spans the entire surface Brillouin zone in both 〈10〉 and 〈11〉 azimuths.
Introduction
Perovskite materials are currently the focus of intense research because of their ferroelectric, superconducting, and electro-optical properties. Potassium tantalate/niobate in particular shows great promise in many diverse applications such as solar cells, lasers, and laser beam switching, modulation, and deflection. It is even being considered for more unusual applications such as efficient water electrolysis, and variable focal length lenses. Since the characterization of the surface layer of this material is important in understanding its behavior, helium atom diffraction and inelastic scattering experiments from perovskite KTa1−xNbxO3(001) surfaces (where x = 0, 6, 10, 15, 20, and 30%) were carried out in this laboratory.1–8 We refer to the samples with x > 0 generally as KTNs. Several interesting surface behaviors for these materials have been observed and reported. In this report for the PCCP issue honoring the work of Prof. Peter Toennies, we present the results of incomplete HAS experiments on KTN with x = 52% that are very different from those reported previously. They suggest a revised, more complex perspective on the surface structure and behaviours of these materials. We expect these results to stimulate new experimental and theoretical work on the surface properties of these materials.As in the previously reported work on KTNs,4 the KTa0.48Nb0.52O3(001) surface was prepared from the single crystal samples by cleaving in situ under UHV conditions. Several types of measurements were carried out:1–8 angular distributions of the scattered He atoms, by rotating the manipulator holding the target; drift spectra by measuring the He specular reflection as the He wave vector is varied; surface temperature scans by measuring the He specular reflection as the surface temperature is decreased and increased; and inelastic He atom scattering at various scattering angles (various surface momentum transfers) by time-of-flight methods.
To emphasize the perspective-changing results of these experiments, we first review some of the features observed in the earlier work on the surfaces of these materials. For the pure KTaO3(001) surface, metastable behaviour was identified very soon after cleaving the target by the changing diffraction pattern around the He specular reflection diffraction peak.1,8 The He surface diffraction pattern required more than an hour from the time of cleaving the crystal at ∼300 K to stabilize. For the KTN targets, the evolution of the initial diffraction pattern to the stable one was generally too rapid to be followed in detail by a series of angular distribution (AD) measurements, as could be done with the KTaO3 targets. However, narrowing and disappearance of the shoulders around the specular reflection peak were observed.2 We believe the explanation for this metastable behavior lies in the modification of the cleaved surface by migration of K+ ions and oxygen anions from the bulk to the surface.8–10 Theoretical calculations by Fritsch and Schröder have provided a picture of the resulting surface.4,11
After stabilization of the surface in all samples, the ADs showed sharp diffraction peaks corresponding to a (1 × 1) surface with lattice spacing of ∼4.0 Å, the bulk lattice constant. Note that for pure KTaO3, the bulk lattice is cubic at all temperatures. For KTNs, the bulk undergoes phase changes from cubic to tetragonal to orthorhombic to rhombohedral as the temperature is lowered.12 However the changes in lattice dimensions with these transitions are very slight and to within the resolution of our ADs, the lattice parameters for all samples are essentially 4.0 Å. In addition, it was found that thermally cycling the target from room temperature to low temperatures (∼80 K) and back modified the diffraction pattern to include small, broad half-order peaks, corresponding to a surface with domains of ∼50 Å in dimension with (2 × 1) and (1 × 2) structures which must be antiferroelectric. It was then found that these half-order peaks would grow in without the thermal cycling over a period of a few days for targets left at ∼250 K or in a few hours for targets left at ∼275 K after cleaving. It was also observed that target surfaces displaying the half-order diffraction peaks would lose them over a period of several hours at ∼330 K or more quickly at ∼350 K. All the KTN targets showed similar surface phase transitions to these small antiferroelectric domain structures. Such transitions represent an important property of these materials and probably also of similar materials. The kindred behaviour of all the materials in this regard is consistent with the notion that the surface in all cases after cleaving essentially becomes a K–O surface due to the ions that have migrated from the bulk.
In addition to AD experiments, drift spectra (DS) measurements were carried out on these targets. DS experiments consist of measurements of the specular He diffraction peak as the He wave vector (He velocity and kinetic energy) is varied. Fourier transforms of DSs yield the step-height distributions for terraces on the surface.2,13 These transforms for DSs on targets with x < 30% revealed that, principally, the step-heights are just multiples of the bulk unit cell dimension, 4.0 Å.2,5 This result ties in with the observation of the metastable behaviour above, namely that potassium and oxygen ions diffuse to the surface after the cleave. One would have expected in cleaving these perovskite crystals that terraces of KO and TaO2 (or NbO2) would be formed, with step-heights of multiples of half unit cell, or ∼2.0 Å.14 However, the experiments indicate that the stable surface comprises one with essentially only K–O terraces separated by steps of multiples of the crystal's unit cell dimension.2,5
For the 30% KTN, the DSs were found to be very different and totally unexpected. They consisted of a single, sharp peak, which indicated that only within in a very narrow range of He wave vectors would the specular diffraction peak have any appreciable intensity. The Fourier transform of such a DS shows a very broad distribution of step-heights.6 This suggests that the cleaved surfaces of these crystals are in some ways very different from those of pure KTaO3 and the lower-doped KTNs.2–5
Surface temperature scans (STS) of the specular reflection peak intensity as a function of surface temperature were carried out by cooling the targets from, typically, ∼350 K to ∼80 K and then warming the targets back to the initial temperature. The reverse order of the measurements, warming then cooling, was also performed. For the targets with Nb fraction of ≤30%, the STSs all behaved similarly. Namely, the specular peak intensity rose as the surface temperature decreased, then fell sharply at low temperature as the temperature was increased with a minimum near 150 K, and then rose quickly at around 200 K to that of the cooling curve. For all these mixed crystal samples, there appeared to be hysteresis in He scattering intensity in the cooling and warming portions of the cycle.5,6 This behaviour is quite clear-cut even when taking into account the lag in target temperature with cooling and warming rates of 4 K min−1.
Inelastic He atom scattering experiments were also carried out to determine the surface phonon dispersion curves for these materials.1–7 The most general result for all the samples studied, is that every surface examined showed a nearly dispersionless, Einstein-like phonon branch across the whole Surface Brillouin Zone (SBZ) at ∼13.5 meV. This mode is essentially the same for all (001) surfaces studied in both the 〈10〉 and 〈11〉 azimuths.7 For the pure KTaO3 surface, a second lower energy dispersionless branch was measured in the 〈10〉 azimuth at 80 K and in the 〈11〉 azimuth at 140 K. However, at higher temperatures in both 〈10〉 and 〈11〉, these lower energy phonon modes are found to be dispersive, but the curves extend over less than half the SBZ.4 For the KTN targets, the data for the phonons below the Einstein mode appear to be dispersive, but the data are quite noisy, and surface phonon modes could be identified only over less than a half of the SBZ.5–7 We believe that the existence of the Einstein mode for all these materials is consistent with the picture of the surface noted above, composed of potassium and oxygen ions.7 However, the DS data for the 30% Nb targets suggest a more complex picture.
Experimental
We present here experimental results on targets prepared by cleaving, in situ under UHV conditions, single-crystals of KTN with Nb fraction of 52%. The helium atom scattering instrument, experimental arrangement and procedures for this work, namely the AD, DS, STS and time-of-flight inelastic scattering measurements, are described extensively in previous publications.4–7 We note, however, that for this material the bulk phase transition temperatures (cubic to tetragonal, 390 K; tetragonal to orthorhombic, 300 K; and orthorhombic to rhombohedral, 210 K) imply that the targets are not cubic when cleaved at about 300 K.12Results and discussion
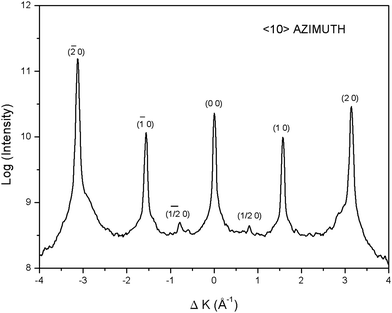
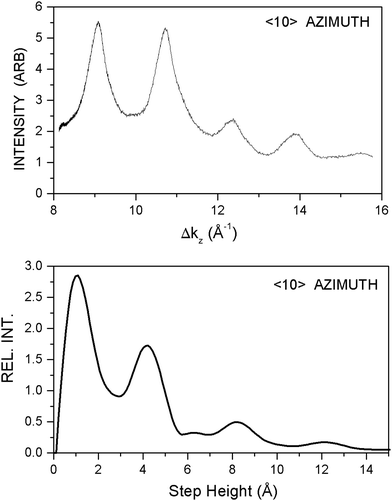
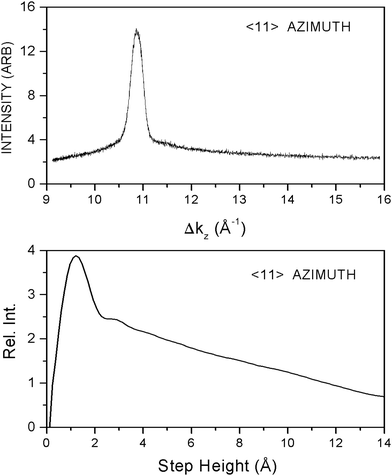
The AD experiments carried out on these targets, as shown by the example in Fig. 1, yield essentially the same results as for the materials at lower Nb doping levels. The sharp integer-order He diffraction peaks lie at positions corresponding to the target having 4.0 Å lattice spacings. The similarity also includes the formation of terraces with (2 × 1) and (1 × 2) structure as implied by the small half-order peaks. We note that the latter diffraction peaks appear somewhat less intense in comparison with the integer-order peaks than those for pure KTaO3. This seems to follow the pattern noticed with the other Nb-doped targets already reported. That is, as the Nb fraction is increased, the relative intensities of the half-order peaks to the integer-order peaks decreases.2The DSs for the 52% targets, however, present something of a conundrum. In Fig. 2, the DS for the target in the 〈10〉 azimuth is shown along with its Fourier transform. The latter shows the expected step height distribution similar to that found and reported for the targets with smaller Nb fractions; namely, it shows terrace steps that are multiples of the unit cell dimension, 4.0 Å.13 However, Fig. 3 shows the DS for a target oriented in the 〈11〉 azimuth; that is, with the target rotated by 45° from the 〈10〉 azimuth. It resembles the DSs found for the 30% Nb-doped samples in both 〈10〉 and 〈11〉 azimuths. The accompanying Fourier transform, in sharp contrast with that of the 〈10〉 azimuth, implies the surface has a broad distribution of steps heights.2,6,13 Further, this DS implies that there should be significant diffraction intensity in ADs in this azimuth only for incident He wave vectors, ki ≈ 7.72 Å−1. And this is very definitely borne out by AD measurements using He wave vectors away from this value.2 We note that the target surface employed in the 〈11〉 measurements was much more difficult to align properly than the ones used in the 〈10〉 azimuth measurements. It is possible that the crystal's deviation from cubic structure at room temperature contributed to this difficulty by affecting how the crystal cleaved. However, after alignment, the ADs with He wave vector ki = 7.72 Å−1 appeared normal.2 Additional experiments are clearly required to understand these confusing DS results.
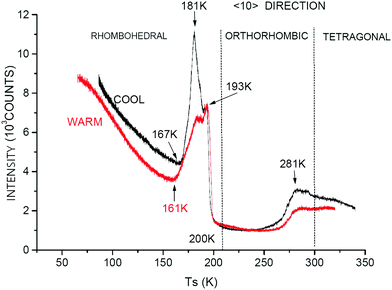
The measurements of the STSs provide results which are completely different from those we reported for samples with lower niobium doping. The experiments were carried out by monitoring the specular intensity as the target holder temperature was decreased from about 350–400 K to about 60 K and then back to about the starting temperature. This does take the target through a series of bulk phase transitions. Most of the scans were carried out at a rate of 4 K min−1 with a few scans carried out at a rate of 1 K min−1. It was noticed in these runs that there was a temperature lag of a few Kelvins between the temperature controller sensor reading and the temperature of the target. In the figures showing these results, the cooling and warming curves have been adjusted for this lag. Fig. 4 shows the scan in the 〈10〉 azimuth and Fig. 5 the scan in the 〈11〉 azimuth. The bulk phase transition temperatures are indicated in the figures. In addition, the temperatures at sharp features in the curves are indicated with arrows and labels. These scans imply that the surface structure varies substantially with temperature, sometimes greatly disordered and sometimes highly ordered with respect to coherent He scattering. This is very different behaviour from the KTN surfaces with Nb fraction ≤30%. Since the STSs for the 30% Nb targets span a similar range of temperatures and also take the sample through bulk phase transitions from cubic to tetragonal to orthorhombic to rhombohedral and back, it does not seem that the dramatic changes in intensity seen for these data are associated with the bulk phase transitions.
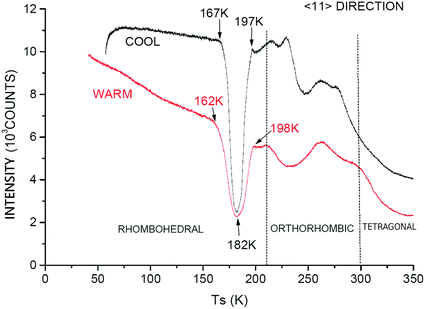 | ||
| Fig. 5 Surface temperature scan of the 52% Nb KTN target in the 〈11〉 azimuth. The scans were carried out as in Fig. 4 with upper cooling curve from ∼350 K to ∼60 K and lower warming curve from ∼50 K to ∼350 K. The initial He atom wave vector ki = 7.48 Å−1. The dotted vertical lines indicate the bulk phase transitions. | ||
Previous work, both theoretical and experimental, reported by others indicate that small regions in the bulk of mixed crystals can form with superstructures, striations, and other inhomogeneities in nominally homogeneous mixtures.15 These are found to arise from small variations in temperatures as the crystal is forming from the melt. The dramatic variations in specular reflectivity that we observe in the STS results do not seem to be correlated with such bulk structures nor with any bulk phase transitions. They appear to be a purely surface effect. No sign of surface inhomogeneity is seen in the AD experiments, nor does any trace of it appear in the STS experiments with the 30% Nb KTN targets.
In other investigations of specular reflectivity of He atoms from surfaces, a plot of the log of specular intensity versus temperature has been shown to yield a straight line with negative slope.16 This can be analysed in terms of the Debye–Waller model17 which describes the attenuation of coherent scattering with increasing temperature due to thermal motion. Since our STS data do not show a continuous decrease with increasing temperature for any meaningful range of temperatures such an analysis is impractical here.
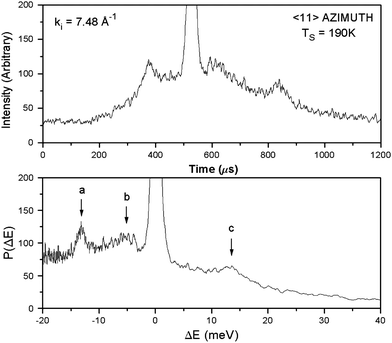
Inelastic scattering experiments were also carried out on the 52% Nb fraction targets. Fig. 6 shows the results of a typical Time of Flight (TOF) experiment in the upper panel; in the lower panel, these data have been transformed into an energy resolved spectrum. The large peak at zero energy transfer, the diffuse elastic peak, has been truncated in height to be able to see the much smaller inelastic, energy transfer peaks associated with phonon creation or annihilation. The tails of the large diffuse elastic peak make it difficult to determine small energy transfers with reasonable accuracy. Rayleigh modes, surface waves which typically approach zero energy at large wavelengths, are therefore hard to detect for this sample, if they are present at all. The very large diffuse elastic signal results from numerous defects at the surface, and probably many steps, despite the sample having been cleaved in situ under UHV conditions. These surface irregularities also reduce the phonon lifetimes and hence broaden the energy peaks. These characteristics have been found in all TOF experiments for pure KTaO3 and for all the KTN targets studied in this laboratory.
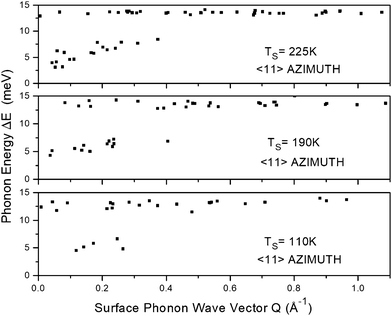
Fig. 7 shows the dispersion results for the 52% Nb fraction target in the 〈11〉 azimuth at 110 K, 190 K and 225 K. A clear result at all temperatures is a nearly dispersionless Einstein branch at ∼13.5 meV, spanning the entire surface Brillouin zone (SBZ). Since this branch appears at all three temperatures at virtually the same energy, it appears to be a purely surface characteristic independent of the bulk phase. Experiments in the 〈10〉 azimuth also show an Einstein branch at about the same energy for all temperatures and for all targets examined.1–4 We believe the Einstein mode, as seen here, reflects the vibrations of a K+ ion bridging two O anions, which arrangement results from the migration of the ions to the surface after cleaving. The theoretical calculations of Fritsch and Schröder suggest this would be a stable ionic arrangement.4,11
One can also see in Fig. 7 that lower energy modes were found approximately only in the first third of the SBZ and that there is no evidence for Rayleigh modes. This behaviour was also seen in the other KTN inelastic scattering experiments. The general similarity of the TOF results at these different temperatures suggests that they reflect strictly surface vibrational behaviour, independent of the bulk phases. (The temperatures of the bulk phase transitions are indicated in Fig. 3 and 4.)
There are some trends, however. Although the lower energy modes measurable in our TOF scans do not span the SBZ, they are somewhat dispersive but do not extrapolate to zero at the zone center. In fact, as the temperature is raised, the dispersion steepens somewhat with phonon wave vector. For example, in 〈11〉 at 190 K the phonon energy near zero wave vector is ∼4 meV, whereas at 225 K and 375 K it is only ∼2.5 meV.2 Also, for pure KTaO3 at 80 K in the 〈10〉 azimuth and at 140 K in the 〈11〉 azimuth nearly flat modes at ∼6 meV were observed that spanned the entire SBZ.1,4 It is not evident why the phonon dispersion curves span the SBZ and are flat at these low surface temperatures for the undoped sample but not at higher surface temperatures. It is also not evident why the low energy modes for the Nb-doped samples don’t span the SBZ. This feature of the 52% Nb crystal surface is shared by all the KTNs. We do not have an explanation for the absence of Rayleigh modes even far from the zone center.
Conclusions
The results of He scattering experiments on the 52% Nb-doped KTN crystal (001) surface leave much room for further experimental and theoretical work. Whereas the AD measurements seem to show that cleaving produces a well-ordered, primarily (1 × 1) surface, the different DSs in the two high symmetry azimuths, the unusual STSs, the Einstein surface phonon branch and the apparent failure of most other surface phonon modes to span the entire SBZ as found in the inelastic scattering, all suggest substantial surface complexity. Further, when one adds into the mix the formation of domains of (2 × 1) and (1 × 2) structure and the variation in behaviour from pure KTaO3 as the fraction of Nb doping increases, the need for many more experiments and much more theory on these mixed perovskites is required to fully understand their behaviour and properties.Since much new technology focuses on ever smaller devices, understanding surface effects on their characteristics becomes ever greater in importance. Further experimental and theoretical studies on surface behaviour of materials, such as the ones reported here, are vital for advances in device development.
Conflicts of interest
There are no conflicts to declare.Acknowledgements
We gratefully acknowledge L. A. Boatner of the Oak Ridge National Laboratory for providing all the potassium tantalate/niobates used in the experiments in this laboratory. His research is sponsored by the U.S. Department of Energy, Basic Energy Sciences, Material Sciences and Engineering Division. We also gratefully acknowledge the support of this research in the past by the Center for Materials Research and Technology (MARTECH) at the Florida State University and by the U.S. Department of Energy Grant No. DE-FG02-97ER45635. Data analysis by one author (FAF) was facilitated by software and computer equipment obtained through a Faculty Research Seed Grant from Valdosta State University.Notes and references
- J. A. Li, PhD dissertation, Florida State University, 1999.
- T. W. Trelenberg, PhD dissertation, Florida State University, 2001.
- R. Fatema, PhD dissertation, Florida State University, 2009.
- Jaime A. Li, E. A. Akhadov, Jeff Baker, L. A. Boatner, D. Bonart, J. Fritsch, S. A. Safron, U. Schröder, J. G. Skofronick and T. W. Trelenberg, Phys. Rev. B: Condens. Matter Mater. Phys., 2003, 68, 045402 CrossRef.
- T. W. Trelenberg, R. Fatema, J. A. Li, E. A. Akhadov, D. H. Van Winkle, J. G. Skofronick, S. A. Safron, F. A. Flaherty and L. A. Boatner, J. Phys.: Condens. Matter, 2010, 22, 304009 CrossRef CAS.
- R. Fatema, T. W. Trelenberg, D. H. Van Winkle, J. G. Skofronick, S. A. Safron, F. A. Flaherty and L. A. Boatner, Phys. Rev. B: Condens. Matter Mater. Phys., 2011, 84, 144114 CrossRef.
- F. A. Flahery, T. W. Trelenberg, J. A. Li, R. Fatema, J. G. Skofronick, D. H. Van Winkle, S. A. Safron and L. A. Boatner, Phys. Rev. B: Condens. Matter Mater. Phys., 2015, 92, 035414 CrossRef.
- J. A. Li, E. A. Akhadov, J. Baker, L. A. Boatner, D. Bonart, F. A. Flaherty, J. Fritsch, S. A. Safron, U. Schröder, J. G. Skofronick, T. W. Trelenberg and D. H. Van Winkle, Phys. Rev. Lett., 2001, 86, 4867–4870 CrossRef CAS.
- K. Szot, M. Pawelczyk, J. Herion, C. Freiburg, J. Albers, R. Waser, J. Hulliger, J. Kwapulinski and J. Dec, Appl. Phys. A: Mater. Sci. Process., 1996, 62, 335 Search PubMed.
- K. Szot, W. Speier, M. Pawelczyk, J. Hulliger, H. Hesse, U. Breuer and W. Quadakkers, J. Phys.: Condens. Matter, 2000, 12, 4687 CrossRef CAS.
- J. Fritsch and U. Schröder, Phys. Status Solidi, 1999, 215, 827 CrossRef CAS.
- D. Rytz and H. J. Scheel, J. Cryst. Growth, 1982, 49, 468 CrossRef.
- D. A. Hamburger, A. T. Yannon, I. Farbman, A. Ben-Shaul and R. B. Gerber, Surf. Sci., 1995, 327, 165 CrossRef CAS.
- He atom scattering experiments on the perovskite KMnF3(001) surface found that the cleaved surface consisted of KF and MnF2 domains. See J. P. Toennies and R. Vollmer, Phys. Rev. B: Condens. Matter Mater. Phys., 1991, 44, 9833 CrossRef CAS.
- H. J. Scheel, J. Cryst. Growth, 2006, 287, 214 CrossRef CAS.
- G. Anemone, A. Al Taleb, G. Benedek, A. Castellanos-Gomez and D. Farías, J. Phys. Chem. C, 2019, 123, 3682–3686 CrossRef CAS.
- D. Farías and K.-H. Rieder, Rep. Prog. Phys., 1998, 61, 1575 CrossRef.
| This journal is © the Owner Societies 2021 |

