
On the HOMA index of some acyclic and conducting systems†
Jan Cz. Dobrowolski*ab and
Sławomir Ostrowskia
aInstitute of Nuclear Chemistry and Technology, 16 Dorodna Street, 03-195 Warsaw, Poland. E-mail: j.dobrowolski@ichtj.waw.pl; Fax: +48 (22)811 1917; Tel: +48 (22)504 1086
bNational Medicines Institute, 30/34 Chełmska Street, 00-725 Warsaw, Poland. E-mail: j.dobrowolski@nil.gov.pl; Fax: +48 (22)841 0652; Tel: +48 (22)841 1888 ext. 355
First published on 5th January 2015
Abstract
The geometrical aromaticity HOMA index can be useful for acyclic linear systems. It approaches a horizontal asymptote as the periodic linear system increases in size. For the unsaturated polymers such as polyenes or polythiophenes, the index seems to be a fair measure of the π-electron delocalization and thus to be a good simple tool for the design of conducting polymers.
The widely used HOMA (Harmonic Oscillator Model of Aromaticity) geometric aromaticity index by Krygowski and Kruszewski (1), defined in the early 70s,1 has the following form:
 | (1) |
The HOMA index initially defined for carbocyclic structures was parameterized for most important heteroatoms.2 It was also demonstrated to be composed of the GEO and EN addends interpreted as geometrical and energetic destabilizing factors.3
The HOMA index based solely on bond distances is revealing only the geometrical aspect of aromaticity while comparison of aromaticity indices grounded on different physical properties leads to the conclusion that aromaticity is a multidimensional phenomenon.4–6 Not infrequently, some aromaticity indices inferred from different physical phenomena provide a concordant pattern of aromaticity. For example, this is sometimes the case of electron density parameters of the ring critical point (RCP), the geometrical HOMA, and the magnetic NICS aromaticity indices.7 Moreover, for series of unsaturated organic compounds, it was shown that it is possible to derive a unified aromaticity index based on a neural networks algorithm applied to a set of geometric, energetic, and magnetic aromaticity indices.8
Recently, we have pointed out that connection of the HOMA index with aromaticity is realized only through the minimization condition of the bond variance and use of the benzene CC bond distance as a reference.9 Also, we have shown that using the HOMA expression (1) one can define a function in which the bond distance R is replaced by a p parameter such as, for example, the bond critical point (BCP) characteristics, showing another aspect of the bond. In such a way a large variety of HOMA(p) indices can be generated.
Presentation of the HOMA(Rho) as a function of HOMA(R) index (where Rho is electron density in BCP, R is bond distance, and αRho is set to 250) for a series of n-membered carbocyclic structures (n = 4–7), both aromatic and not, saturated or singly or doubly unsaturated, demonstrated an excellent quadratic correlation.9
Thus, we came to the conclusion that this correlation reveals that HOMA kind of indices are not only the aromaticity indices but reflect much more general feature combining information on cyclicity, degree of unsaturation, and the way of rings condensation in polycyclic systems. We proposed to call the generalization of the aromaticity the savoricity.9
When presenting the perfect correlation between HOMA(Rho) and HOMA(R) indices for carbocyclic systems it was mentioned that the HOMA indices of benzynes and cyclopropanes deviate from the perfect correlation.9 Moreover, it was illustrated that HOMA indices of acyclic compounds represent bifurcated trends. Nevertheless, our approach was criticised for not introducing a new knowledge about the systems as the Rho as well as many other bond parameters are strongly correlated with the R values. Indeed, a good correlation between R and bond order was already observed by Pauling,10 while excellent (in general non-linear but locally linear) correlations between R and parameters in BCP were reported by many others.11–15 Really, a swap of linearly dependent variables in (1) provides to a quadratic relationship.
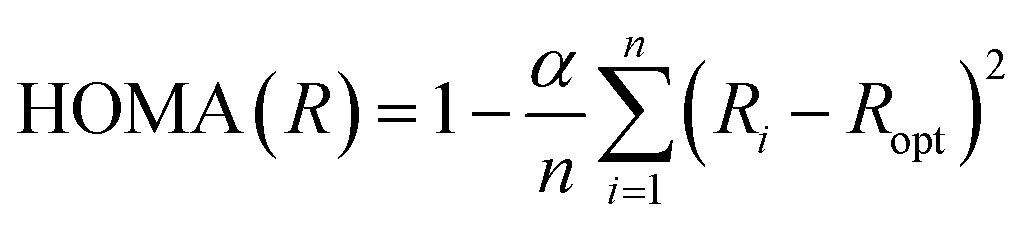
However, as a clear consequence of deviations from the quadratic correlations observed for benzynes, cyclopropanes, and some linear systems, in general, the HOMA(Rho) is not a quadratic function of HOMA(R) but it is splitted into several sub-trends (Fig. 1). In fact, plot of HOMA(Rho) vs. HOMA(R) for several cyclic and acyclic systems introduces a lot of new information useful for both system classification and characterization of, inter alia, electron delocalization in several oligomers of practical interest.
 | ||
| Fig. 1 The correlations between the HOMA(R) and HOMA(Rho) indices: for most of the carbocyclic systems the correlation is presented by the red line, while for the strained cyclic systems as well as linear allenes and polyynes are presented by the parabola wings of different colours. Notice that the linear polyenes are placed at the red line. | ||
The red line in Fig. 1 is the plot of quadratic correlation found in ref. 9 for carbocyclic systems but benzynes and cyclopropanes. Yet, several cyclic systems are placed out of the red line: both below and above it. This is the case for cyclic alkynes, cyclic polyynes, cyclic polyallenes, poly-spiro-cyclopropanes, as well as bicyclic systems cumulated with a cyclic alkyne ring. It would suggest that deviations from the red line are due to substantial ring strains. However, acyclic allenes and polyynes deviate from the main correlation as well. Thus, the reason for deviation is more complex than a shear ring strain.
Complexity of pattern presented in Fig. 1 confirms a more general rule convincing that juxtaposition of two quantities derived from different physical grounds, apparently revealing the same phenomenon, is likely to disclose an important hidden feature. We expect that plots of HOMA(p) against HOMA(R), for p associated, for example, with magnetic or energetic properties of chemical bonds, would uncover yet another picture of the studied series of compounds.
Let us emphasize the differences between new information introduced in Fig. 1 and that stemming from known correlations of R and Rho.11–15 For intermolecular interactions, covering range of distances of a few Å, correlations between R and Rho are well interpolated by non-linear functions,11–15 while in shorter distance intervals of a few tenths of Å, typical for a uniform kind of chemical bonds, they are sufficiently well described by linear functions of parameters strongly depending on kind of atoms forming the chemical (or intermolecular) bond.11,15 The chemical environment of a bond moderate the correlation between R and Rho. For CC bonds in hydrocarbons this is demonstrated in Fig. 2. For majority of typical CC bonds in linear, cyclic, saturated, unsaturated, and aromatic systems, the correlation can be presented as linear (R exceeds 0.99) but if approximated by the quadratic function is correlated even better (R = 0.9995, Fig. 2). However, as in the case of correlation between HOMA(p) and HOMA(R), data corresponding to less typical molecules such as polyynes, allenes, spiro-cyclopropanes, cyclo alkynes, or aromatic systems with a triple bond, deviate from the main tendency (Fig. 2).
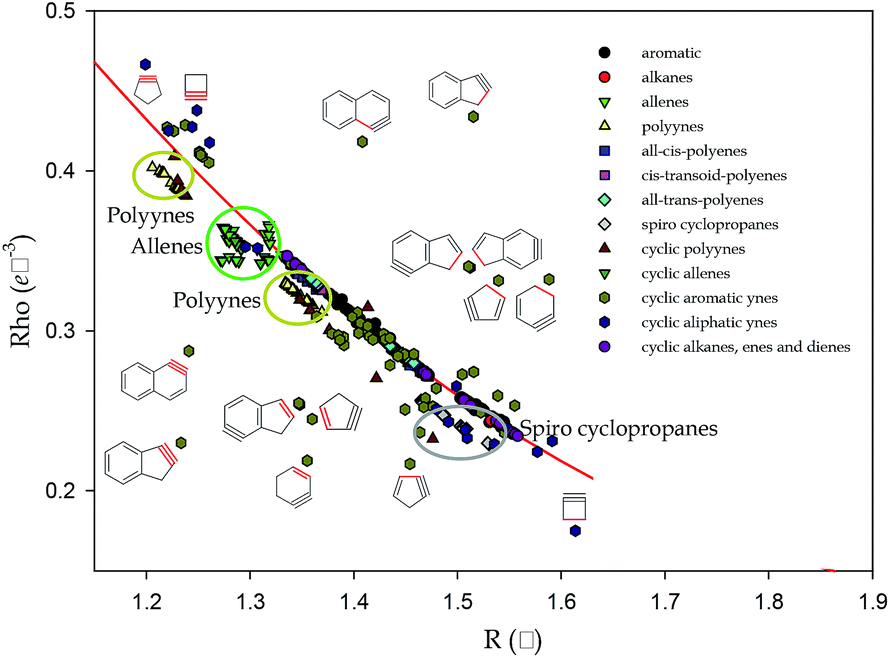 | ||
| Fig. 2 Correlations between bond distance R and Rho electron density in BCP values in miscellaneous hydrocarbons. The red quadratic line (y(x) = 0.4117x2 − 1.6866x + 1.8630; R = 0.9995) is based on 586 points while 1067 points is presented in plot. | ||
However, there is one fundamental difference between information yielded by correlation between R and Rho and HOMA(p) against HOMA(R). The former describes bonds while the latter the whole molecules. Moreover, a six membered cyclic hydrocarbon is described by six R or Rho data whereas only one HOMA(p) or HOMA(R) value. For larger system this difference is even more important. This is why, the HOMA type of indices seem to be very useful for the characterization of extended molecular systems.
Now, let us focus on the HOMA(R) index of acyclic systems. First remark that polyenes are placed exactly on the red curve (Fig. 1). This is the expected behavior of these systems because they are free from strains and have neither triple nor cumulated double bonds. However, a plot of the all-trans polyene HOMA(R) values as a function of n – the number of conjugated double bonds in the structure – shows an increase of the HOMA(R) index to a horizontal asymptote as n is increased (Fig. 2). Such a trend can be immediately identified with an expected increase of electron delocalization in all-trans-polyenes as the conjugated system is developed. Yet, the tool used to reveal this trend is extremely simple. Moreover, trends plotted for the all-trans-, cis–transoid-, and all-cis-polyenes demonstrate that the electron delocalization in the former system is larger than that in the cis–transoid-ones while in the all-cis-polyenes it is practically meaningless (Fig. 2). For 20 conjugated double bonds in the all-trans- and cis–transoid-polyenes the HOMA(R) index exceeds 0.6.‡
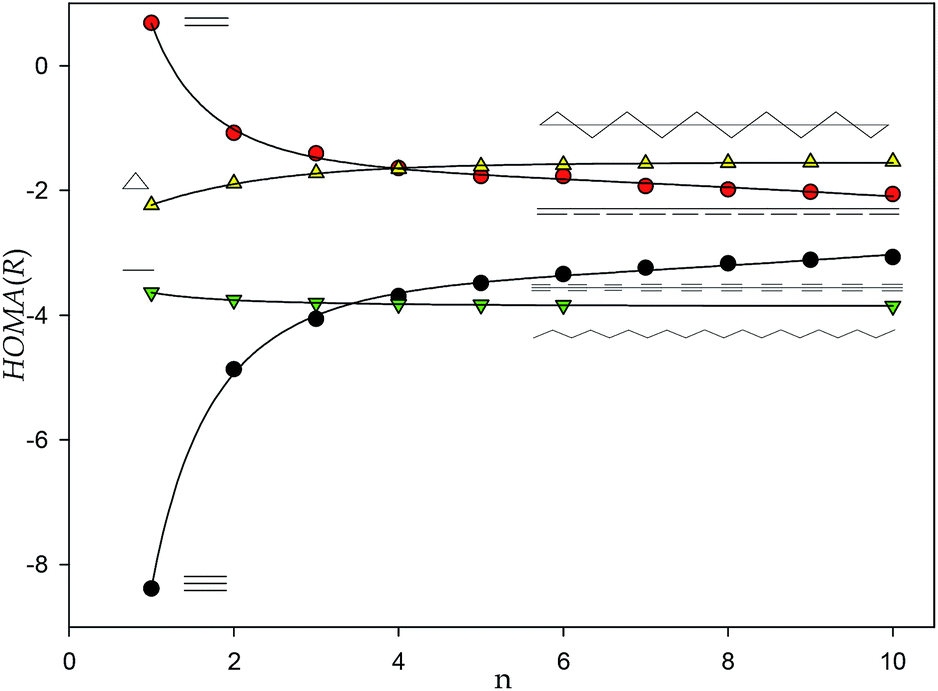
However, the HOMA(R) index calculated for allenes and polyynes reveals a different pattern (Fig. 3). The plots for two systems converge asymptotically to a negative value close to −3. Yet, for allenes the function is monotonically decreasing while for polyynes it is increasing. Significantly, the negative limit of the HOMA(R) index of polyallenes and polyynes indicates very different electric/conductive properties of these model polymers than those of polyenes with HOMA(R) converging to the value of 0.6 exceeding the HOMA(R) index of most 6-membered rings in n-acene molecules (n > 2).16
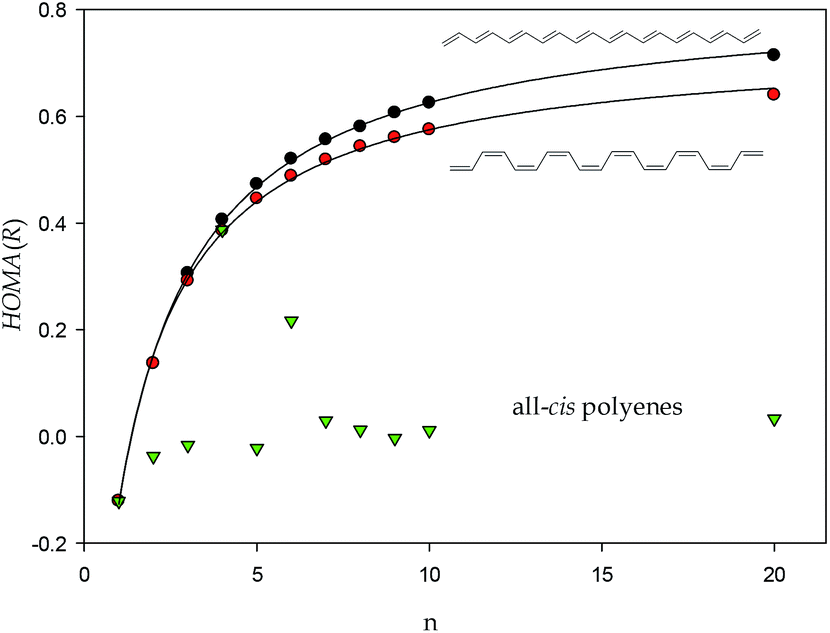 | ||
| Fig. 3 Correlations between HOMA(R) index of conjugated all-trans, cis–transoid, and all-cis polyenes, black, red and green points, respectively and number of conjugated double bonds in the polyene molecule. | ||
Remark, that a similar asymptotic behavior can be also observed for alkanes for which even more negative value of ca. −4 is approached (Fig. 3). It probably can be agreed that the limit value for alkanes characterises insulators. Interestingly, the limit HOMA(R) value of poly-spiro-cyclopropanes, equal to ca. −2, is higher than that of poly unsaturated allenes and polyynes (Fig. 3).
Only slightly negative value of HOMA(R) is determined for much more interesting cyclopentadiene polymers (Fig. 4). However, replacement of the cyclopentadiene's CH2 group by the O, S, and Se heteroatoms or NH heteroatomic moiety to form polyfuran, polythiophene, polyselenophene and polypyrrole molecules, respectively, shifts the limit HOMA(R) value towards more than 0.8 (Fig. 5). This value is typical for six-membered aromatic rings in polyaromatic hydrocarbons such as naphthalene or perylene13 indicating presence of quite significant electron delocalization in the system.
 | ||
| Fig. 4 Correlations between HOMA(R) index of poly spiro cyclopropanes (yellow), allenes (red), polyynes (black), and alkanes (green) and number of monomeric moiety repeated in the model polymeric molecule. | ||
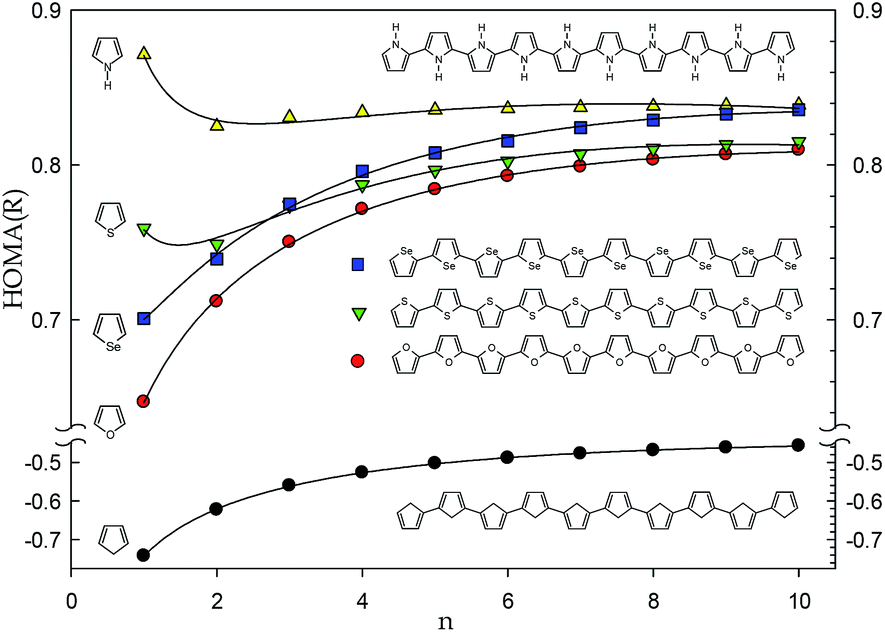 | ||
| Fig. 5 Correlations between HOMA(R) index of model polymers: polycyclopentadiene (black), polyfuran (red), polythiophene (green) and polypyrrole (yellow) and number of cyclic moieties repeated in the structure. | ||
Summing up the above, the HOMA(R) index can be calculated for the acyclic systems and the obtained values seem to have a physical sense and interpretation. Calculation of the HOMA(R) index for acyclic systems is rational because the basic property, the bond distance, is not rigidly attributed to rings and can be estimated for any hydrocarbon system. The reference benzene CC bond distance used in HOMA(R) definition characterizes the perfect aromatic molecule, but simultaneously it can be attributed to the CC bond distance in an abstract perfectly π-conjugated system be it cyclic or linear, branched or not, strained or relaxed. Hence, the HOMA(R) value close to 1 denotes the excellent delocalization while the value close to the limit constituted for alkanes, i.e., −4, seems to represent the insulating property. The intermediate values require more study to be better understand and interpreted. However, it seems likely that the values between 0.5 and 1 can inform about conductivity of the studied compounds and that the higher the HOMA(R) value the better conductor the structure is. Thus, the very simple HOMA(R) index, which can be easily estimated for interesting large systems, if calculated at the adequate level of theory, can be the first-order approximation of conducting properties of the designed new conductive polymers. Notice, that the HOMA(Rho) values can be used for the same analyses but they are somehow more difficult to estimate and their changeability is smaller than that of the HOMA(R) index (Fig. 1). Obviously, the more reliable the computational level the more satisfactory estimation is expected. Last but not least, the practical applications of a polymeric conductive material depends on several parameters such as solubility, miscibility, reactivity, resistance to oxidation and several other bulk phase factors17 which are not related to π-electron delocalization and cannot be guessed based solely on the HOMA(R) values.
Conclusions
Juxtaposition of the HOMA index treated as a function of charge density in bond critical point and bond distance, HOMA(Rho) and HOMA(R), revealed that a lot of strained rings as well as some linear systems deviate from the perfect quadratic correlation demonstrated previously. This shows that considering the HOMA(Rho) as a function of HOMA(R) can be useful for both system classification and characterization of the electron delocalization in linear systems. Closer inspection to the sole HOMA(R) index shows its convergence to a limit value with increase of the number of monomers. For alkanes, spiro cyclopropanes, but also polyynes and allenes, the HOMA(R) values are negative and range from −4 to −2. However, for the system with conjugated π-electron system the values exceed 0.6 and for polypyrrole HOMA(R) reaches ca. 0.8. Thus, the very simple HOMA(R) index, which can be easily estimated for interesting large systems calculated at the adequate level of theory, can be the first-order approximation of the conducting properties for the designed new conducting polymers.Acknowledgements
This work was supported by the National Science Centre in Poland Grant no. DEC-2013/09/B/ST5/03664. The computational Grant G19-4 from the Interdisciplinary Centre of Mathematical and Computer Modelling (ICM) at the University of Warsaw is gratefully acknowledged. Critical comments of anonymous referees to this paper, which allowed us to improve clarity of the text, are gratefully acknowledged.Notes and references
- J. Kruszewski and T. M. Krygowski, Tetrahedron Lett., 1972, 13, 3839 CrossRef.
- T. M. Krygowski and M. Cyrański, Tetrahedron, 1996, 52, 10255 CrossRef CAS.
- T. M. Krygowski and M. Cyrański, Tetrahedron, 1996, 52, 1713 CrossRef CAS.
- A. R. Katritzky, P. Barczynski, G. Musumarra, D. Pisano and M. Szafran, J. Am. Chem. Soc., 1989, 111, 7 CrossRef CAS.
- A. R. Katritzky, M. Karelson, S. Sild, T. M. Krygowski and K. Jug, J. Org. Chem., 1998, 63, 5228 CrossRef CAS.
- M. K. Cyrański, T. M. Krygowski, A. R. Katritzky and P. von Ragué Schleyer, J. Org. Chem., 2002, 67, 1333 CrossRef.
- M. Palusiak and T. M. Krygowski, Chem.–Eur. J., 2007, 13, 7996 CrossRef CAS PubMed.
- M. Alonso and B. Herradón, J. Comput. Chem., 2010, 31, 917 CAS.
- S. Ostrowski and J. C. Dobrowolski, RSC Adv., 2014, 4, 44158 RSC.
- L. Pauling, L. O. Brockway and J. Y. Beach, J. Am. Chem. Soc., 1935, 57, 2705 CrossRef CAS.
- I. Alkorta, I. Rozas and J. Elguero, Struct. Chem., 1998, 9, 243–247 CrossRef CAS.
- I. Alkorta, L. Barrios, I. Rozas and J. Elguero, J. Mol. Struct.: THEOCHEM, 2000, 496, 131 CrossRef CAS.
- E. Espinosa, I. Alkorta, J. Elguero and E. Molins, J. Chem. Phys., 2002, 117, 5529–5542 CrossRef CAS.
- I. Alkorta, J. Elguero, E. Espinosa, I. Mata and E. Molins, J. Comput. Chem., 2003, 24, 416–421 CrossRef CAS PubMed.
- I. Mata, I. Alkorta, E. Molins and E. Espinosa, Chem.–Eur. J., 2010, 16, 2442 CrossRef CAS PubMed.
- M. K. Cyrański, Chem. Rev., 2005, 105, 3773 CrossRef PubMed.
- P. Bujak, I. Kulszewicz-Bajer, M. Zagorska, V. Maurel, I. Wielgus and A. Pron, Chem. Soc. Rev., 2013, 42, 8895 RSC.
- A. D. Becke, J. Chem. Phys., 1993, 98, 5648 CrossRef CAS.
- C. Lee, W. Yang and R. G. Parr, Phys. Rev. B: Condens. Matter Mater. Phys., 1988, 37, 785 CrossRef CAS.
- R. Ditchfield, W. J. Hehre and J. A. Pople, J. Chem. Phys., 1971, 54, 724 CrossRef CAS.
- M. J. Frisch, et al., Gaussian 09, Revision A.1, Gaussian Inc., Wallingford CT, 2009 Search PubMed.
- S. M. Islam, S. D. Huelin, M. Dawe and R. A. Poirier, J. Chem. Theory Comput., 2008, 4, 86 CrossRef CAS.
- K. Hęclik, B. Dębska and J. C. Dobrowolski, RSC Adv., 2014, 4, 17337 RSC.
- T. A. Keith, AIMAll (Version 14.04.17), TK Gristmill Software, Overland Park KS, USA, 2014, http://aim.tkgristmill.com Search PubMed.
Footnotes |
| † Electronic supplementary information (ESI) available: It consists of schemes of structures, distances and Rho and HOMA index values. See DOI: 10.1039/c4ra15311a |
| ‡ All calculations were performed using the B3LYP functional,18,19 standard Pople-type 6-31G** basis set,20 and Gaussian 09 software.21 The polyheterocyclic and all-trans and cis–transoid polyene systems were constrained to be planar. The 6-31G** basis set was shown to perform fairly well in geometry, frequency, energy, and electron density calculations.22,23 The AIM analysis of electron density parameters was performed using the AIMALL program.24 |
| This journal is © The Royal Society of Chemistry 2015 |