 Open Access Article
Creative Commons Attribution 3.0 Unported Licence
Color tunable aerogels/sponge-like structures developed from fine fiber membranes
Alexa
Villarreal†
a,
Raul
Barbosa†
a,
Saptasree
Bose
a,
Bhupendra B.
Srivastava
 b,
Victoria
Padilla-Gainza
a and
Karen
Lozano
*a
aMechanical Engineering Department, University of Texas Rio Grande Valley, 1201 W. University Dr., Edinburg, Texas 78539, USA. E-mail: karen.lozano@utrgv.edu
bDepartment of Chemistry, University of Texas Rio Grande Valley, 1201 W. University Dr., Edinburg, Texas 78539, USA
First published on 3rd February 2022
Abstract
The development of macroscopic aerogels from 1D systems, such as nanofibers, has resulted in a novel pathway to obtain porous and lightweight architectures. In this work, bright green, red, and tunable color emitting aerogels were obtained with luminescent nanofibers as the precursor system. A simple, low cost, and environmentally friendly process is followed where luminescent fillers are encapsulated within fibers which were subsequently freeze-dried to form 3D aerogels and sponge-like structures. Moreover, the aerogels/sponge-like structures show higher photoluminescence intensity than the fiber mats due to an increase of porosity which provides higher and direct interaction with the fillers and therefore an efficient light absorption resulting in higher luminescence. Manganese doped zinc germanate (Mn: Zn2GeO4) nanorods and chromium doped zinc gallate (Cr: ZnGa2O4) nanoparticles were used as the source of green and red emissions respectively. By precisely adjusting the stoichiometric ratios of nanorods and nanoparticles within the nanofibers, a broad spectrum output is obtained from the final aerogels. We foresee that these types of photoluminescent aerogels have promising potential applications in a variety of fields such as display devices, solid-state lighting, sensors, etc.
1. Introduction
Aerogels are solid, lightweight, and highly porous materials. Their solid porous 3D network structure, high specific surface area, low density, and unique chemical, thermal and optical properties make them suitable candidates for a variety of applications in the fields of catalysis, energy storage, and sensors.1–4 Recently, luminescent aerogels have attracted much attention as they open new opportunities in the design of optically tunable materials with spontaneous adjustable color emissions, for the purpose of solid-state lighting and other optical applications.1,5,6 The design of fluorescent aerogels is based on the appropriate interaction between fluorescent chromophores and the aerogel framework to achieve bright persistent luminescence.7 Traditional fluorescent materials such as quantum dots, perovskite nanocrystals, metal–organic frameworks, organic fluorescent dyes, lanthanide-doped glass, and ceramic or crystalline phosphors are promising luminescent materials due to their superior optical properties including intense luminescence, sharp and stable emission peaks, and high quantum yield.7–10 Two distinct strategies for tuning the luminescence of chromophore-doped aerogels include: changing the dopant type/nature and/or varying the doping concentration. For example, in 2016, Niederberger et al. synthesized a Eu3+ and Tb3+ doped Y2O3 luminescent aerogel with adjustable spectral emission from red to green.11 Srivastava et al. have also reported on the variation of the doping concentration to produce tunable emission ranging from white to red to green.12 Similarly, Veinot et al. fabricated hydrophilic silicon nanocrystals of various sizes and surface groups, and incorporated them into tetramethyl orthosilicate to produce aerogels with different levels of transparency.6 In 2018, Ren et al. produced Al2O3–Eu3+ luminescent aerogels which can be tailored to emit pink to green colors by varying the doping concentration of Eu3+.13 In 2020, Yang et al. offered a facile technique to prepare a white light emitting aerogel with the modulation of the stoichiometric ratio of lanthanides, thymidine, and carbon dots that display reversible stimuli-responsive properties.1 However, fluorescent composite aerogels processed by freeze drying or a critical point drying treatment suffer from insufficient interaction resulting in mechanical instability and aggregation of the chromophore, which can induce quenching of fluorescence intensity.7 Recently, luminescent nanofibers have emerged as an exciting luminescent material with paramount potential due to their excellent flexibility, high specific surface area, and light weight properties. Notably, 3D porous structures like aerogels can be synthesized using nanoscale building blocks such as polymeric nanofibers; the resulting aerogels are highly elastic, flexible and environmentally friendly.14 However, producing 3D scaffolds via the layer-by-layer deposition of luminescent nanofibers during electrospinning reduces the possibility to add desired scalable pores within the aerogels and they often exhibit mechanical instability.15–17 Ding and Greiner independently initiated a facile strategy to produce ultralight nanofiber-based aerogels by wetting and cutting long electrospun fibers until a thorough dispersion of the fibers formed followed by freezing the solution and subsequently placing it in a freeze-dryer.15,18–26 Despite investigating numerous approaches to produce short nanofibers for nanofiber-based aerogels, the method of mechanically cutting and dispersing continuous long fibers is considered as the most straightforward and simple technique in this newly emerging field of research.15,27–31In this study, lightweight bright luminescent aerogels were synthesized from fluorescent polyvinyl alcohol (PVA) fibers. PVA is a biocompatible, chemically and mechanically stable polymer. In this process, luminescent polymer nanofibers were prepared using in-house synthesized green luminescent manganese doped zinc germanate (Mn: Zn2GeO4, ZGOM) nanorods32,33 and red luminescent chromium doped zinc gallate (Cr: ZnGa2O4, ZGOC) nanoparticles with sub-10 nm size34–36 as the doping agents. The nanofibers were produced using the forcespinning® method instead of the electrospinning method to avoid the use of electric fields and organic solvents with specific dielectric constant, which is a primary requirement for the electric field driven electrospinning method. Moreover, the centrifugal spinning process was used which resulted in high yield and as a result a lower cost process. For the freeze-drying process, deionized water and 1,4-dioxane, as non-polar aprotic solvents, were selected as the dispersion media. The influence of the dispersion medium on the morphology and luminescence of the final structures was studied. PVA is known for its solubility in water, and nanofiber integrity was lost after the homogenization procedure, however, the fillers remained well dispersed and distributed, and neither sedimentation nor aggregation was observed. Upon freeze-drying, the final structure portrayed aerogel characteristics, and microscopy images revealed a porous solid network with porous morphology dependent upon filler morphology. As for the systems subjected to the dioxane medium, nanofibers were not dissolved and the ultimate 3D architecture revealed a disordered porous arrangement highly dependent on nanofiber entanglement resembling a sponge-like structure. Moreover, the resulting aerogels/sponges show higher luminescence when compared to their precursor nanofiber mats. The modulation of the stoichiometric ratio of red nanoparticles (NPs) and green nanorods (NRs) within the fiber matrix offers a final aerogel product with broad luminescence ranging from red to green with promising potential applications in a wide variety of fields.
2. Experimental
2.1. Materials
Zinc nitrate hexahydrate (Zn(NO3)2·6H2O, 98%), gallium nitrate hydrate (Ga(NO3)3·xH2O, 99.9%), chromium nitrate nonahydrate (Cr(NO3)3·9H2O, 99%), germanium oxide (GeO2, 99.99%), manganese(II) nitrate tetrahydrate (Mn(NO3)2·4H2O, 97%), urea and ammonium hydroxide solution (28.0–30.0% NH3 basis), and 1,4-dioxane (99.8%) were purchased from Sigma Aldrich. Poly(vinyl alcohol) (27–96 medium hydrolyzed grade) was purchased from Kuraray Poval™. Deionized (DI) water (25 MΩ cm) was produced from a Smart2Pure water purification system. All the chemicals were of analytical grade reagents and used directly without further purification. Persistent red luminescent sub-10 nm water dispersible ZGOC nanoparticles were synthesized following a simple and facile synthesis route.36 The water dispersible ZGOM nanorods were produced using the hydrothermal method described in the literature.322.2. Synthesis of luminescent PVA fine fibers
The 100% pure green and red fibers were prepared by incorporating 56 mg each of ZGOM and ZGOC, respectively, in 10 mL of DI water, followed by 3 minutes of homogenization using a probe sonicator (Sonic Dismembrator, Model 120, Fisherbrand™). Subsequently, 1.11 g of PVA was added to the previously prepared homogenized solution and placed in an oil bath for 1 h, at 75 °C, with a magnetic stirrer. The solution was then taken out of the oil bath and stirred overnight at room temperature.The fibers were produced by adding 2 mL of the prepared solution in the spinneret of a Cyclone™ L-1000 M, purchased from Fiberio Technology Corporation (McAllen, USA). Then it was spun from 5000 to 7000 rpm to allow the solution to exit through the spinneret's orifices. The solution was ejected from both ends of the spinneret through 30 gauge needles, and was deposited onto equally distanced vertical pillars, thus creating fine fibers which were then collected with a 10 × 10 cm collector after each cycle. Fibers were covered and stored in a low moisture environment. The ZGOM and ZGOC encapsulated PVA fine fibers are referred to as green PVA fibers (G-PF) and red PVA fibers (R-PF).
Four other composite luminescent fibers using different green nanorods and red nanoparticle concentrations were prepared following the method described above: (1) 90% red + 10% green; (2) 80% red + 20% green; (3) 60% red + 40% green and (4) 40% red + 60% green.
2.3. Synthesis of luminescent aerogels
The fiber mat (40 mg) was cut into 1 × 1 cm2 pieces and dispersed in 4 mL of DI water and subjected to multiple cycles of homogenization performed at intervals of 10 seconds. Two to three pieces of the precut mats were placed in the DI water container after each cycle and homogenization was continued using a PRO Scientific Bio-Gen PRO200 homogenizer to obtain a uniform fiber dispersion within the medium. The solution was then poured into a plastic mold and frozen at −82 °C in a freezer for 24 hours at a controlled temperature rate. Thereafter, the frozen system was placed in a freeze dryer for 48 hours to remove the solvent through sublimation. A 3D porous structure was obtained (Scheme 1). For the preparation of the green, red, and composite aerogels: ZGOM encapsulated PVA (green), ZGOC encapsulated PVA (red) and different ratios of ZGOM:ZGOC encapsulated PVA (composite) fibers were used as the precursors, respectively. The same procedure was followed to prepare the 1,4-dioxane based sponge-like 3D porous structure. It was seen during synthesis that unlike the system subjected to the water-based medium, the system subjected to the dioxane medium exhibited an opaque appearance, resulting from the prevailing nanofibers just suspended in the liquid and dispersed throughout the solution rather than fiber dissolution as happened with the water medium.2.4. Instrumentation
To quantify the developed luminescent nanoparticles, powder X-ray diffraction (XRD) data were collected using a scanning mode of 2θ with a scanning step size of 0.04° and a scanning rate of 2.0° min−1. X-ray photoelectron spectroscopy (XPS) was carried out using a Thermo scientific K-alpha XPS with 180° double focusing hemispherical analyzer with 128 channel detectors. The accuracy of the binding energy (BE) was 0.1 eV as calibrated by Cu 3P3/2 (75.1 eV) and Cu 2P3/2 (932.7 eV) reference peaks. Survey scan spectra of the fibrous mats were taken with 10 scans at a surface scan spot of 300 microns. Morphological analysis of the fine fibers and solid aerogels was carried out using a scanning electron microscope (SEM) (Sigma VP; Carl Zeiss, Jena, Germany). Thermogravimetric analysis was completed using a NETZSCH TG 209 at a rate of 10 °C min−1 under N2. The excitation and emission spectra of the as-prepared fine fibers and aerogels were recorded using an Edinburgh Instruments FLS980 fluorimeter system equipped with a xenon (Xe) lamp, as an excitation source, and a TE-cooled photo-multiplier tube (Hamamatsu, Model R928P) for emission detection. All emission spectra were corrected for determining the spectral sensitivity of the system and detector, as well as the intensity variation in the Xe light source using a reference diode. Samples (1 × 1 cm) were prepared and placed in a Thermo Nicolet NexusTM 470 FT-IRESP Fourier Transform Infrared (FTIR) machine. After removing the background spectrum, the specimens were scanned in a 400–4000 cm−1 range with a resolution of 4 cm−1.3. Results and discussion
3.1. Structural and morphological characterization of bare ZGOM and ZGOC nanoparticles
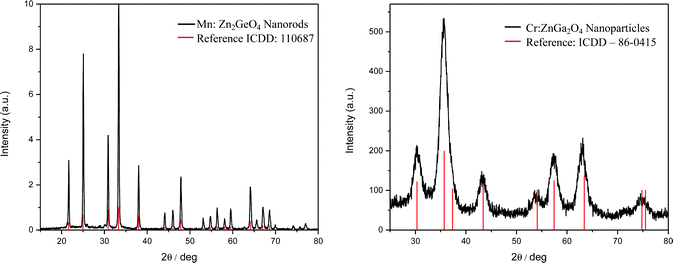
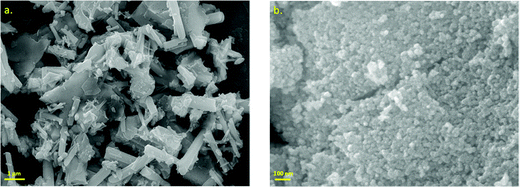
The nanoparticles were synthesized following the aforementioned procedure. Fig. 1 represents the XRD patterns of ZGOM nanorods and ZGOC nanoparticles in the powder form. The results adhere to the respective standard patterns of Zn2GeO4 (JCPDS file no. 11-0687) and ZnGa2O4 (JCPDS file no. 86-0415), indicating the formation of pure phased compounds, and also the presence of sharp peaks suggests expected crystallinity.The FESEM images of the hydrothermally synthesized ZGOM nanorods and ZGOC nanoparticles are shown in Fig. 2a and b, respectively. The morphology of the ZGOM shows the formation of nanorods with smooth surfaces. The majority of NRs show lengths of 1–3 μm with 200–300 nm diameter.32 The FESEM image of ZGOC clearly demonstrates the formation of spherical nanoparticles ranging in diameter from 10–20 nm.
3.2. Characterizations of G-PF and R-PF fibers
The G-PF and R-PF fine fibers show smooth, long, continuous fiber morphology without aggregation of nanorods or nanospheres (Fig. 3a and b). Moreover, there are no beads present in the developed fibers, and the fiber mats are highly flexible. The digital photographs of the bright green and red fiber mats are shown in the inset of Fig. 3. Elemental mapping was performed (Fig. 3c and d) on the pure green and pure red fibers proving the presence and uniform distribution of the green nanorods and red nanoparticles within the PVA fiber showing a concentration of 5% Mn, 18% Zn, 16% Ge, and 61% O for the green nanorods and 15% Cr, 10% Zn, 11% Ga, and 64% O for the red nanoparticles.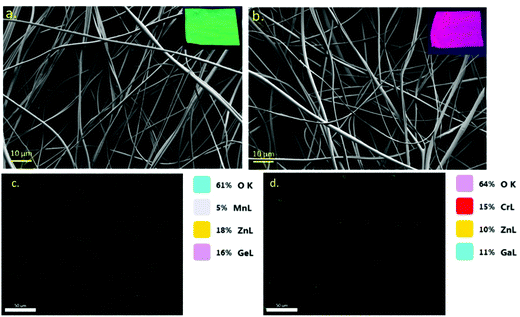 | ||
| Fig. 3 (a) FESEM image of green nanoparticle encapsulated G-PF fibers. (b) FESEM image of red nanoparticle encapsulated R-PF fibers; (c) elemental mapping of G-PF and (d) R-PF. | ||
3.3. Morphological characteristics of the fluorescent fiber-based aerogels (FA)
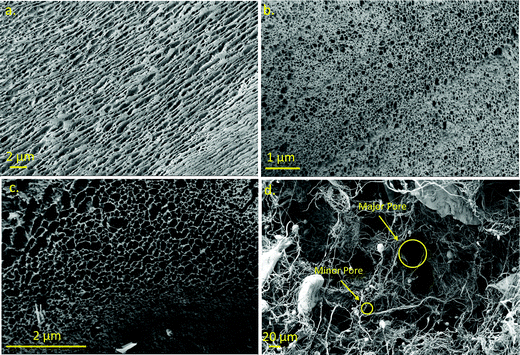
It has been reported that the dispersion medium (i.e. water, ethanol, camphene, tert-butyl alcohol, toluene, 1,4-dioxane) plays an important role in the physical, mechanical, and chemical properties of freeze-dried aerogels.15 The green and red aerogels were prepared via the freeze-drying method using two different dispersion liquids: water and 1,4-dioxane. The porous morphology shown in the green and red water-based aerogels is derived from the formation of ice crystals during the process of freezing the solution. Fig. 4a–c depict the SEM images of the aerogel-like structure that resulted from treatment under the water medium, while Fig. 4d illustrates the sponge-like structure that resulted from exposure to the dioxane medium. It is worth noting that Fig. 4a shows a material made from 100% G-PF where green luminescent nanorods were used, and the material shown in Fig. 4b is composed of 100% R-PF which contains spherical nanoparticles. The morphology of the pores (size and shape) is clearly affected by the nanoparticles and nanorods used within the precursor fiber systems. Fig. 4a exhibits elongated pores, while Fig. 4b displays circular pores. When combined (G-PF/R-PF composite fiber mats), the final product demonstrates traits of both nanomaterials, round pores with larger diameters, and is slightly elongated (i.e.Fig. 4c). The role played by the ZGOC spherical NPs and ZGOM nanorods in the systems subjected to water medium dominates the ultimate shape of the pores within the aerogel structure since the nanofiber structure was lost. The NPs and NRs act as templates for the growth of ice crystals. During the freezing phase, anisotropy phase separation occurs between ice and the polymer/fillers, forming intercalated ice crystals around the PVA and respective NP/NR walls. Freeze drying removes ice from the system and leaves pores shaped according to the composition of the system.As for the system developed using dioxane as the medium, SEM images show a porous, sponge-like fibrous network composed of preserved entangled nanofibers where a highly disordered pore structure is observed (Fig. 4d).
The sponge-like 3D porous network produced using 1,4-dioxane as the dispersion medium (Fig. 4d) shows a very different morphology when compared to the water-based aerogels. The removal of the ice crystals by sublimation resulted in a nanofibrous framework characterized by a large variation in the pore size and morphology. The porous network is less compact in nature and the pores are not homogeneous as compared to the water-based aerogels. Pore size and porosity can be tailored not only by altering processing parameters such as freezing rate, fiber loading, and solvent, but also by the morphology of the encapsulated particles within the starting fibers.
3.4. Fourier transform infrared spectroscopy (FTIR)
Fig. 5 shows the FTIR spectra for the green, red and the fine fibers of the composite along with the aerogels made from the fibers. The infrared spectra for the region 400–4000 cm−1 correspond to the most prominent features of the PVA. The main peaks of PVA were observed at 3287 cm−1, 2919 cm−1, 1711 cm−1, 1424 cm−1, 1325 cm−1, 1084 cm−1, and 837 cm−1. These peaks are ascribed to the O–H stretching vibration of the hydroxy group, C–H stretching, C![[double bond, length as m-dash]](https://www.rsc.org/images/entities/char_e001.gif) O stretching, C–H bending, CH2 asymmetric stretching vibration, C
O stretching, C–H bending, CH2 asymmetric stretching vibration, C![[double bond, length as m-dash]](https://www.rsc.org/images/entities/char_e001.gif) O carbonyl stretch, C–H bending vibration of CH2, C–O (acetyl) stretching, and C–C stretching vibration, respectively.37,38 It is important to note that the normalized FTIR peaks of the fibers and aerogels are in very similar positions.
O carbonyl stretch, C–H bending vibration of CH2, C–O (acetyl) stretching, and C–C stretching vibration, respectively.37,38 It is important to note that the normalized FTIR peaks of the fibers and aerogels are in very similar positions.
3.5. X-Ray photoelectron spectroscopy (XPS)
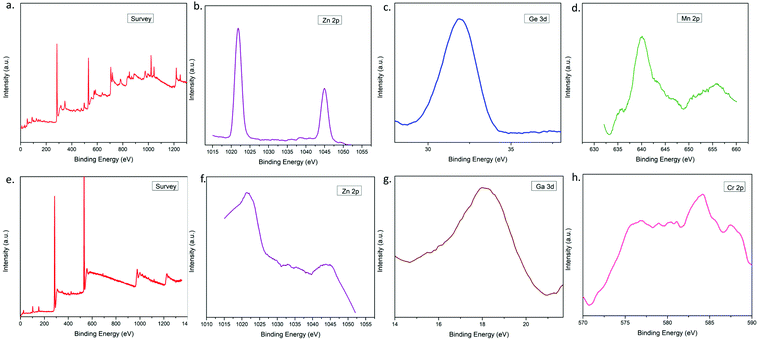
To confirm the presence of Mn:Zn2GeO4 nanorods within the aerogel matrix, X-ray photoelectron spectroscopy (XPS) analysis was performed. The XPS spectrum of the green aerogel revealed that the sample is comprised of Zn, Ge, Mn, O, and C (Fig. 6a). Fig. 6b shows the representative peaks of the Zn2+ oxidation states at 1022 and 1045 eV, corresponding to Zn 2p3/2 and Zn 2p1/2 respectively.39 Similarly, Fig. 6c exhibits the characteristic Ge 3d peak at 31.5 eV which is ascribed to the Ge–O bonding in the form of Ge4+.39,40Fig. 6d displays the XPS spectrum of Mn 2p with two peaks at 642 and 655 eV, which could be due to Mn 2p3/2 and Mn 2p1/2 levels, respectively. The spin energy separation of ∼13 eV, is a characteristic of the Mn2+ oxidation state.39,41 The presence of C and O is confirmed from the survey spectrum.XPS was carried out for the red aerogel to check the presence of red luminescent Cr:ZnGa2O4 nanoparticles within the aerogel network. Fig. 6e shows the survey XPS spectrum confirming the presence of C, O, Ga, Zn, and Cr. The XPS spectrum in Fig. 6f shows two characteristic peaks of Zn2+ at 1022 (2p3/2) and 1045 eV (2p1/2).42 The XPS spectrum of Ga is shown in Fig. 6g having a characteristic peak at 18.8 eV which is attributed to Ga 3d.43 The presence of Cr has been displayed in Fig. 6h where a peak has been found at 585 eV corresponding to Cr 2p1/2.44 The presence of C and O is confirmed from the survey spectrum. All of the binding energy values and gaps between individual elements of the luminescent green nanorods and red nanoparticles (which were encapsulated in the precursor nanofibers) matched well with the reference values, confirming the existence and phase purity of the luminescent particles within the aerogel.
3.6. Thermogravimetric analysis (TGA)
TGA analysis was carried out for the developed fiber and aerogel systems to evaluate their thermal stability. As expected, negligible changes are observed for the systems when analyzed as fibers or aerogels. Thermograms are shown in Fig. 7a and b. For the green fibers and green aerogel, the first weight loss of 7% occurs at approximately 100 °C due to the evaporation of adsorbed water.45 After this, 65% weight loss occurred in the temperature range of 250 to 350 °C which involves the dehydration of PVA to polyene. Notably, in the case of the green fibers the complete formation of polyene was observed at 352 °C, whereas the corresponding green aerogel shows a similar transition at 342 °C. The dehydrated PVA was thermally decomposed by chain scission above 476 °C. The red fiber and red aerogel show a similar loss (7% weight loss) of adsorbed water at 100 °C. The dehydration of PVA ranged from 260–370 °C which is associated with a 70% weight loss. Thereafter, thermal decomposition of polyene via chain degradation occurred from 370–480 °C.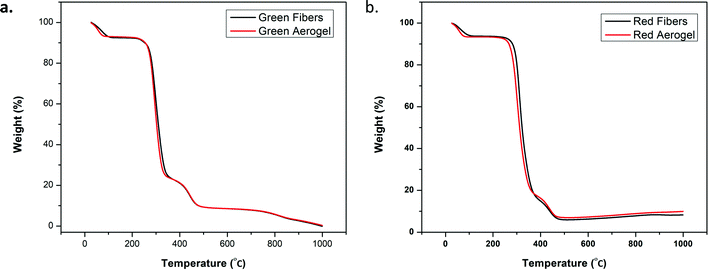 | ||
| Fig. 7 (a) TGA plots for pure green fibers and the water-based aerogel; and (b) pure red fibers and the water-based aerogel. | ||
3.7. Photoluminescence (PL) measurements
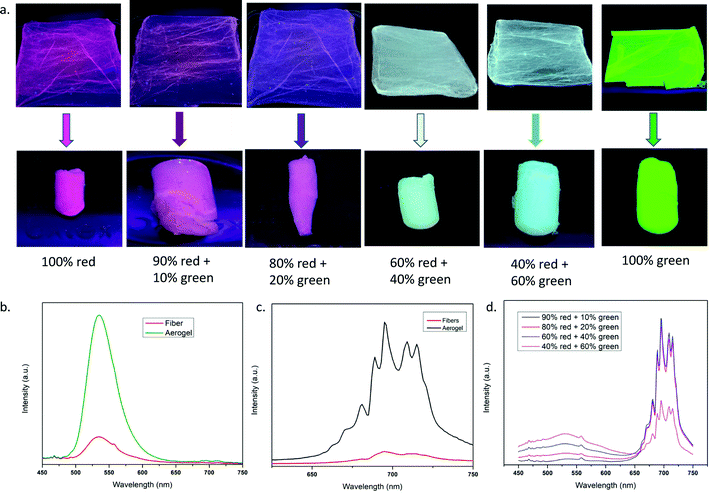
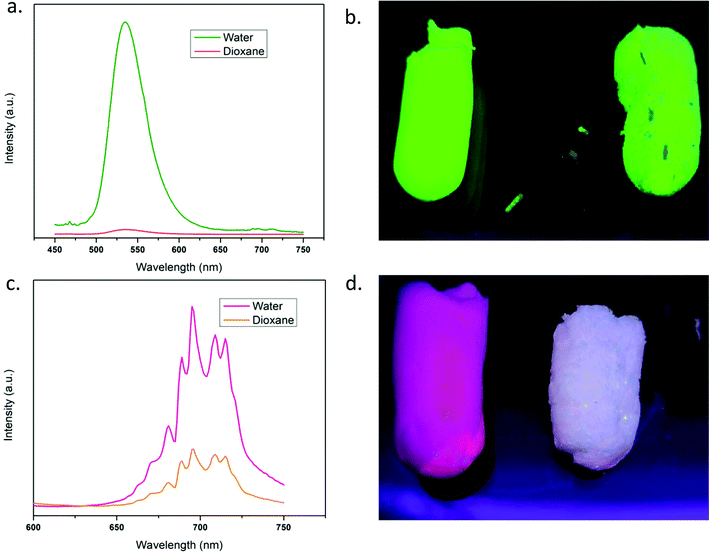
Fig. 8 shows the photoluminescence (PL) properties of the fibers and aerogels. The digital photographs (Fig. 8a) clearly exhibit the appearance of the fluorescent fibers and aerogels under UV light, indicating the successful tuning of color emission depending on the stoichiometric changes of the encapsulated nanoparticles within the fiber matrix. PL emission spectra for green and red aerogels (Fig. 8b and c) show intense emission peaks at 535 and 695 nm, respectively, under UV light (254 nm) excitation. The unaltered emission peaks were observed for the green and red nanoparticles, as well as for the fine PVA fibers, which encapsulate the nanoparticles32,33,36 demonstrating the conservation of the original emission bands of the nanoparticles even after the covalent linkage of the luminescent fibers in the final 3D network of the aerogels. The green peak at 535 nm is attributed to the radiative 4T1 (4G) → 6A1 (6S) transition due to parity forbidden d → d transition of the Mn2+ ion in ZGOM NRs, encapsulated in the fine PVA fibers which act as the precursor of fluorescent aerogels. Mn2+ displays green to red tunable emission depending on the coordination chemistry of the doped lattice;33,46 in this case, the green band is prevalent since high spin Mn2+ occupies low coordination tetrahedral Zn2+ sites in the doped lattice of the NRs. It is worth mentioning that the coordination chemistry and luminescence properties of the NRs remain unchanged in the fibers and in the aerogel as well. The same observation is true for the pure red emitting aerogel where the bright red emission band at 695 nm is ascribed to the 2E → 4A2 transition due to trivalent chromium ions occupying the octahedral sites within the red nanoparticles.33,47,48 No fluorescence quenching of the fibers is observed due to the aerogel formation, rather the freeze-drying process removes the hydration from the structure which eliminates the chance of quenching. Moreover, the aerogels show higher emission intensities than fiber mats (Fig. 8b and c) due to the resultant highly organized porous wall solid-like texture that provides higher and direct interaction of light sources with the nanoparticles and therefore an efficient light absorption resulting in an enhanced luminescence for the 3D systems made in the water medium. However, the 3-D dioxane's fibrous network resulted in a non-uniform porous structure based on nanofiber entanglement which resulted in a higher degree of scattering and less interaction with the nanoparticles therefore causing an inefficient absorption and therefore a less luminescent system. The PL behavior of the composite aerogels is shown in Fig. 8d. All composite aerogels show visible light emission ranging from green to red depending on the ratios of green nanorods to red nanoparticles present in their precursor fine fibers which are freeze dried into aerogels. The emission spectra of the four types of composite aerogels under 254 nm excitation have both red and green emission peaks and their intensities are dependent on the concentration ratios of the nanoparticles present in the composite fibers from which the aerogels are formed. Fig. 9(a and c) show the comparison for the emission intensities of aerogels using water and dioxane as the dispersion medium for the synthesis. It is clearly observed that the emission intensities (both green and red) are higher for the water medium which is also depicted from the digital photographs of the aerogels taken under UV light (Fig. 9b and d). From SEM images (Fig. 4a–c), it was observed that the structures resulting from being subjected to the water medium exhibit a high degree of order, and a structure with a large surface area with homogenous dispersion of nanoparticles is obtained where light absorption is maximized. And the SEM image of the dioxane based sponge-like porous 3D network (Fig. 4d) shows the fibrous network of the nanofibers with heterogeneous pore size and distribution. The sponge-like nature of this material proved less effective in light absorption (when compared to the water-based materials), mostly due to the irregular pore size/shape which is responsible for irregular transmission of incident light within the system and therefore reduced absorption capabilities of the encapsulated NPs/NRs, resulting in reduced photoluminescence intensity.4. Conclusions
In summary, we have demonstrated water-based synthesis of ultralight color tunable luminescent aerogels/sponge-like structures from the tailored assembly of red and green emitting nanoparticles encapsulated within PVA nanofibers. Varying the concentration of ZGOM and ZGOC (manganese doped zinc germanate, Mn:Zn2GeO4 and chromium doped zinc gallate, Cr:ZnGa2O4) compounds promoted the development of the final colorimetric performance of the final structure. The developed study showed a significantly higher photoluminescence effect within the aerogel structure when compared to their corresponding luminescent nanofiber mats. This can be attributed to the higher surface-lower density solid 3D assembly when compared to the nanofiber mats and therefore higher and direct interaction with the nanoparticles which resulted in enhanced light absorption causing higher luminescence. Moreover, the nature of pores in the water-based aerogels is affected by the morphologies of the fillers. Notably, these aerogels/sponge-like structures were prepared by a green synthesis pathway using a toxic solvent free route (all water based). This process promotes sustainability and low toxicity within the final product which has a wide range of exciting potential applications.Conflicts of interest
The authors declare that they have no known competing financial interests or personal relationships that could have appeared to influence the work reported in this paper.Acknowledgements
The authors gratefully acknowledge funding from NSF under DMR PREM grant 2122178.References
- M. Zhang, J. Xue, Y. Zhu, C. Yao and D. Yang, ACS Appl. Mater. Interfaces, 2020, 12, 22191–22199 CrossRef CAS PubMed.
- S. Zhao, W. J. Malfait, N. Guerrero-Alburquerque, M. M. Koebel and G. Nystroem, Angew. Chem., Int. Ed., 2018, 57, 7580–7608 CrossRef CAS PubMed.
- Y. Cao, L. Lewis, W. Y. Hamad and M. J. MacLachlan, Adv. Mater., 2019, 31, 1808186 CrossRef PubMed.
- L. Dou, X. Zhang, X. Cheng, Z. Ma, X. Wang, Y. Si, J. Yu and B. Ding, ACS Appl. Mater. Interfaces, 2019, 11, 29056–29064 CrossRef CAS PubMed.
- B. Cai, V. Sayevich, N. Gaponik and A. Eychmueller, Adv. Mater., 2018, 30(33), 1707518 CrossRef PubMed.
- M. Aghajamali, M. Iqbal, T. K. Purkait, L. Hadidi, R. Sinelnikov and J. G. C. Veinot, Chem. Mater., 2016, 28, 3877–3886 CrossRef CAS.
- B. Wu, G. Zhu, A. Dufresne and N. Lin, ACS Appl. Mater. Interfaces, 2019, 11, 16048–16058 CrossRef CAS PubMed.
- H. Wang, Z. Shao, M. Bacher, F. Liebner and T. Rosenau, Cellulose, 2013, 20, 3007–3024 CrossRef CAS PubMed.
- F. S. Rodembusch, L. F. Campo, V. Stefani and A. Rigacci, J. Mater. Chem., 2005, 15, 1537–1541 RSC.
- T. Mondal, S. Mondal, S. Bose, D. Sengupta, U. K. Ghorai and S. K. Saha, J. Mater. Chem. C, 2018, 6, 614–621 RSC.
- W. Cheng, F. Rechberger and M. Niederberger, ACS Nano, 2016, 10, 2467–2475 CrossRef CAS PubMed.
- B. B. Srivastava, S. K. Gupta, S. Mohan, A. Abraham, A. Portales and Y. Mao, Mater. Lett., 2021, 297, 129964 CrossRef CAS.
- B. Gao, Y. Ma, J. Mei, S. Lu and L. Ren, Chem. Eng. Sci., 2018, 331, 597–605 CrossRef CAS.
- J. Zhu, S. Lv, T. Yang, T. Huang, H. Yu, Q. Zhang and M. Zhu, Adv. Sustainable Syst., 2020, 4, 1900141 CrossRef CAS.
- F. Deuber and C. Adlhart, Chimia, 2017, 71, 236–240 CrossRef CAS PubMed.
- W. E. Teo and S. Ramakrishna, Nanotechnology, 2006, 17, R89–R106 CrossRef CAS PubMed.
- A. Greiner and J. H. Wendorff, Angew. Chem., Int. Ed., 2007, 46, 5670–5703 CrossRef CAS PubMed.
- Y. Si, J. Yu, X. Tang, J. Ge and B. Ding, Nat. Commun., 2014, 5, 5802 CrossRef PubMed.
- G. Duan, S. Jiang, V. Jerome, J. H. Wendorff, A. Fathi, J. Uhm, V. Altstaedt, M. Herling, J. Breu, R. Freitag, S. Agarwal and A. Greiner, Adv. Funct. Mater., 2015, 25, 2850–2856 CrossRef CAS.
- S. Chabi, V. G. Rocha, E. Garcia-Tunton, C. Ferraro, E. Saiz, Y. Xia and Y. Zhu, ACS Nano, 2016, 10, 1871–1876 CrossRef CAS PubMed.
- C. Ferraro, E. Garcia-Tunon, V. G. Rocha, S. Barg, M. D. Farinas, T. E. G. Alvarez-Arenas, G. Sernicola, F. Giuliani and E. Saiz, Adv. Funct. Mater., 2016, 26, 1636–1645 CrossRef CAS.
- X. Gui, J. Wei, K. Wang, A. Cao, H. Zhu, Y. Jia, Q. Shu and D. Wu, Adv. Mater., 2010, 22, 617–621 CrossRef CAS PubMed.
- N. Kraenzlin and M. Niederberger, Adv. Mater., 2013, 25, 5599–5604 CrossRef CAS PubMed.
- F. Rechberger and M. Niederberger, Nanoscale Horiz., 2017, 2, 6–30 RSC.
- J.-S. Kim and D. H. Reneker, Polym. Compos., 1999, 20, 124–131 CrossRef CAS.
- F. Deuber, S. Mousavi, L. Federer, M. Hofer and C. Adlhart, ACS Appl. Mater. Interfaces, 2018, 10, 9069–9076 CrossRef CAS PubMed.
- M. Thieme, S. Agarwal, J. H. Wendorff and A. Greiner, Polym. Adv. Technol., 2011, 22, 1335–1344 CrossRef CAS.
- S. Jiang, G. Duan, J. Schoebel, S. Agarwal and A. Greiner, Compos. Sci. Technol., 2013, 88, 57–61 CrossRef CAS.
- M. Langner and A. Greiner, Macromol. Rapid Commun., 2016, 37, 351–355 CrossRef CAS PubMed.
- Y. Ren, S. Wang, R. Liu, J. Dai, X. Liu and J. Yu, RSC Adv., 2016, 6, 30139–30147 RSC.
- Y. Yu, S. Hua, M. Yang, Z. Fu, S. Teng, K. Niu, Q. Zhao and C. Yi, RSC Adv., 2016, 6, 110557 RSC.
- B. B. Srivastava, S. K. Gupta, Y. Li and Y. Mao, Dalton Trans., 2020, 49, 7328–7340 RSC.
- R. Barbosa, S. K. Gupta, B. B. Srivastava, A. Villarreal, H. De Leon, M. Peredo, S. Bose and K. Lozano, J. Lumin., 2021, 231, 117760 CrossRef CAS.
- B. B. Srivastava, S. K. Gupta and Y. Mao, CrystEngComm, 2020, 22, 2491–2501 RSC.
- B. B. Srivastava, S. K. Gupta and Y. Mao, J. Mater. Chem. C, 2020, 8, 6370–6379 RSC.
- B. B. Srivastava, A. Kuang and Y. Mao, Chem. Commun., 2015, 51, 7372–7375 RSC.
- A. Kharazmi, N. Faraji, R. M. Hussin, E. Saion, W. M. M. Yunus and K. Behzad, Beilstein J. Nanotechnol., 2015, 6, 529–536 CrossRef CAS PubMed.
- J. Lee, T. Isobe and M. Senna, J. Colloid Interface Sci., 1996, 177, 490–494 CrossRef CAS.
- Q. Li, X. Miao, C. Wang and L. Yin, J. Mater. Chem. A, 2015, 3, 21328–21336 RSC.
- F. Zou, X. Hu, Q. Long, Y. Jiang, X. Xiong, Y. Qiao and Y. Huang, Nanoscale, 2014, 6, 924–930 RSC.
- T. T. Yu, H. L. Liu, M. Huang, J. H. Zhang, D. Q. Su, Z. H. Tang, J. F. Xie, Y. J. Liu, A. H. Yuan and Q. H. Kong, RSC Adv., 2017, 7, 51807–51813 RSC.
- D. Beke, M. V. Nardi, G. Bortel, M. Timpel, Z. Czigany, L. Pasquali, A. Chiappini, G. Bais, M. Rudolf, D. Zalka, F. Bigi, F. Rossi, L. Bencs, A. Pekker, B. G. Markus, G. Salviati, S. E. Saddow, K. Kamaras, F. Simon and A. Gali, Chem. Mater., 2021, 33, 2457–2465 CrossRef CAS PubMed.
- S. Wang, X. Zhang, Z. C. Feng and Y. Cui, Opt. Express, 2014, 22, 17440–17448 CrossRef PubMed.
- M. K. Lee and S. Kang, J. Ceram. Soc. Jpn., 2018, 126, 382–388 CrossRef CAS.
- Y. Park, M. You, J. Shin, S. Ha, D. Kim, M. H. Heo, J. Nah, Y. A. Kim and J. H. Seol, Sci. Rep., 2019, 9, 3026 CrossRef PubMed.
- S. K. Gupta, R. M. Kadam, R. Gupta, M. Sahu and V. Natarajan, Mater. Chem. Phys., 2014, 145, 162–167 CrossRef CAS.
- A. Bessière, S. K. Sharma, N. Basavaraju, K. R. Priolkar, L. Binet, B. Viana, A. J. J. Bos, T. Maldiney, C. Richard, D. Scherman and D. Gourier, Chem. Mater., 2014, 26, 1365–1373 CrossRef.
- H. Abdou, S. K. Gupta and Y. Mao, J. Lumin., 2019, 214, 116599 CrossRef CAS.
Footnote |
| † Alexa Villarreal and Raul Barbosa contributed equally to this work. |
| This journal is © The Royal Society of Chemistry 2022 |


