 Open Access Article
Ethanol-blended petroleum fuels: implications of co-solvency for phytotechnologies
Michael O. Eze * and
Simon C. George
Department of Earth and Environmental Sciences, MQ Marine Research Centre, Macquarie University, Sydney, NSW 2109, Australia. E-mail: michael.eze@hdr.mq.edu.au
First published on 11th February 2020
Abstract
In recent decades, there has been increasing interest in the use of ethanol-blended fuels as alternatives to unblended fossil fuels. These initiatives are targeted at combating CO2 and particulate matter emissions, as these oxygenates leave behind a lesser carbon footprint. Noble as it may appear, this innovation is not without attendant ugly consequences. One major implication is the effect of co-solvency on the applicability of various forms of phytotechnologies for contaminant removal. By means of gas chromatography-mass spectrometry, this research investigated the effect of diesel fuel ethanol addition on the leaching potentials of petroleum hydrocarbons. Since phytoremediation of hydrocarbons depends largely on rhizodegradation of contaminants by the root-associated microbiome, the leaching of petroleum hydrocarbons beyond the rooting zones of plants may limit the effectiveness of this process as a reclamation strategy for ethanol-blended fuel spills. The analyses presented in this paper highlight the need for energy scientists to carefully consider the environmental impacts of ethanol-blended innovations holistically.
Introduction
Crude oil and fuel spillages are the most persistent environmental menace resulting from oil and gas exploration, production and utilisation. Their increasing negative impact on the environment has precipitated legitimate concerns in the last decade. The United States Environmental Protection Agency (US EPA) estimated that rehabilitation can cost over $US1 million per hectare.1,2 Spills have occurred due to corrosion, human error and equipment failure.3–5Traditional solutions for remediation (such as excavation and relocation of contaminants to landfills) are expensive and usually impractical because of the amount of soil involved, whereas those that remediate contaminants in situ are generally less expensive.6,7 Additionally, the number of new contaminated sites that are extensive in size continues to increase. Consequently, more cost-effective remediation technologies are being investigated.8,9 One of the emerging strategies, categorised as phytotechnology (also called phytoremediation), is the use of plants to extract, mitigate, and stabilise both organic and inorganic contaminants.10–12 This approach can also assist in reforestation.13
Since the birth of phytoremediation, various techniques have been trialled and developed.14–16 These techniques, primarily driven by costs and environmental impacts, rely on the use of plant interactions (physical, biochemical, biological, chemical and microbiological) in polluted sites to mitigate the toxic effects of pollutants. Depending on the pollutant type (elemental or organic), there are several mechanisms (accumulation or extraction, degradation, filtration, stabilisation and volatilisation) involved in phytoremediation. Elemental pollutants (toxic heavy metals and radionuclides) are mostly removed by extraction, transformation and sequestration. On the other hand, organic pollutants (hydrocarbons and chlorinated compounds) are predominantly removed by degradation, rhizoremediation, stabilisation and volatilisation, with mineralisation being possible when some plants such as willow and alfalfa are used.17,18
As a strategy, and especially in comparison to removal and relocation of contaminants, phytoremediation is inexpensive. The US EPA has indicated that implementing this technology may result in cost savings of 50 to 80% over traditional methods.1,2 Benefits from successful approaches of phytoremediation include healthier soil, promoting and sustaining indigenous microbial communities that are essential for long-term bioremediation of the soil, and creation of a more pleasing landscape, compared with ugly contaminated areas.19 Other advantages of phytoremediation include low cost, environmental friendliness, the possibility of large-scale operations, low installation and maintenance costs, conservation of soil structure, prevention of erosion, and control of the leaching of pollutants.20,21 Moreover, following phytoremediation, there might be improved soil fertility due to the input of organic matter.22
Despite the numerous advantages of phytoremediation, it has its own limitations. One major limitation is root depth. For this technique to achieve its desired objective, the contaminants of interest must be within the rooting zones of plants. Nonetheless, many contaminants migrate vertically within the soil matrix, thereby making them inaccessible to plant roots. Compounding this problem is the addition of oxygenates such as ethanol and methyl-tertiary-butyl ether (MTBE) to fuels, so as to reduce vehicular emissions to the atmosphere. These additives, although beneficial in reducing atmospheric pollution, may increase the leaching potentials of organic contaminants due to the co-solvency of petroleum hydrocarbons and by the provision of a preferential substrate for microbial utilisation.23
Ethanol–fuel mixtures have an “E” and a number, which describe the percentage of ethanol by volume in the mixture. For example, “E10” refers to a 10% by volume ethanol and 90% by volume diesel mixture. Ethanol–diesel mixtures range from E5 to E85, with E10 being the most common. Alternative blends in many countries, especially Brazil and the United States of America, include ethanol–biodiesel mixtures. This increasing shift from unblended petroleum-derived diesel to ethanol-blended diesel may pose significant challenges to the success of phytoremediation and the rehabilitation of diesel fuel contaminated sites, owing to the co-solvency caused by the ethanol. Therefore, the environmental implications of ethanol additives to diesel fuel must be thoroughly investigated. This is the motivation for this research.
Experimental
Stability of ethanol blends
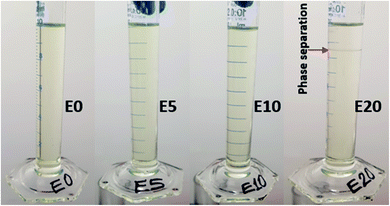
Diesel was obtained from a Shell service station in Sydney, Australia. To determine the categories of ethanol–diesel fuel blends to be used for this study, the stability of ethanol-blended diesel fuels at 20 °C were examined without the use of stabilising additives. To do this, three different blends (E5, E10 and E20) were prepared in addition to the unblended diesel (E0), and their miscibility was observed. The E5 and E10 blends gave stable (homogenous) mixtures (Fig. 1), indicating that ethanol is soluble in diesel fuel up to 10% by volume. On the other hand, E20 gave a heterogeneous (two-phase) mixture, as shown by phase separation and a boundary layer (red pointer). This indicates that at 20% by volume, ethanol is not completely miscible with diesel. Thus, the preparation of E20 diesel and other higher blends requires the use of stabilisers. This observation agrees with other research work on the stability of ethanol-blended diesels.24,25 In view of this, even though all four blends were examined, this study focused primarily on the E0, E5 and E10 blends, which are both the most stable and most common ethanol–diesel fuel blends.Leaching column set-up
The movement of diesel fuel was followed in a lab-based study of a 90 cm sand column packed in a polyethylene column of 15 cm diameter, with the effect of ethanol addition on this movement investigated. Four columns representing E0, E5, E10 and E20 were set up and eluted with deionised water (Fig. 2). To prepare the column, the method used by Adam et al.23 was adopted with some modifications.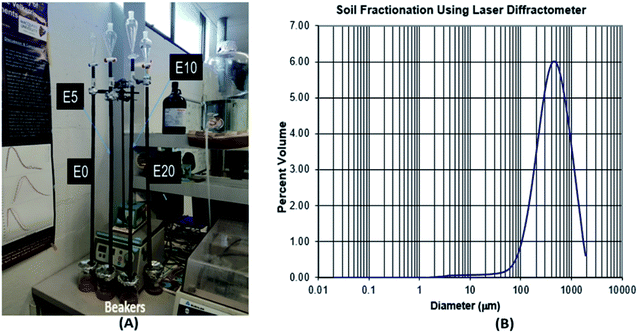 | ||
| Fig. 2 Leaching column set-up (A), and soil textural class determination using laser diffractometer (B). | ||
Polyethylene drain pipes were cut into sections (L 10 cm x ID 13 mm). The sections were sealed together using waterproof tape to provide an airtight seal at the joins. Nine sections were fitted together to create a column 90 cm in length. Each column was filled with the same mass of extracted and baked river sand (200 g) to ensure that the same packing density was maintained. The choice of river sand was necessary to provide low organic matter content. After sieving to remove >2 mm gravel, the soil textural class was determined using laser diffractometer at the sediment analysis laboratory, Macquarie University. The textural class is sand (97.5% sand, 2.5% silt and 0.02% clay), with a mode of medium sand (450 μm), and 1.18% organic matter content by loss on ignition (Fig. 2). To ensure accurate results, two major factors that affect soil total petroleum hydrocarbon content, namely biodegradation and volatilisation, were controlled. First, the sand was twice extracted using an accelerated solvent extractor (ASE300) and dichloromethane (DCM)![[thin space (1/6-em)]](https://www.rsc.org/images/entities/char_2009.gif) :
:![[thin space (1/6-em)]](https://www.rsc.org/images/entities/char_2009.gif) methanol (9
methanol (9![[thin space (1/6-em)]](https://www.rsc.org/images/entities/char_2009.gif) :
:![[thin space (1/6-em)]](https://www.rsc.org/images/entities/char_2009.gif) 1). It was then baked at 500 °C for 24 hours. This was necessary in order to remove all naturally occurring organic compounds and extraneous matter in the sand, as well as to prevent any possible biodegradation of the diesel fuel by microbial enzymes within the leaching column. The bottom section of the column was fitted with a fine nylon mesh to cover the lower end to prevent the sand from escaping, but allowing the leachate to freely drain away. An extra section was placed on the top of the column to provide a collar for the water reservoir. The column was run at a temperature of about 20 °C to prevent volatilisation.
1). It was then baked at 500 °C for 24 hours. This was necessary in order to remove all naturally occurring organic compounds and extraneous matter in the sand, as well as to prevent any possible biodegradation of the diesel fuel by microbial enzymes within the leaching column. The bottom section of the column was fitted with a fine nylon mesh to cover the lower end to prevent the sand from escaping, but allowing the leachate to freely drain away. An extra section was placed on the top of the column to provide a collar for the water reservoir. The column was run at a temperature of about 20 °C to prevent volatilisation.
5 mL of each blend was added by pipette to the respective columns. The diesel fuel was allowed to penetrate into the sand for approximately 30 minutes. After this time, 20 mL of water was poured in to wet the column. Then 200 mL of water was added through a 250 mL funnel. This acted as a reservoir, allowing a constant supply of water to leach through the column for ten days. The flow rate was a factor of gravity and the density of the sand packed column.
Extraction of diesel from the medium (sand and leachates)
After ten days, the four columns were dismantled one section at a time, and a sand subsample was taken from each section of each column. Total extractable diesel fuel in each subsample was obtained through solvent extraction (DCM![[thin space (1/6-em)]](https://www.rsc.org/images/entities/char_2009.gif) :
:![[thin space (1/6-em)]](https://www.rsc.org/images/entities/char_2009.gif) methanol (9
methanol (9![[thin space (1/6-em)]](https://www.rsc.org/images/entities/char_2009.gif) :
:![[thin space (1/6-em)]](https://www.rsc.org/images/entities/char_2009.gif) 1)) using the ASE300. Since the sand used for the column experiment was initially extracted and baked, it was possible to determine the diesel component of each section of the column gravimetrically.
1)) using the ASE300. Since the sand used for the column experiment was initially extracted and baked, it was possible to determine the diesel component of each section of the column gravimetrically.
The leachate from each column was collected in beakers. Since the aqueous leachates contained diesel fuel hydrocarbons, three with ethanol as a co-solvent, it was necessary to first compare various standard extraction ISO and USEPA methods26–28 to determine the appropriate solvent for most effective diesel fuel recovery. This was achieved by carrying out several back-filtration experiments on ethanol–diesel–water mixtures of known volumes using different solvents and solvent mixtures (such as DCM, n-hexane![[thin space (1/6-em)]](https://www.rsc.org/images/entities/char_2009.gif) :
:![[thin space (1/6-em)]](https://www.rsc.org/images/entities/char_2009.gif) DCM mixtures, etc.). From the results obtained, only the 4
DCM mixtures, etc.). From the results obtained, only the 4![[thin space (1/6-em)]](https://www.rsc.org/images/entities/char_2009.gif) :
:![[thin space (1/6-em)]](https://www.rsc.org/images/entities/char_2009.gif) 1 n-hexane
1 n-hexane![[thin space (1/6-em)]](https://www.rsc.org/images/entities/char_2009.gif) :
:![[thin space (1/6-em)]](https://www.rsc.org/images/entities/char_2009.gif) DCM mixture (a modification of ISO 9377-1 method26) gave almost 100% diesel fuel recovery for a single extraction. This may be attributed to the chemistry of the diesel fuel, as diesel fuel contains a high percentage of n-alkanes which are highly soluble in n-hexane.29 The molecular composition of diesel fuel may make possible the use of an appropriate n-hexane
DCM mixture (a modification of ISO 9377-1 method26) gave almost 100% diesel fuel recovery for a single extraction. This may be attributed to the chemistry of the diesel fuel, as diesel fuel contains a high percentage of n-alkanes which are highly soluble in n-hexane.29 The molecular composition of diesel fuel may make possible the use of an appropriate n-hexane![[thin space (1/6-em)]](https://www.rsc.org/images/entities/char_2009.gif) :
:![[thin space (1/6-em)]](https://www.rsc.org/images/entities/char_2009.gif) DCM mixture without the possible loss of C8 to C13 hydrocarbons during the solvent removal process30 – a common problem with n-hexane alone.26,29 These methods will be examined further with the goal of determining the most effective (more extracts) and most efficient (lower frequency) method for liquid–liquid extraction of diesel–water mixtures. However, repeated extractions using DCM alone gave very similar results to single extraction using the 4
DCM mixture without the possible loss of C8 to C13 hydrocarbons during the solvent removal process30 – a common problem with n-hexane alone.26,29 These methods will be examined further with the goal of determining the most effective (more extracts) and most efficient (lower frequency) method for liquid–liquid extraction of diesel–water mixtures. However, repeated extractions using DCM alone gave very similar results to single extraction using the 4![[thin space (1/6-em)]](https://www.rsc.org/images/entities/char_2009.gif) :
:![[thin space (1/6-em)]](https://www.rsc.org/images/entities/char_2009.gif) 1 n-hexane
1 n-hexane![[thin space (1/6-em)]](https://www.rsc.org/images/entities/char_2009.gif) :
:![[thin space (1/6-em)]](https://www.rsc.org/images/entities/char_2009.gif) DCM mixture. Since this method is already documented in literature, repeated liquid–liquid extraction using DCM was used to isolate diesel fuel hydrocarbons from the aqueous leachates.31,32 This method followed the Environmental Protection Agency (EPA) Method 3510C.28
DCM mixture. Since this method is already documented in literature, repeated liquid–liquid extraction using DCM was used to isolate diesel fuel hydrocarbons from the aqueous leachates.31,32 This method followed the Environmental Protection Agency (EPA) Method 3510C.28
Molecular analysis of the leachates using GC-MS
Molecular analysis of both the pure diesel and the leachates was carried out using gas chromatography-mass spectrometry (GC-MS), following EPA Method 8270D.33 This was carried out using the Pegasus 4D instrument in the Organic Geochemistry laboratory, Macquarie University, Sydney according to the procedure by Flannery and George.34 Samples from each leachate were analysed using a two dimensional gas chromatograph (Agilent 7890A) operating in one dimension, coupled to a Pegasus time-of-flight-mass spectrometer (GCxGC-ToFMS). Fractions (1 μL) were injected through a split/splitless injector operating at 310 °C in splitless mode onto a J&W DB5MS column (60 m × 0.25 mm i.d., 0.25 mm film thickness) coated with modified 5% phenyl 95% methyl silicone, with He as the carrier gas. The temperature programme was: 40 °C (2 min) to 310 °C at 4 °C min−1, then held for 45 min. Peak areas were integrated using LECO Chromatof software.Results and discussion
Leaching of diesel fuel through the column
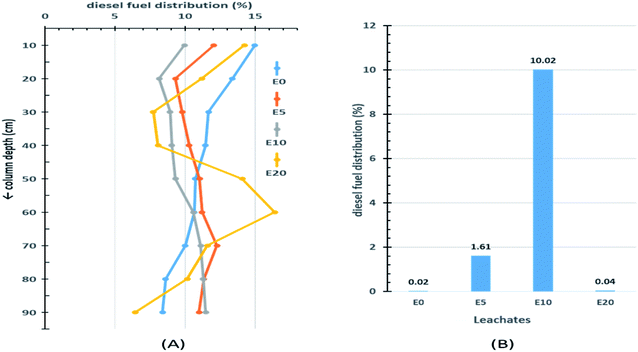
The results from the 90 cm leaching columns indicate that ethanol addition influenced the vertical movement of diesel fuel. Fig. 3A shows the percentage distribution of extractable diesel fuel along the column for the four blends of diesel fuels. The topmost 10 cm sections of each column had higher percentages of diesel fuel than the sections immediately below. This can be explained by the fact that this section is the first point of contact onto which the diesel hydrocarbons would be easily adsorbed. Little migration of diesel fuel was observed in the E0 blend, with the extractable amount decreasing down the column from 15% in the top section to 8.4% at a depth of 90 cm. After the top section, the percentage diesel fuel in the E5 column gradually increased from a low of 9.3% at 20 cm to a maximum of 12.3% at 70 cm depth, after which it gradually decreased again. On the other hand, after the first 10 cm top section, the E10 column experienced a continuous increase in percentage extractable diesel fuel beyond 10 cm, with the peak percentage occurring at 90 cm depth (Fig. 3A). This is a strong indication of the effect of co-solvency on hydrocarbon migration. The E20 blend exhibited an irregular pattern. This can be attributed to the lack of homogeneity in the E20 mixture, which consequently limits co-solvency and thereby reduces the amount of diesel fuel hydrocarbons in the aqueous layer.The effect of ethanol addition on the leaching potential of diesel fuel was more evident when the amount of extractable diesel fuel in each leachate was examined (Fig. 3B). Of the four column leachates, the E10 leachate recorded the highest amount of diesel fuel fraction (10.02%), and the E0 the least (0.02%).
Table 1 gives a brief summary of the percentage distribution of extractable diesel fuel with four depth divisions (x) corresponding to (0–30 cm), (30–60 cm), (60–90 cm) and the leachates. The deeper two divisions (>60 cm) accounted for almost half (44%) of the diesel fraction in the E10 column, 36% in the E5 column, but only 27% and 28% in the E0 and E20 columns, respectively. This is a clear indication of the effect of co-solvency on the leaching potentials of ethanol-blended fuels.
| Column depth (cm) | Percentage distribution | |||
|---|---|---|---|---|
| E0 | E5 | E10 | E20 | |
| 0 ≤ x ≤ 30 | 40.1 | 31.2 | 27.1 | 33.2 |
| 30 < x ≤ 60 | 32.9 | 32.6 | 29.0 | 38.6 |
| 60 < x ≤ 90 | 27.1 | 34.6 | 33.9 | 28.2 |
| Leachates (90 < x) | 0.02 | 1.61 | 10.02 | 0.04 |
Effect of ethanol on vertical migration of petroleum hydrocarbons
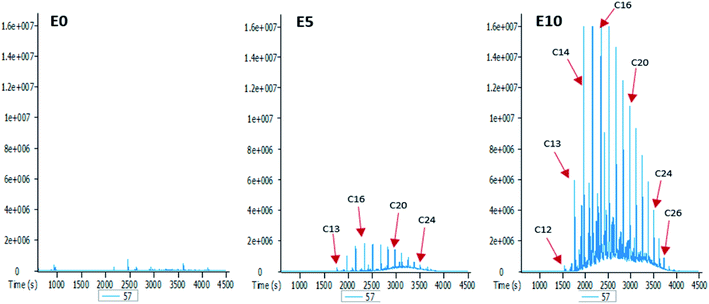
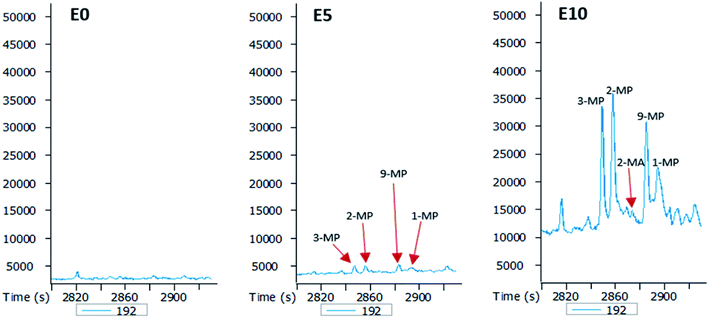
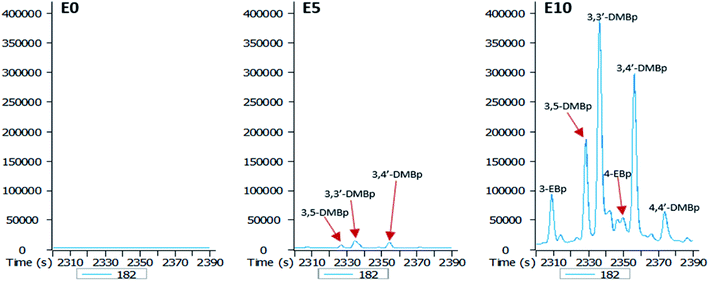
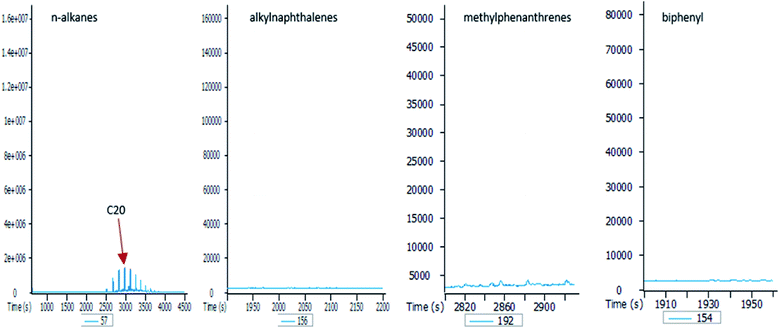
To better understand the effect of ethanol-based co-solvency on the movement of petroleum hydrocarbons, the leachate from each column was examined for the presence of both aliphatic and aromatic hydrocarbons using GC-MS. Fig. 4–8 give an overview of this effect as shown by mass chromatograms selective for n-alkanes (m/z 57) and some aromatic hydrocarbons (C2 alkylnaphthalenes, m/z 156; methylphenanthrenes, m/z 192; biphenyl, m/z 154; C2 alkylbiphenyls, m/z 182) detected in the leachates from each column. These data show that ethanol addition strongly affected the vertical migration of diesel fuel hydrocarbons.The amount of n-alkanes detected in the E0 leachate is very low, but a considerable quantity is present in the E5 leachate, with a maxima at C16 (Fig. 4). More significant was the E10 leachate, in which virtually all the n-alkanes in the diesel fuel were leached by 10% by volume ethanol.
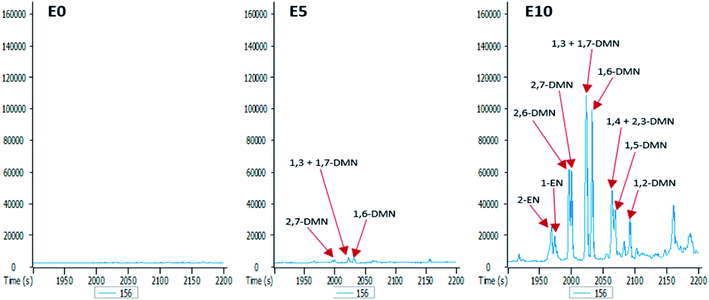
The GC-MS chromatograms of the aromatic hydrocarbons reveal that the effects of ethanol on these were more pronounced in the E10 leachate. For example, no alkylnaphthalene was detected in the E0 leachate (Fig. 5). In the E5 leachate, low concentrations of only 2,7-dimethylnaphalene, co-eluting 1,3- and 1,7-dimethylnaphthalene, and 1,6-dimethylnaphthalene were detected. On the other hand, several alkylnaphthalenes ranging from 2-ethylnaphthalene to 1,2-dimethylnaphthalene were detected in the E10 leachate (Fig. 5). Similarly, whereas methylphenanthrenes were not detected in the E0 leachate (Fig. 6), very limited amounts of all four isomers were detected in the E5 leachate. Conversely, 10% ethanol in diesel (E10) caused considerable leaching of all alkylphenanthrenes including the methylphenanthrenes from beyond the 90 cm column into the leachate (Fig. 6).
An increase in the ethanol content of the diesel fuel led to an increase in the leaching potential of substituted biphenyls (Fig. 7). Ethanol content of the diesel fuel had a differential effect on the amount of ethylbiphenyls and dimethylbiphenyls eluted, with the largest amount of these hydrocarbons present in the E10 leachate (Fig. 7).
Interestingly, a prior study examined the effect of ethanol on the leaching ability of individual hydrocarbons independently, and not in their form as a mixture.23 The current study is the first to use GC-MS to examine the effect of ethanol content on the leaching potentials of diesel fuel hydrocarbons as a complete mixture.
From the results obtained, it is evident that the addition of ethanol to diesel fuel has a direct impact on the leaching potential of diesel fuel hydrocarbons. While 5% by volume of ethanol had a very limited effect on the vertical movement of aromatic hydrocarbons, its effect on aliphatic hydrocarbons are consequential, as shown by the presence of significant amounts of n-alkanes in the E5 leachate (Fig. 4). Therefore, ethanol content had more impact on aliphatic hydrocarbons than it did on aromatic hydrocarbons. This is not unexpected since the solubility of petroleum hydrocarbons under room temperature decreases with increasing molecular weight and aromaticity (high stability).35,36 This also explains why for polycyclic aromatic hydrocarbons (PAHs), the lighter aromatic hydrocarbons such as alkylnaphthalenes (Fig. 5) eluted more efficiently from the column than the heavier ones such as alkylphenanthrenes (Fig. 6). In addition, an increase in diesel fuel ethanol content from 5% to 10% by volume considerably increased the amount of aromatic hydrocarbons that eluted from the columns. This can be seen from the difference between the amounts of the aromatic hydrocarbons eluted from the E5 column and those eluted from the E10 column. This can be explained by the fact that ethanol breaks the surface tension of repellent soil, allowing increasing penetration.23,37 Thus, with increasing ethanol content the co-solvency of these hydrocarbons increases, making them more available in the aqueous phase, and consequently more susceptible to leaching.
In the absence of stabilisers, co-solvency drops when ethanol content exceeds 10% by volume.24,25 This agrees with the results of this study, as shown by the mass chromatograms of the leachate from the E20 column (Fig. 8). This leachate contains some n-alkanes with a higher molecular maxima (C20) than raw diesel, and no aromatic hydrocarbons. This is because solubility of ethanol in petroleum hydrocarbons significantly drops at 20% by volume, thereby creating a biphasic solution with an ethanol phase containing small amounts of hydrocarbons. Since ethanol is the co-solvent for water and hydrocarbons, this immiscibility at 20% ethanol volume is responsible for the observed drop in the hydrocarbon content of the E20 leachates.
Implications for phytotechnologies
Phytotechnology is the direct use of living plants for in situ bioremediation of contaminated environments, such as soils.2,38 As a “green” technology, phytotechnology is one of the important prospects for sustainable development.39 Phytoremediation does not require transportation of contaminated soils and requires less labour, is less expensive and has a lower carbon footprint (based on the amount of CO2 emitted) than traditional techniques of remediation.40 Current rehabilitation costs can total over $1 million per hectare, and some studies have indicated that implementing phytoremediation may result in a cost savings of 50 to 80% over traditional technologies.1However, phytoremediation of hydrocarbons depends primarily on rhizoremediation, which involves the breakdown of contaminants in soil as a result of microbial activity at the roots.41–43 This involves a series of plant–microbe interactions which can have potential negative implications for ethanol-based co-solvency, when petroleum hydrocarbons are leached beyond the rooting zones of plants.
Rhizosphere microorganisms generally live under conditions of “nutrient starvation” and are thus constantly looking for nutrients. The most important nutrient sources excreted by roots are organic acids (citric, malic, succinic, oxalic and pyruvic acid), carbohydrates (glucose, xylose, fructose, maltose, sucrose, ribose), amino acids, fatty acids, proteins, enzymes, nucleotides and vitamins.44–48 Microorganisms have developed sensory systems (chemotaxis) that guide them to these roots-secreted components in order to provide the necessary nutrition and energy for their survival and reproduction.49 As a result, the rhizosphere is up to 100 times richer in microbial density than bulk soil.50–53 This phenomenon is called “the rhizosphere effect”.54–56 Previous studies have shown that the quantity and quality of root exudates are determined by the cultivar, plant species, developmental stage, various environmental factors (soil type, pH, temperature, nutrient availability), and the presence of microorganisms.45,57–61 Thus, root exudates affect not only the microbial population but also its diversity.
Plants and microorganisms have co-evolved so that each can take advantage of their association. In contaminated soil, the contaminant distribution gradient is negatively correlated with the gradient of root exudates, with the lowest hydrocarbon concentration, and the highest root exudate and microbial concentration, mostly at the root tips and at sites of lateral branching.53,60,62–64 Corgié et al.42 reported that phenanthrene biodegradation reached 86% in the first 3 mm from the roots, 48% between 3 and 6 mm, and 36% between 6 and 9 mm. They observed a parallel bacterial gradient, where high numbers of heterotrophs and PAH-degrading bacteria were close to the roots. Similarly, in the rhizosphere of perennial ryegrass (Lolium perenne) growing in a petroleum hydrocarbon contaminated soil, the highest rates of hydrocarbon degradation and the microbial degraders were mainly found within 3 mm of the root surface.65
Plants may directly improve degradation via the root exudation of enzymes, such as laccases, phenol oxidases and peroxidases, which catalyse the oxidation of various hydrocarbons and degrade them into intermediate products.53,62 However, microbial-derived enzymatic breakdown is considered to be the primary pathway for petroleum hydrocarbon degradation.53
Furthermore, many secondary plant metabolites exuded by roots such as flavonoids, are structurally similar to aromatic hydrocarbons.66,67 This structural analogy may improve hydrocarbon degradation by stimulating co-metabolic processes, which involves the oxidation/mineralisation of petroleum hydrocarbons molecules that do not support plant growth, such as benzo-α-pyrene,68 in the presence of other growth supporting root exudates.69,70 Co-metabolism seems to be the primary process underlying degradation of recalcitrant hydrocarbons.18,71
Since most plants employed in phytotechnologies (such as legumes and grasses) possess limited rooting depths with root density decreasing with increasing depth, these results reveal that ethanol addition to diesel fuel will significantly limit the effectiveness of phytoremediation as a reclamation strategy for soils contaminated with ethanol-blended diesel spills. In addition, since soil microbial diversity and population depend on root exudation, the efficiency of rhizodegradation of petroleum hydrocarbons will be negatively affected by enhanced leaching of the hydrocarbons owing to ethanol addition. This will also be the case with other innovative variants of phytotechnologies such as genetically-modified phytoremediation.
In view of the foregoing, it is evident that it is not enough to limit environmental concerns to atmospheric and particulate matter emissions. Energy and environmental policy experts must take a holistic view of energy-related innovations, taking into consideration other potential implications as they relate to other aspects of the environment, in this case, soil and underground water. More so, the effect of such innovations on other sustainable initiatives such as soil contaminant clean-up and restoration should be carefully considered.
Conclusions
Ethanol-blended petroleum fuels are becoming increasingly common and utilised. These fuels are targeted at combating atmospheric pollution, as their oxygenates leave behind lesser carbon footprints. Noble as this may appear, this innovation is not without attendant consequences. This research has demonstrated that the addition of ethanol to diesel fuels can significantly affect the leaching potentials of petroleum hydrocarbons. This effect was seen in both aliphatic and aromatic hydrocarbons. While 5% (by volume) ethanol addition had a limited effect on aromatic hydrocarbons, 10% ethanol addition resulted in the elution of all class of aromatic hydrocarbons studied beyond the 90 cm column. Even the more stable polycyclic aromatic hydrocarbons such as alkylnaphthalenes and alkylphenanthrenes, which are otherwise highly insoluble in water, were eluted through the E10 column. This shows the ability of ethanol to enhance co-solvency of hydrocarbons as well as break the surface tension of repellent soil, allowing increasing penetration. This observation is significant considering the persistence of these classes of hydrocarbons in the environment and their toxicity to humans when these contaminants make their way into the underground water table.The analyses presented in this paper highlight potential implications for the successes of phytotechnologies. Since phytoremediation of hydrocarbons depends largely on rhizodegradation of contaminants by the root-associated microbiome, the leaching of petroleum hydrocarbons beyond the rooting zones of plant will definitely limit the effectiveness of this approach as a reclamation strategy for ethanol-blended diesel spills. Thus, it is imperative that energy scientists and policy makers carefully consider the resultant environmental impacts of ethanol-blended innovations holistically.
Conflicts of interest
There are no conflicts to declare.Acknowledgements
The authors would like to thank the Commonwealth Government of Australia and Macquarie University for supporting this research project by providing an international Research Training Program (iRTP) scholarship to ME (allocation number: 2017561). This research was conducted in the Organic Geochemistry Laboratory, Department of Earth and Environmental Sciences, and MQ Marine Research Centre, Macquarie University, Sydney, the support of which is gratefully acknowledged.References
- USEPA, EPA 542-R-01-006, 2001.
- USEPA, EPA/600/R-99/107, 2000.
- T. Dalton and D. Jin, Mar. Pollut. Bull., 2010, 60, 1939–1945 CrossRef CAS PubMed.
- X. Hong, W. Chen and L. Zhang, Procedia Environ. Sci., 2010, 2, 49–56 CrossRef.
- B. Hassler, in Environmental Governance of the Baltic Sea, ed. M. Gilek, M. Karlsson, S. Linke and K. Smolarz, Springer International Publishing, Cham, 2016, pp. 125–146, DOI:10.1007/978-3-319-27006-7_6.
- S. D. Cunningham, W. R. Berti and J. W. Huang, Trends Biotechnol., 1995, 13, 393–397 CrossRef CAS.
- T. Macek, M. Macková and J. Káš, Biotechnol. Adv., 2000, 18, 23–34 CrossRef CAS PubMed.
- M. McGuinness and D. Dowling, Int. J. Environ. Res. Public Health, 2009, 6, 2226–2247 CrossRef CAS PubMed.
- N. Weyens, D. van der Lelie, S. Taghavi and J. Vangronsveld, Curr. Opin. Biotechnol., 2009, 20, 248–254 CrossRef CAS PubMed.
- B. R. Glick, Biotechnol. Adv., 2003, 21, 383–393 CrossRef CAS PubMed.
- M. Mench, J. Vangronsveld, P. Bleeker, A. Ruttens, W. Geebelen and N. Lepp, in Phytoremediation of Metal-Contaminated Soils, ed. J.-L. Morel, G. Echevarria and N. Goncharova, Springer Netherland, Dordrecht, 2006, pp. 109–190 Search PubMed.
- E. A. H. Pilon-Smits and J. L. Freeman, Front Ecol. Environ., 2006, 4, 203–210 CrossRef.
- W. H. O. Ernst, Geochemistry, 2005, 65, 29–42 CrossRef CAS.
- C. C. Azubuike, C. B. Chikere and G. C. Okpokwasili, World J. Microbiol. Biotechnol., 2016, 32, 180 CrossRef PubMed.
- J. H. Lee, Biotechnol. Bioprocess Eng., 2013, 18, 431–439 CrossRef CAS.
- Z. Wang, Y. Xu, J. Zhao, F. Li, D. Gao and B. Xing, J. Hazard. Mater., 2011, 190, 677–685 CrossRef CAS PubMed.
- R. B. Meagher, Curr. Opin. Plant Biol., 2000, 3, 153–162 CrossRef CAS PubMed.
- I. Kuiper, E. L. Lagendijk, G. V. Bloemberg and B. J. J. Lugtenberg, Mol. Plant-Microbe Interact., 2004, 17, 6–15 CrossRef CAS PubMed.
- M. O. Mendez and R. M. Maier, Rev. Environ. Sci. Bio/Technol., 2008, 7, 47–59 CrossRef CAS.
- B. Van Aken, Curr. Opin. Biotechnol., 2009, 20, 231–236 CrossRef CAS PubMed.
- H. Ali, E. Khan and M. A. Sajad, Chemosphere, 2013, 91, 869–881 CrossRef CAS PubMed.
- M. Mench, J.-P. Schwitzguébel, P. Schroeder, V. Bert, S. Gawronski and S. Gupta, Environ. Sci. Pollut. Res., 2009, 16, 876 CrossRef CAS PubMed.
- G. Adam, K. Gamoh, D. G. Morris and H. Duncan, Sci. Total Environ., 2002, 286, 15–25 CrossRef CAS PubMed.
- K. R. Gerdes and G. J. Suppes, Ind. Eng. Chem. Res., 2001, 40, 949–956 CrossRef CAS.
- M. Lapuerta, O. Armas and R. García-Contreras, Fuel, 2007, 86, 1351–1357 CrossRef CAS.
- ISO:9377-1, 2000.
- ISO:9377-2, 2000.
- USEPA, Method 3510C, 1996.
- USEPA, Method 1664, Revision B, 2010.
- M. Ahmed and S. C. George, Org. Geochem., 2004, 35, 137–155 CrossRef CAS.
- I. A. Al-Baldawi, S. R. S. Abdullah, N. Anuar, F. Suja and I. Mushrifah, Ecol. Eng., 2015, 74, 463–473 CrossRef.
- A. Lohi, M. Alvarez Cuenca, G. Anania, S. R. Upreti and L. Wan, J. Hazard. Mater., 2008, 154, 105–111 CrossRef CAS PubMed.
- USEPA, Method 8270D, 1998.
- E. N. Flannery and S. C. George, Org. Geochem., 2014, 77, 115–125 CrossRef CAS.
- L. C. Price, J. Pet. Geol., 1981, 4, 195–223 CrossRef CAS.
- M. C. Davis, P. W. Fedick, D. V. Lupton, G. S. Ostrom, R. Quintana and J.-D. Woodroffe, RSC Adv., 2019, 9, 22891–22899 RSC.
- P. M. King, Soil Res., 1981, 19, 275–285 CrossRef.
- E. Pilon-Smits, Annu. Rev. Plant Biol., 2005, 56, 15–39 CrossRef CAS PubMed.
- D. E. Salt, R. D. Smith and I. Raskin, Annu. Rev. Plant Physiol. Plant Mol. Biol., 1998, 49, 643–668 CrossRef CAS PubMed.
- N. Das and P. Chandran, Biotechnol. Res. Int., 2011, 1–13 Search PubMed.
- F. Rohrbacher and M. St-Arnaud, Agronomy, 2016, 6, 1–27 CrossRef.
- S. C. Corgié, E. J. Joner and C. Leyval, Plant Soil, 2003, 257, 143–150 CrossRef.
- Y. Yang, D. Ratté, B. F. Smets, J. J. Pignatello and D. Grasso, Chemosphere, 2001, 43, 1013–1021 CrossRef CAS PubMed.
- C. Bertin, X. Yang and L. A. Weston, Plant Soil, 2003, 256, 67–83 CrossRef CAS.
- D. V. Badri and J. M. Vivanco, Plant Cell Environ., 2009, 32, 666–681 CrossRef CAS.
- L. Lioussanne, M. Jolicoeur and M. St-Arnaud, Soil Biol. Biochem., 2008, 40, 2217–2224 CrossRef CAS.
- K. Narasimhan, C. Basheer, V. B. Bajic and S. Swarup, Plant Physiol., 2003, 132, 146 CrossRef CAS PubMed.
- B. Lugtenberg, in Principles of Plant-Microbe Interactions: Microbes for Sustainable Agriculture, ed. B. Lugtenberg, Springer International Publishing, Cham, 2015, pp. 7–15, DOI:10.1007/978-3-319-08575-3_3.
- E. J. Joner and C. Leyval, Environ. Sci. Technol., 2003, 37, 2371–2375 CrossRef CAS PubMed.
- J. M. Lynch and J. M. Whipps, Plant Soil, 1990, 129, 1–10 CrossRef CAS.
- L. Marilley and M. Aragno, Appl. Soil Ecol., 1999, 13, 127–136 CrossRef.
- G. A. Kowalchuk, D. S. Buma, W. de Boer, P. G. L. Klinkhamer and J. A. van Veen, Antonie van Leeuwenhoek, 2002, 81, 509 CrossRef PubMed.
- B. C. Martin, S. J. George, C. A. Price, M. H. Ryan and M. Tibbett, Sci. Total Environ., 2014, 472, 642–653 CrossRef CAS PubMed.
- W. Cheng and D. C. Coleman, Soil Biol. Biochem., 1990, 22, 781–787 CrossRef.
- T. A. Anderson, E. A. Guthrie and B. T. Walton, Environ. Sci. Technol., 1993, 27, 2630–2636 CrossRef CAS.
- M. Nie, Q. Yang, L.-F. Jiang, C.-M. Fang, J.-K. Chen and B. Li, Biol. Lett., 2010, 6, 811–814 CrossRef CAS PubMed.
- A. Gransee and L. Wittenmayer, J. Plant Nutr. Soil Sci., 2000, 163, 381–385 CrossRef CAS.
- B. W. Hütsch, J. Augustin and W. Merbach, J. Plant Nutr. Soil Sci., 2002, 165, 397–407 CrossRef.
- M. B. Leigh, J. S. Fletcher, X. Fu and F. J. Schmitz, Environ. Sci. Technol., 2002, 36, 1579–1583 CrossRef CAS PubMed.
- G. Neumann, in Nutrient Cycling in Terrestrial Ecosystems, ed. P. Marschner and Z. Rengel, Springer Berlin Heidelberg, Berlin, Heidelberg, 2007, pp. 123–157, DOI:10.1007/978-3-540-68027-7_5.
- K. Xue, L. Wu, Y. Deng, Z. He, J. Van Nostrand, P. G. Robertson, T. M. Schmidt and J. Zhou, Appl. Environ. Microbiol., 2013, 79, 1284 CrossRef CAS PubMed.
- Y. Gao, Y. Yang, W. Ling, H. Kong and X. Zhu, Soil Sci. Soc. Am. J., 2011, 75, 1694–1703 CrossRef CAS.
- P. Marschner, D. Crowley and Z. Rengel, Soil Biol. Biochem., 2011, 43, 883–894 CrossRef CAS.
- W. Ling, H. Dang and J. Liu, J. Soils Sediments, 2013, 13, 677–685 CrossRef CAS.
- S. C. Corgié, T. Beguiristain and C. Leyval, Appl. Environ. Microbiol., 2004, 70, 3552 CrossRef PubMed.
- A. C. Singer, in Phytoremediation Rhizoremediation, ed. M. Mackova, D. Dowling and T. Macek, Springer Netherlands, Dordrecht, 2006, pp. 5–21, DOI:10.1007/978-1-4020-4999-4_2.
- H. P. Bais, C. D. Broeckling and J. M. Vivanco, in Secondary Metabolites in Soil Ecology, ed. P. Karlovsky, Springer Berlin Heidelberg, Berlin, Heidelberg, 2008, pp. 241–252, DOI:10.1007/978-3-540-74543-3_11.
- R. A. Kanaly and R. Bartha, Environ. Toxicol. Chem., 1999, 18, 2186–2190 CAS.
- J. S. Fletcher and R. S. Hegde, Chemosphere, 1995, 31, 3009–3016 CrossRef CAS.
- E. Yergeau, S. Sanschagrin, C. Maynard, M. St-Arnaud and C. W. Greer, ISME J., 2014, 8, 344–358 CrossRef CAS PubMed.
- S. D. Cunningham and W. R. Berti, In Vitro Cell. Dev. Biol.: Plant, 1993, 29, 207–212 CrossRef.
| This journal is © The Royal Society of Chemistry 2020 |

