 Open Access Article
Comparison of the oxidation of halogenated phenols in UV/PDS and UV/H2O2 advanced oxidation processes†
Junxin Liu,
Yongze Liu,
Yajun Tian,
Li Feng* and
Liqiu Zhang *
*
Beijing Key Laboratory for Source Control Technology of Water Pollution, Engineering Research Center for Water Pollution Source Control and Eco-remediation, Beijing Forestry University, Beijing 100083, China. E-mail: fengli_hit@163.com
First published on 11th February 2020
Abstract
UV/peroxydisulfate (PDS) and UV/hydrogen peroxide (H2O2) can effectively degrade halophenols (HPs, e.g., 2,4-bromophenol and 2,4,6-trichlorophenol); meanwhile, information about the discrepancies in the related degradation kinetics and mechanisms of these two processes is limited. To gain this knowledge, the degradation of two typical HPs (i.e., bromophenols and chlorophenols) in UV/PDS and UV/H2O2 processes were investigated and compared. The results showed that the degradation rates of HPs with different substitution positions in the UV/PDS process were in the order of para-substituted HPs (i.e., 4-BP and 4-CP) > ortho-substituted HPs (i.e., 2-BP and 2-CP) > meta-substituted HPs (i.e., 3-BP and 3-CP), while in the UV/H2O2 process, these rates were in the order of para-substituted HPs > meta-substituted HPs > ortho-substituted HPs. These discrepancies were ascribed to the different reaction activities of SO4˙− and HO˙ with HPs, which were calculated based on the competition method. Further density functional theory (DFT) calculations suggested that SO4˙− reacts more readily with HPs via electron transfer than HO˙. In the presence of water matrices (such as Cl−, HCO3− and natural organic matter (NOM)), the degradation of 2-BP in both UV/PDS and UV/H2O2 treatment processes was inhibited due to the scavenging of free radicals by these background substances. The degradation products and pathways further confirmed that SO4˙− is a strong one-electron oxidant that reacts with HPs mainly via electron transfer, while HO˙ reacts with HPs via electron transfer and hydroxyl addition.
1. Introduction
Halogenated phenols (HPs) are typical halogenated compounds that have received increasing attention in recent years due to their potential hazards to water environments and human health.1,2 Halogenated compounds have been widely used as brominated flame retardants, refrigerants, preservatives, etc.3,4 With the high production and usage of halogenated compounds, large amounts of HPs (e.g., bromophenols (BPs) and chlorophenols (CPs)) are released from those compounds and discharged into water environments.5,6 HPs have been reported to be frequently detected in surface water environments at the ng L−1 to μg L−1 level.7,8 The wide occurrence of HPs in water environments aggravates their environmental risk to ecosystems. Toxicological studies indicate that frequent exposure to HPs may result in injury to the skin, eyes and upper respiratory tract of humans to varying degrees.9,10 Therefore, it is imperative to develop more effective technologies to remove these HPs from contaminated water environments.Many HPs are recalcitrant contaminants, which are resistant to conventional biological and physico-chemical methods.11–13 In recent years, UV-based advanced oxidation processes (AOPs) have been widely applied to degrade refractory organic pollutants through oxidizing agents such as H2O2.14,15 The photolysis of H2O2 can generate hydroxyl radicals (HO˙, redox potential 2.73 V).16 Persistent organic pollutants (e.g., phenol, azo dyes and some pharmaceuticals) were reported to be degraded in the UV/H2O2 process via HO˙ oxidation.17 The formed HO˙ was demonstrated to have a fast reaction rate with HPs (k = 108 to 1010 M−1 s−1).18 Recently, the activation of peroxydisulfate (PDS) via UV photolysis has also been widely studied and applied in wastewater treatment.19 The sulfate radical (SO4˙−) generated in the UV/PDS process was demonstrated to be a strong oxidative radical with a redox potential of 2.60 V.16,20 Compared with HO˙-based AOPs, SO4˙− can react more rapidly with organic pollutants via electrophilic reactions.21 SO4˙−-based AOPs have also been proved to have the ability to remove HPs with a removal rate of 80–100% after 30 minutes of reaction.22 In a word, both HO˙- and SO4˙−-based AOPs can degrade HPs effectively. However, in most literature reports focused on the degradation efficiencies of HPs in UV/PDS and UV/H2O2 processes, the discrepancies in HP degradation between UV/PDS and UV/H2O2 are not systematically researched. Furthermore, information about the degradation differences of HPs by the above two types of free radicals, especially the difference in the oxidized active sites of HO˙ and SO4˙−, is limited.
In this study, to investigate the difference in the active sites of HPs between HO˙ oxidation and SO4˙− oxidation and to gain more thorough knowledge about the reaction mechanisms of HO˙ and SO4˙− oxidation, three bromophenols (BPs, 2-, 3-, and 4-BP) and three chlorophenols (CPs, 2-, 3-, and 4-CP) were selected as the target HPs. Firstly, the degradation kinetics of the HPs in UV/PDS and UV/H2O2 processes were comparatively examined; then, the active sites of the HPs were revealed based on density functional theory (DFT). In addition, the effects of the background matrix (such as pH, Cl−, HCO3−, and NOM) on the degradation behaviors in UV/PDS and UV/H2O2 were evaluated. Furthermore, the degradation products and pathways of HPs in both processes were proposed.
2. Materials and methods
2.1. Chemicals
BPs (2-, 3-, and 4-BP, 98%) and CPs (2-, 3-, and 4-CP, 98%) were obtained from Macklin Biochemical Co. Ltd., (Shanghai, China). Potassium peroxodisulfate (K2S2O8, 99%) and tert-butyl-alcohol (TBA, 99%) were obtained from Macklin Biochemical Co., LTD. (USA). H2O2 solution (35% w/w), sodium hydrogen carbonate (NaHCO3, analytical grade), sodium chloride (NaCl, analytical grade) and potassium dihydrogen phosphate (KH2PO4, analytical grade) were acquired from Beijing Chemical Reagent Co. Ltd. (Beijing, China). Perchloric acid (HClO4, 72%) and benzoic acid (BA, 99%) were obtained from Xilong Chemical Co., Ltd., China. Acetonitrile (99.9%) and methanol (99.9%) were of chromatographic grade (J.T. Baker Inc., USA). The standard NOM was acquired from the International Humic Substances Society (IHSS), where the NOM was extracted from the Suwannee River. The stock solution of NOM was obtained via stirring the solid in pure water for 48 h; then, the solution was centrifuged and the supernatant was filtered through 0.45 μm mixed cellulose ester membrane. The concentration of the total organic carbon (TOC) of the stock solution was measured with a TOC analyzer. The ultrapure water (>18.2 Ω m) used in this study was prepared using a water purification system (Cascada TM LS). All the chemical reagents used in the experiment were analytical grade or above.2.2. Experimental procedures
The experiments were performed in a 100 mL cylindrical vessel reactor (diam. 50 mm) equipped with four low-pressure mercury ultraviolet (UV) lamps (GPH 212T5L/4, 10 W, Heraeus) emitting at 254 nm. The UV lamps were placed 30 cm above the cylindrical vessel reactor. The UV incident intensity (I0, 253.7 nm) was determined to be 6.82 × 10⁻⁸ einstein per L per s via iodine–iodide spectrophotometry;23 the optical path length of the reactor was 4 cm. The experimental solutions contained the target pollutant (10 μM) and PDS or H2O2 (0.5 mM). The pH value of the experimental solution was maintained at 7.0 with 10 mM phosphate buffer, and all experiments were performed at room temperature (25 ± 1 °C).During the UV irradiation (30 min), 1.5 mL samples were withdrawn every five minutes (0, 5, 10, 15, 20, 25, 30 min). The samples were filtrated using 0.22 μm membranes (polyether sulfone, diam. 13 mm), and excess methanol was added to quench SO4˙− and HO˙. Then, the concentrations of the target contaminants were detected using high-performance liquid chromatography (HPLC). All of the experiments were carried out three times, and the results were averaged. All of the standard deviations were less than 5%.
In the competitive kinetics experiment, BA (10 μM) and HPs were added to the reaction system at the same time, and the second-order reaction rate constant was calculated by the competitive degradation kinetics during the UV/H2O2 process. TBA (10 mM) was added to the UV/PDS system to capture HO˙ to create a single SO4˙− system.
2-BP (pKa = 8.45) was selected to further investigate the effects of pH and the background matrix (i.e., Cl−, HCO3− and NOM) on the HP degradation behavior in UV/PDS and UV/H2O2. The reaction solution pH was adjusted to different levels (i.e., 4.0, 5.0, 6.0, 7.0 and 8.0) with perchloric acid and sodium hydroxide before irradiation to explore the effects of pH on the HP degradation. Specific volumes of stock Cl−, HCO3− and NOM solutions were added to the reaction solution to obtain different concentrations of Cl− (1, 5, 10, 100 and 500 mM), HCO3− (1 and 5 mM) and NOM (1, 5 and 10 mgC L−1) to study the influence of the water matrices on the HP degradation.
In order to analyze the degradation products, the concentration of 2-BP was increased to 1 mM. Accordingly, the concentrations of PDS and H2O2 were also increased to 20 mM. The pH of the solutions was still maintained at 7.0. The samples (30 mL) were withdrawn after UV irradiation at 0, 15 and 30 min, respectively. Then, the samples were concentrated via solid-phase extraction and examined by liquid chromatography-tandem mass spectrometry (LC-MS/MS).
2.3. Analytical methods
The concentrations of BPs and CPs were determined using an HPLC (HPLC1260, Agilent, USA) equipped with a UV detector. A Poroshell 120 EC-C18 column (4.6 × 50 mm, 2.7 μm, Agilent, USA) was employed, and the column was maintained at 30 °C with a flow rate of 0.5 mL min−1. The mobile phase consisted of water/acetonitrile (50![[thin space (1/6-em)]](https://www.rsc.org/images/entities/char_2009.gif) :
:![[thin space (1/6-em)]](https://www.rsc.org/images/entities/char_2009.gif) 50, v/v%) for 2-BP, 2-CP, 3-BP and 3-CP and water/acetonitrile (45
50, v/v%) for 2-BP, 2-CP, 3-BP and 3-CP and water/acetonitrile (45![[thin space (1/6-em)]](https://www.rsc.org/images/entities/char_2009.gif) :
:![[thin space (1/6-em)]](https://www.rsc.org/images/entities/char_2009.gif) 55, v/v%) for 4-BP and 4-CP. All of the target compounds were detected at 280 nm. The concentration of NOM was analyzed by a TOC analyzer (Analytic Jena TOC-multiN/C 3100, Japan).
55, v/v%) for 4-BP and 4-CP. All of the target compounds were detected at 280 nm. The concentration of NOM was analyzed by a TOC analyzer (Analytic Jena TOC-multiN/C 3100, Japan).
The degradation products of 2-BP were analyzed by liquid chromatography-tandem mass spectrometry (LC-MS/MS). Chromatography was performed using a Waters BEH C18 (1.7 μM × 100 mm) column. The details of the test method are provided in Text S2.†
2.4. Analytical methods
In order to compare the degradation mechanisms of HPs with different positions of substituted halogens in UV/PDS and UV/H2O2 treatment processes, the highest occupied molecular orbitals and lowest occupied molecular orbitals (HOMO and LUMO) were calculated. Firstly, the geometries of the HPs were optimized with DFT based on B3LYP/6-311 (d,p) using Gaussian 09 software. Then, the HOMO/LUMO energies were further calculated with Multiwfn.243. Results and discussion
3.1. Degradation kinetics of BPs and CPs in the UV/PDS and UV/H2O2 processes
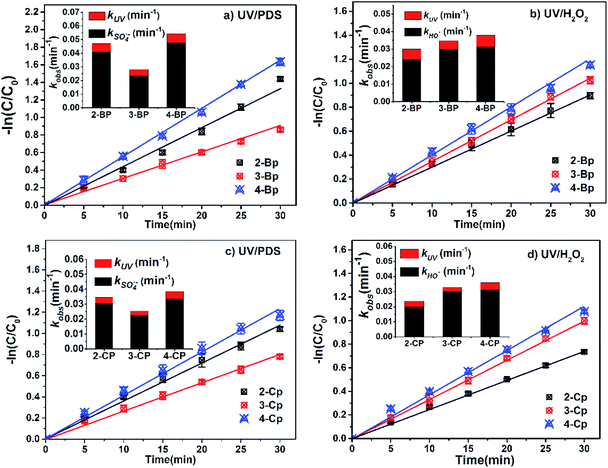
The degradation of different BPs and CPs in the UV/PDS and UV/H2O2 treatment processes followed first-order kinetics, as compared in Fig. 1a–d. In the UV/PDS process (Fig. 1a and c), the observed rate constants (i.e., kobs) of 2-BP, 3-BP, 4-BP, 2-CP, 3-CP, and 4-CP were calculated to be 0.0471 min−1, 0.0282 min−1, 0.0542 min−1, 0.0345 min−1, 0.0255 min−1 and 0.0386 min−1, respectively. In the UV/H2O2 system (Fig. 1b and d), the kobs of 2-BP, 3 BP, 4-BP, 2-CP, 3-CP, and 4-CP were calculated as 0.0301 min−1, 0.0348 min−1, 0.0379 min−1, 0.0238 min−1, 0.0330 min−1 and 0.0360 min−1, respectively.The HPs were degraded by direct photodegradation to a certain extent under UV irradiation (Fig. S1†); therefore, the observed rate constants (kobs) for degradation of the HPs comprised those of direct photolysis (kUV) and oxidation by radicals (kradicals), as described in eqn (1).25
| kobs = S × kUV + kradicals | (1) |
It can be seen that the kobs of the HPs with different substitution positions in UV/PDS were in the order of para-substituted HPs (i.e., 4-BP and 4-CP) > ortho-substituted HPs (i.e., 2-BP and 2-CP) > meta-substituted HPs (i.e., 3-BP and 3-CP). The kobs of the HPs in the UV/H2O2 process were in the order of para-substituted HPs (i.e., 4-BP and 4-CP) > meta-substituted HPs (i.e., 3-BP and 3-CP) > ortho-substituted HPs (i.e., 2-BP and 2-CP), which is inconsistent with the order of the UV/PDS process.
In general, SO4˙− is the main active radical in the UV/PDS process, while the main active specie in the UV/H2O2 process is HO˙.26 Thus, in order to further investigate the differences in the degradation of HPs with different substitution positions, the second-order reaction rate constants of the six target HPs with SO4˙− and HO˙ were calculated by competition kinetics. BA was employed to carry out the competition kinetics experiments due to its negligible photolysis under UV irradiation, and TBA was employed to quench HO˙ in the UV/PDS process to obtain single SO4˙− oxidation. The second-order reaction rate constants of BPs with SO4˙− and HO˙ were calculated via eqn (2) and (3); here, the second-order reaction rate constants of BA with SO4˙− (kSO4˙−,BA) and HO˙ (kOH˙,BA) were reported to be 1.20 × 10⁹ M−1 s−1 and 5.90 × 10⁹ M−1 s−1, respectively.27
 | (2) |
 | (3) |
The calculated second-order reaction rate constants of BPs and CPs with SO4˙− and HO˙ are given in Table 1. The kSO4˙−,BP values were in the order of para-substituted HPs (i.e., 4-BP and 4-CP) > ortho-substituted HPs (i.e., 2-BP and 2-CP) > meta-substituted HPs (i.e., 3-BP and 3-CP). The kOH˙,HP values were in the order of para-substituted HPs (i.e., 4-BP and 4-CP) > meta-substituted HPs (i.e., 3-BP and 3-CP) > ortho-substituted HPs (i.e., 2-BP and 2-CP). Therefore, the different degradation rates of HPs with different substitution positions in the UV/PDS and UV/H2O2 processes can be attributed to their different reactivities with SO4˙− and HO˙.
| Compound | SO4˙− (M−1 s−1) | HO˙ (M−1 s−1) |
|---|---|---|
| 2-BP | 2.74 × 10⁹ | 3.93 × 10⁹ |
| 3-BP | 2.70 × 10⁹ | 5.81 × 10⁹ |
| 4-BP | 3.84 × 10⁹ | 5.94 × 10⁹ |
| 2-CP | 2.58 × 10⁹ | 4.19 × 10⁹ |
| 3-CP | 2.16 × 10⁹ | 5.01 × 10⁹ |
| 4-CP | 3.37 × 10⁹ | 6.84 × 10⁹ |
Frontier orbital theory is usually used to explain the mechanisms of radical reactions.28,29 In this study, quantum chemical calculations based on DFT were introduced to explain the differences in HP degradation between the UV/PDS and UV/H2O2 processes. According to the DFT calculations (Table 2), the HOMO energies of 2-BP, 3-BP, 4-BP, 2-CP, 3-CP, and 4-CP were determined to be −6.617243, −6.662641, −6.433939, −6.726734, −6.748275, and −6.577766 eV, respectively. The absolute values of the HOMO were in the order of 4-BP < 2-BP < 3-BP and 4-CP < 2-CP < 3-CP. Based on previous reports that a lower absolute value of the HOMO represents higher electrophilic reactivity,30 these results suggest that the electrophilic reactivities are in the order of 4-BP < 2-BP < 3-BP and 4-CP < 2-CP < 3-CP. This indicates that electrophilic reactions are most likely to occur at the para halogen atom of the HPs due to its highest charge density (i.e., lowest absolute value of the HOMO). It should be noted that the order of electrophilic reactivity was also consistent with that of the second order rate constants of SO4˙− with the BPs/CPs, confirming that the reactions of the BPs/CPs with SO4˙− mainly occur via electron transfer. However, in the case of HO˙, the order of the second order rate constants of the BPs/CPs with HO˙ were not all in agreement with that of the electrophilic reactivity of the BPs/CPs. This is because in addition to the electron transfer reaction, HO˙ is prone to oxidize via H-abstraction and addition reactions.21 In addition, it can be seen from Table 1 that the second-order reaction rate constants of the HPs and HO˙ were greater than those of the HPs with SO4˙−. This is likely due to the faster H-abstraction reaction of HO˙ than of SO4˙−. It has been reported that the H-abstraction reaction of HO˙ is 1 to 2 orders of magnitude faster than that of SO4˙−.21
| Compound | HOMO energy (eV) | LUMO energy (eV) |
|---|---|---|
| 2-BP | −6.617243 | −0.722943 |
| 3-BP | −6.662641 | −0.750628 |
| 4-BP | −6.433939 | −0.839727 |
| 2-CP | −6.726734 | −0.758318 |
| 3-CP | −6.748275 | −0.788026 |
| 4-CP | −6.577766 | −0.843039 |
3.2. Effects of pH on the degradation of 2-BP
As shown in Fig. 2, with increasing pH from 4.0 to 8.0, the kobs of 2-BP in both the UV/PDS and UV/H2O2 processes decreased firstly from pH 4.0 to 5.0 and then increased from pH 6.0 to 8.0. The degradation efficiencies of 2-BP in both processes were the highest at pH 8.0.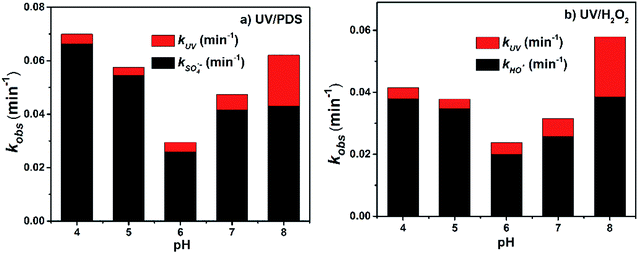 | ||
| Fig. 2 Effects of pH on the degradation of 2-BP in UV/PDS and UV/H2O2 processes. Experimental conditions: [2-BP] = 10 μM; 10 mM phosphate buffer; [PDS] = [H2O2] = 0.5 mM. | ||
This is because as the pH value of the solution increased (6.0 to 8.0), the deprotonation specie of 2-BP (pKa = 8.45) was enhanced, and the ionic 2-BP was more readily oxidized, resulting in the increase of kobs.18 In addition, as shown in Fig. 2, the direct photolysis of 2-BP is weak under acidic and neutral conditions; meanwhile, it is significant under alkaline conditions because the dissociated phenolate is more electron-rich when formed at higher pH values. When the pH decreased from 6.0 to 4.0, the kobs of 2-BP increased gradually; this is mainly due to the increased yields of the two free radicals with increasing acidity of the solution.31
In addition, phosphate buffer was employed to control the pH in these experiments; the concentration of HPO42− in the buffer increased gradually while the concentration of H2PO4− decreased with increasing pH, and the ability of HPO42− to capture free radicals was higher than that of H2PO4− (i.e., k′′ of HPO42− with SO4˙− and HO˙, H2PO4− with SO4˙− and HO˙: 1.2 × 10⁶ M−1 s−1, 1.5 × 10⁵ M−1 s−1, 7.2 × 10⁴ M−1 s−1 and 2.0 × 10⁴ M−1 s−1, respectively (eqn (4) to (7))).27 Therefore, the change of the pH value may change some ion concentrations (e.g., HPO42− and HPO4−) and influence the steady-state concentrations of free radicals, which further impacts the degradation of HPs in the UV/PDS and UV/H2O2 processes.
| SO4˙− + H2PO4− → products, k = 7.2 × 10⁴ M−1 s−1 | (4) |
| SO4˙− + HPO42− → SO42− + HPO4−, k = 1.2 × 10⁶ M−1 s−1 | (5) |
| HO˙ + H2PO4− → H2O + HPO4˙−, k = 2.0 × 10⁴ M−1 s−1 | (6) |
| HO˙ + HPO42− → OH− + HPO4˙−, k = 1.5 × 10⁵ M−1 s−1 | (7) |
3.3. Effects of Cl− on 2-BP degradation
The concentration of Cl− ranges from 0.5 to 500 mM in different natural waters (e.g., freshwater, surface water, groundwater and seawater),32,33 and the influences of Cl− (1, 5, 10, 100 and 500 mM) on the efficiency of 2-BP degradation in the UV/PDS and UV/H2O2 systems were investigated in this study.As shown in Fig. 3, the degradation of 2-BP was inhibited when Cl− increased from 1 mM to 100 mM in UV/PDS; however, when the concentration of Cl− increased to 500 mM, the degradation rate of 2-BP was slightly enhanced. However, in the UV/H2O2 process, the presence of Cl− always had a slight inhibitory effect on the degradation of 2-BP, and the inhibition degree almost did not vary with changing Cl− concentration.
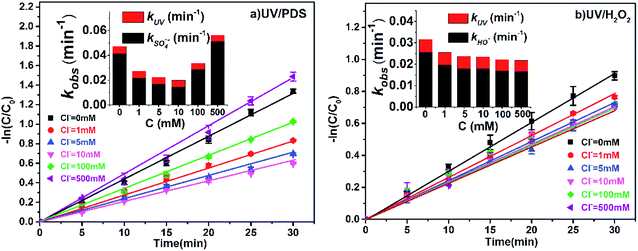 | ||
| Fig. 3 Effects of Cl− on the degradation of 2-BP in UV/PDS and UV/H2O2 processes. Experimental conditions: [2-BP] = 10 μM; 10 mM phosphate buffer (pH 7.0); [PDS] = [H2O2] = 0.5 mM. | ||
With changing Cl− concentration, the direct photodegradation of 2-BP was almost unchanged; therefore, the variation of kobs was mainly due to the effects of Cl− on the oxidation of 2-BP by free radicals. When the concentration of Cl− is low (≤10 mM), Cl− will be converted by sulfate radical into Cl˙ with weak capability of oxidizing 2-BP,34 thus inhibiting the degradation of 2-BP (eqn (8)).35,36 With further increase of the Cl− concentration (≥100 mM), the Cl− in the reaction system can be converted into HOCl with stronger oxidation through a series of reactions (eqn (9) to (12));37 therefore, the degradation of 2-BP is enhanced.38 In addition, compared with the UV/PDS process, the inhibition effects of Cl− on the degradation of 2-BP are weak in the UV/H2O2 process. Because the reaction between Cl˙ and HO˙ is reversible, the addition of Cl− has no significant effect on the concentration of HO˙.
| Cl− + SO4˙− → SO4− + Cl˙, k = 3.0 × 10⁸ M−1 s−1 | (8) |
| Cl− + Cl˙ → Cl2˙−, k = 8.5 × 10⁹ M−1 s−1 | (9) |
| Cl2˙− + Cl2˙− → Cl2 + 2Cl−, k = 9.0 × 10⁸ M−1 s−1 | (10) |
| Cl2˙− + Cl˙ → Cl2 + Cl−, k = 2.1 × 10⁹ M−1 s−1 | (11) |
| Cl2 + H2O → Cl− + HOCl + H+, k = 15 M−1 s−1 | (12) |
3.4. Effects of HCO3− on the degradation of 2-BP
Bicarbonate is very common in natural water, with concentrations ranging from 0.4 to 4.4 mM.33,39 The influence of HCO3− on the degradation efficiency of 2-BP in UV/PDS and UV/H2O2 was also explored (Fig. 4). The kobs of 2-BP declined from 0.0264 to 0.0173 min−1 with increasing HCO3− concentration (1 mM to 5 mM) in the UV/PDS process and declined from 0.0206 to 0.0179 min−1 in the UV/H2O2 process. The presence of bicarbonate had little effect on the direct photodegradation of 2-BP; therefore, the main reason for the decrease of kobs is the reduction of kradicals by bicarbonate.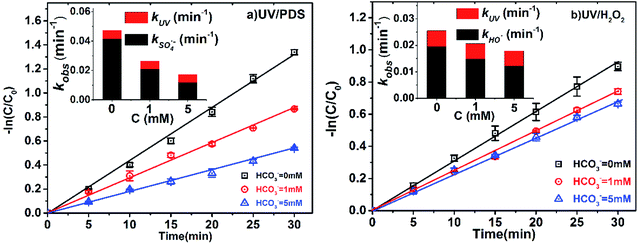 | ||
| Fig. 4 Effects of HCO3− on the degradation of 2-BP in UV/PDS and UV/H2O2 processes. Experimental conditions: [2-BP] = 10 μM; 10 mM phosphate buffer (pH 7.0); [PDS] = [H2O2] = 0.5 mM. | ||
It can be seen that the presence of HCO3− can effectively inhibit the degradation of 2-BP in both processes. This is because HCO3− can react with SO4˙− and HO˙ (eqn (13) and (14)) with high reaction rate constants (106 M−1 s−1), and these reactions decrease the steady-state concentrations of SO4˙− and HO˙. In this process, although CO3˙− was produced, the generated CO3˙− reacted with the BPs with low reactivity.18
| HCO3− + SO4˙− → HSO4− + CO3˙−, k = 9.1 × 10⁶ M−1 s−1 | (13) |
| HCO3− + HO˙ → H2O + CO3˙−, k = 8.5 × 10⁶ M−1 s−1 | (14) |
In addition, HCO3− suppressed the degradation of pollutants in the UV/PDS system more significantly. This is because the scavenging effect of HCO3− on SO4˙− was stronger than that of HO˙. By calculating the competitive kinetics, the ratio of kOH˙,HCO3−/kOH˙,BP was found to be about 1.53 times higher than that of kOH˙,HCO3−/kSO4˙−,BP;40,41 this indicates that HCO3− has a stronger scavenging effect on SO4˙−.
3.5. Effects of NOM on 2-BP degradation
The concentration of NOM in surface water is approximately 2.2 to 18 mgC L−1,33,39 and the influence of NOM on 2-BP degradation was also investigated. As shown in Fig. 5, the kobs of 2-BP in the UV/PDS and UV/H2O2 processes decreased from 0.0202 to 0.0136 min−1 and from 0.0202 to 0.0153 min−1, respectively, with increasing addition of NOM (1 mgC L−1 to 10 mgC L−1). Because NOM has a strong optical screening effect, the direct photodegradation rate of 2-BP was affected by NOM to some extent. It was found that with increasing NOM concentration, kUV decreased gradually; simultaneously, kradicals also decreased significantly.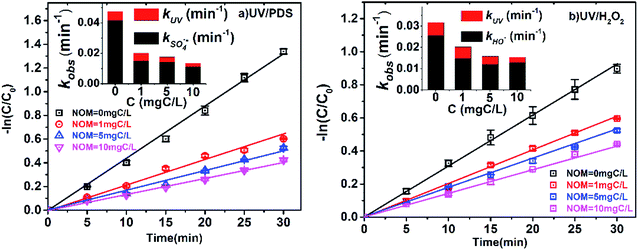 | ||
| Fig. 5 Effects of NOM on the degradation of 2-BP in UV/PDS and UV/H2O2 processes. Experimental conditions: [2-BP] = 10 μM; 10 mM phosphate buffer (pH 7.0); [PDS] = [H2O2] = 0.5 mM. | ||
The existence of NOM can significantly inhibit the degradation of 2-BP in both processes. On the one hand, the inhibitory effect of NOM was attributed to light shielding because of the high molar absorption coefficient of NOM.42 This light shielding effect of NOM reduced the photons absorbed by PDS and H2O2, resulting in decreases of the SO4˙− and HO˙ concentrations. On the other hand, it was previously reported that NOM can scavenge free radicals, leading to decreased SO4˙− and HO˙ concentrations. The reaction rate constants of NOM with SO4˙− and HO˙ were reported to be as high as 6.8 × 10³ mgC L−1 s−1 and 1.4 × 10⁴ mgC L−1 s−1, respectively.31,43
3.6. Degradation products of 2-BP in UV/PDS and UV/H2O2 processes
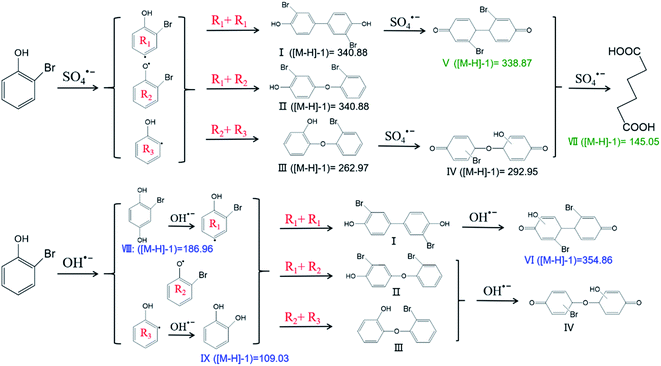
The degradation products of 2-BP were detected by LC-MS/MS; the tentatively identified degradation products of 2-BP were ([M − H]−1) 145.05, 109.03, 186.96, 292.95, 262.97, 338.87, 340.88, and 354.86. The products were further determined according to the identified values of the ([M − H]−1) ratio and previous reports (Tables S7 and S8†). Here, ([M − H]−1) 145.05, 292.96, 262.97, 338.87, and 340.88 were generated from the reaction of SO4˙− with 2-BP. In comparison, ([M − H]−1) 109.03, 186.96, 292.95, 262.97, 340.88, and 354.86 were produced from the reaction of HO˙ with 2-BP. The different degradation products of SO4˙− with 2-BP and HO˙ with 2-BP can be attributed to their different mechanisms.DFT was introduced to further analyze the transition state of 2-BP via calculating the HOMO orbital composition (Fig. S2†). According to the detected products and quantum chemical calculations, the reaction pathways were proposed (Fig. 6). C2, C5 and C4 in 2-BP were found to account for high percentages of the HOMO orbital composition, with 22.01%, 19.20% and 12.69%, respectively; this indicates that C2, C5 and C4 in 2-BP are most likely to be formed via electrophilic reactions. Thus, as the first step, SO4˙− is most likely to attack C2 on the benzene ring and then produce the corresponding intermediates R1, R2 and R3. The products of I, II and III were produced from the coupling of R1, R2 and R3.4 Then, these products (I, II and III) further reacted with SO4˙−, generating products IV and V; these may produce VII via a series of reaction processes, including ring-cleavage.
In comparison, the first step of the reaction of HO˙ with 2-BP is different from that of the reaction of SO4˙− with 2-BP based on the identified products. Bromohydroquinone (([M − H]−1) 186.96) was the product derived from hydroxyl addition of 2-BP, and R1 was further produced via elimination of one water molecule. In addition, catechol (([M − H]−1) 109.03) was the product of the hydroxyl addition of R3. The products I, II and III were also produced from the interactions of R1, R2 and R3. ([M − H]−1) 354.86 is the product formed from the reaction of HO˙ with product I. The first steps of the product pathways further suggest that SO4˙− is a strong one-electron oxidant that reacts with organic contaminants via electron transfer more readily than HO˙.
Furthermore, variation of the TOC during degradation was monitored. The results showed that in the UV/PDS system, the mineralization rate of the pollutant was 33%, while the TOC value decreased slightly in the UV/H2O2 system (as shown in Fig. S3†); this indicates that more complete degradation occurred in the UV/PDS system. This can be attributed to the fact that more radicals can be formed in the UV/PDS process based on the higher molar extinction coefficient of PDS (i.e., 21.1 M−1 cm−1) than of H2O2 (i.e., 18 M−1 cm−1) and the higher quantum yield of SO4˙− (i.e., 0.7 mol per einstein) during UV photolysis of PDS than of HO˙ (i.e., 0.5 mol per einstein) during H2O2 photolysis.34 It should be noted that the generation of toxic byproducts (such as hydroxylated polybrominated diphenyl ethers (OH-PBDEs) and hydroxylated polybrominated biphenyls (OH-PBBs)) in degradation processes should be of concern, given that high toxicity of these byproducts was reported in previous research.18,34,44 Literature reports about the degradation of HPs showed that increasing the dosage of oxidant can not only effectively remove pollutants, but can also achieve better dehalogenation efficiencies.3,34 It can also be inferred from the degradation of TOC that toxic byproducts can be gradually mineralized with increasing reaction time.
4. Conclusion
The degradation rates of HPs with different substitution positions in the UV/PDS process were in the order of para-substituted HPs (i.e., 4-BP and 4-CP) > ortho-substituted HPs (i.e., 2-BP and 2-CP) > meta-substituted HPs (i.e., 3-BP and 3-CP), while in the UV/H2O2 process, the rates were in the order of para-substituted HPs > meta-substituted HPs > ortho-substituted HPs. The second-order reaction rate constant of SO4˙− with substituted HPs was calculated to be (2.74 to 3.37) × 109 M−1 s−1, and the second-order reaction rate constants between HO˙ and the substituted HPs were (3.93 to 6.84) × 109 M−1 s−1, respectively.The presence of Cl−, HCO3− and NOM could inhibit the degradation of 2-BP due to their ability of scavenging free radicals. The DFT calculations indicated that SO4˙− reacts with HPs via electron transfer more readily than HO˙. The products further confirmed that SO4˙− is a strong one-electron oxidant that reacts with HPs mainly via electron transfer, while in the case of HO˙, it reacts with HPs via electron transfer and hydroxyl addition.
Conflicts of interest
There are no conflicts to declare.Acknowledgements
We gratefully acknowledge funding from the National Natural Science Foundation of China (No. 51608036, 51578066, and 41977317), Fundamental Research Funds for the Central Universities (No. 2015ZCQ-HJ-02), Natural Science Foundation of Beijing Municipality (No. 8182037), and Major Science and Technology Program for Water Pollution Control and Treatment (2017ZX07102-002).References
- C. Guan, J. Jiang, C. Luo, S. Pang, Y. Yang, Z. Wang, J. Ma, J. Yu and X. Zhao, Chem. Eng. J., 2018, 337, 40–50 CrossRef CAS.
- H. Zhao, J. Jiang, Y. Wang, H. Lehmler, G. R. Buettner, X. Quan and J. Chen, Environ. Sci. Technol., 2015, 49, 14120–14128 CrossRef CAS PubMed.
- B. Xie, X. Li, X. Huang, Z. Xu, W. Zhang and B. Pan, J. Environ. Sci., 2017, 54, 231–238 CrossRef PubMed.
- K. Nomiyama, C. Kanbara, M. Ochiai, A. Eguchi, H. Mizukawa, T. Isobe, T. Matsuishi, T. K. Yamada and S. Tanabe, Mar. Environ. Res., 2014, 93, 15–22 CrossRef CAS PubMed.
- J. Jiang, Y. Gao, S. Y. Pang, Q. Wang, X. Huangfu, Y. Liu and J. Ma, Environ. Sci. Technol., 2014, 48, 10850–10858 CrossRef CAS PubMed.
- K. Lin, L. Song, S. Zhou, D. Chen and J. Gan, Chemosphere, 2016, 155, 266–273 CrossRef CAS PubMed.
- C. Guan, J. Jiang, S. Pang, C. Luo, J. Ma, Y. Zhou and Y. Yang, Environ. Sci. Technol., 2017, 51, 10718–10728 CrossRef CAS PubMed.
- W. Sim, S. Lee, I. Lee, S. Choi and J. Oh, Chemosphere, 2009, 77, 552–558 CrossRef CAS PubMed.
- C. M. Olsen, E. T. M. Meussen-Elholm, J. A. Holme and J. K. Hongslo, Toxicol. Lett., 2002, 129, 55–63 CrossRef CAS.
- E. Bruchajzer, J. A. Szymanska and J. K. Piotrowski, Toxicol. Lett., 2002, 134, 245–252 CrossRef CAS.
- Y. Dai, Y. Song, S. Wang and Y. Yuan, Water Res., 2015, 71, 64–73 CrossRef CAS PubMed.
- A. Meizler, F. Roddick and N. Porter, Chem. Eng. J., 2011, 172, 792–798 CAS.
- F. Ghanbari, M. Moradi and F. Gohari, Journal of Water Process Engineering, 2016, 9, 22–28 CrossRef.
- G. Matafonova and V. Batoev, Water Res., 2018, 132, 177–189 CrossRef CAS PubMed.
- E. Simonenko, A. Gomonov, N. Rolle and L. Molodkina, Procedia Eng., 2015, 117, 337–344 CrossRef.
- P. Avetta, A. Pensato, M. Minella, M. Malandrino, V. Maurino and C. Minero, Environ. Sci. Technol., 2015, 49, 1043–1050 CrossRef CAS PubMed.
- M. W. Lam and S. A. Mabury, Aquat. Sci., 2005, 67, 177–188 CrossRef CAS.
- C. Luo, J. Gao, D. Wu, J. Jiang, Y. Liu, W. Zhou and J. Ma, Chem. Eng. J., 2019, 358, 1342–1350 CrossRef CAS.
- L. Xu, R. Yuan, Y. Guo, D. Xiao, Y. Cao, Z. Wang and J. Liu, Chem. Eng. J., 2013, 217, 169–173 CrossRef CAS.
- T. K. Lau, W. Chu and N. J. D. Graham, Environ. Sci. Technol., 2007, 41, 613–619 CrossRef CAS PubMed.
- H. V. Lutze, S. Bircher, I. Rapp, N. Kerlin, R. Bakkour, M. Geisler, C. V. Sonntag and T. C. Schmidt, Environ. Sci. Technol., 2015, 49, 1673–1680 CrossRef CAS PubMed.
- M. Ahmadi, S. Samarbaf, M. Golshan, S. Jorfi and B. Ramavandi, Data in Brief, 2018, 20, 582–586 CrossRef PubMed.
- R. O. Rahn, M. I. Stefan, J. R. Bolton, E. n. M. Goren, P. S. Shaw and K. R. Lykke, Photochem. Photobiol., 2003, 78, 146–152 CrossRef CAS.
- T. Lu and F. Chen, J. Comput. Chem., 2012, 33, 580–592 CrossRef CAS PubMed.
- K. Mangalgiri and L. Blaney, Environ. Sci. Technol., 2017, 51, 12310–12319 CrossRef CAS PubMed.
- P. Sun, C. Tyree and C. Huang, Environ. Sci. Technol., 2016, 50, 4448–4458 CrossRef CAS PubMed.
- P. Xie, J. Ma, W. Liu, J. Zou, S. Yue, X. Li, M. R. Wiesner and J. Fang, Water Res., 2015, 69, 223–233 CrossRef CAS PubMed.
- Z. Yang, R. Su, S. Luo, R. Spinney, M. Cai, R. Xiao and Z. Wei, Sci. Total Environ., 2017, 590, 751–760 CrossRef PubMed.
- S. Luo, L. Gao, Z. Wei, R. Spinney, D. D. Dionysiou, W. Hu, L. Chai and R. Xiao, Water Res., 2018, 137, 233–241 CrossRef CAS PubMed.
- J. Jiang, H. Zhao, S. Liu, X. Chen, X. Jiang, J. Chen and X. Quan, J. Photochem. Photobiol., A, 2017, 336, 63–68 CrossRef CAS.
- F. Wang, W. Wang, S. Yuan, W. Wang and Z. Hu, J. Photochem. Photobiol., A, 2017, 348, 79–88 CrossRef CAS.
- M. Sturini, A. Speltini, F. Maraschi, A. Profumo, L. Pretali, E. Fasani and A. Albini, Environ. Sci. Technol., 2010, 44, 4564–4569 CrossRef CAS PubMed.
- C. Zhou, J. Chen, Q. Xie, X. Wei, Y. Zhang and Z. Fu, Chemosphere, 2015, 138, 792–797 CrossRef CAS PubMed.
- C. Luo, J. Jiang, J. Ma, S. Pang, Y. Liu, Y. Song, C. Guan, J. Li, Y. Jin and D. Wu, Water Res., 2016, 96, 12–21 CrossRef CAS PubMed.
- R. Zhang, P. Sun, T. H. Boyer, L. Zhao and C. Huang, Environ. Sci. Technol., 2015, 49, 3056–3066 CrossRef CAS PubMed.
- K. Yin, Y. Deng, C. Liu, Q. He, Y. Wei, S. Chen, T. Liu and S. Luo, Chem. Eng. J., 2018, 346, 298–306 CrossRef CAS.
- Y. Yang, J. Pignatello, J. Ma and W. Mitch, Environ. Sci. Technol., 2014, 48, 2344–2351 CrossRef CAS PubMed.
- Z. Wang, R. Yuan, Y. Guo, L. Xu and J. Liu, J. Hazard. Mater., 2011, 190, 1083–1087 CrossRef CAS PubMed.
- A. Lin, X. Wang and W. Lee, Environ. Sci. Technol., 2013, 47, 4104–4112 CrossRef CAS PubMed.
- M. Kwon, S. Kim, Y. Yoon, Y. Jung, T. Hwang, J. Lee and J. Kang, Chem. Eng. J., 2015, 269, 379–390 CrossRef CAS.
- X. Liu, L. Fang, Y. Zhou, T. Zhang and Y. Shao, Environ. Sci. Technol., 2013, 37, 4790–4797 Search PubMed.
- D. Vione, D. Fabbri, M. Minella and S. Canonica, Water Res., 2018, 128, 38–48 CrossRef CAS PubMed.
- Y. Ahn, D. Lee, M. Kwon, I. Choi, S. Nam and J. Kang, Chemosphere, 2017, 184, 960–968 CrossRef CAS PubMed.
- K. Lin, C. Yan and J. Gan, Environ. Sci. Technol., 2014, 48(1), 263–271 CrossRef CAS PubMed.
Footnote |
| † Electronic supplementary information (ESI) available. See DOI: 10.1039/c9ra10401a |
| This journal is © The Royal Society of Chemistry 2020 |

