DOI:
10.1039/D5TC00421G
(Paper)
J. Mater. Chem. C, 2025,
13, 10700-10713
Systematic investigation on unsymmetrical mesogenic cyanobiphenyl dimers towards optical storage devices: synthesis, mesomorphic, photo switching and DFT studies†
Received
4th February 2025
, Accepted 8th April 2025
First published on 9th April 2025
Abstract
This research presents the synthesis and analysis of a novel series of mesogenic dimers comprising cyanobiphenyl and azonaphthyl units. Structural validation was performed using FT-IR, 1H-NMR, 13C-NMR, elemental analysis, mass spectrometry, etc. The dimers’ thermotropic behaviours were studied through POM and DSC, revealing enantiotropic nematic phases in all cases, with some also showing monotropic smectic C phases. The study explores the relationship between the chemical structure of the dimers and the length of the flexible spacer, the odd–even effect, and their phase transition temperatures. Longer chains tended to form smectic phases, while shorter chains primarily exhibited nematic phases. Computational analysis using B3LYP/6-31g(d,p) and evaluations of electrostatic potential (ESP) and optical properties provided further insight into the electronic structures. Photoisomerization studies demonstrated consistent photochromic responses, with all dimers showing high conversion efficiency (88–95%) under UV light along with similar back relaxation times (∼10–12 hours). Optical storage devices prepared by these materials showed excellent contrast between dark and bright states elucidating the importance of such materials for the future.
1. Introduction
The cyanobiphenyl moiety is significant in the formation of liquid crystalline (LC) materials due to their unique molecular structure, which promotes the formation of stable liquid crystal phases. The rigid, rod-like shape of the biphenyl core, combined with the strong dipolar interaction introduced by the cyano group (–CN), enhances molecular alignment and order, which is crucial for the development of nematic and smectic phases. The cyano group, being highly polar, also contributes to the thermal stability and dielectric properties of the liquid crystalline phase, making cyanobiphenyl derivatives highly valuable in the design of liquid crystal displays (LCDs) and other advanced optical devices. Commercially available liquid crystals such as 5-cyanobiphenyls (5-CB), owing to their dimeric structure, exhibit the desired nematic (N) phase even at room temperature.1 In particular, the utilization of the nematic (N) and twist-bend nematic (NTB) phases in liquid crystal (LC) dimers and other systems has found practical applications, including the selective reflection of light controlled by electric and magnetic fields, along with advancements in the development of tuneable lasers.2 Over the past decade, significant attention has been directed towards studying the NTB phase, which is generally obtained in dimers containing a cyanobiphenyl moiety. Initially proposed in theoretical research,3–5 the NTB phase was later confirmed experimentally in bent LC dimers.6 This phase is characterized by a helical precession of the director with a typical pitch of several tens of nanometres, which increases with temperature.7–9
Interestingly, the helical structures observed in the NTB phase share optical and physical properties resembling the layered smectic phase rather than the typical nematic phase, thus categorizing the NTB phase as a pseudo-layered phase.10–13 However, less attention has been paid to variations in spacer length and the chemical composition of links between the spacer and mesogenic units.14–19 Recent studies have documented the emergence of the twist-bend nematic phase in odd LC dimers containing ether linkages to their mesogenic units.20,21 Additionally, several bent LC dimers have been identified to exhibit Iso-NTB phase transitions in their single-component systems. Examples include homologues of imine-linked dimers with a propane spacer and terminal methoxy/ethoxy groups,22 propane- and ethylthio-linked cyanobiphenyl-based dimers,23 and a bent phosphine-bridged cyanobiphenyl dimer.24 Liquid crystal dimers incorporating cyanobiphenyl and azo groups represent a promising class of materials. These dimers typically feature two distinct segments: a cyanobiphenyl moiety, which provides a rigid core and imparts nematic behaviour, and an azo group, which introduces additional functionality and influences the mesomorphic properties. Arakawa et al. reported asymmetric cyanobiphenyl and naphthalene dimers that exhibit the twist-bend nematic phase.25 They have also reported thioether-linked azobenzene-based liquid crystal dimers exhibiting the twist-bend nematic phase over a wide temperature range.26
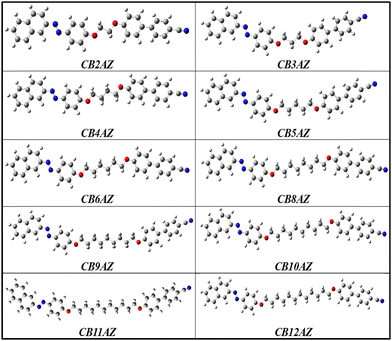
Fig. 1 depicts a few examples of unsymmetrical cyanobiphenyl dimers with a cyanobiphenyl and azo moiety. Arakawa et al. introduced a non-symmetric series with sulphur linkages based on 4-cyanoazobenzene and 4-cyanobiphenyl arms, showing supercooled NTB phases.26 Imrie et al. presented two sets of novel non-symmetric LC dimers. These dimers exhibited NTB and N phases, with varying terminal substituents.27,28 They also introduced a non-symmetric series with sulphur linkages based on 4-cyanoazobenzene and 4-cyanobiphenyl arms, showing supercooled NTB phases.27,28 Introducing light on photochromic molecules is always an exciting area of research, especially when it comes to optical storage applications.29–32 Azobenzene is one such light-sensitive moiety which can alter easily with the illumination of UV light of 365 nm wavelength. Due to this, the energetically stable trans-molecule will convert to cis-molecules that are not stable as such. Due to this, cis molecules can be brought back to the original configuration either by shining a white light of wavelength 450 nm or by keeping the system as it is in the dark. The later process is known as thermal back relaxation and is extremely important for the creation of optical storage devices.33–35 Unsymmetrical dimers play a very peculiar role here since they have a competing effect between Azo and the main chain. The addition of the spacer length in these systems was not studied fully as far as our knowledge is concerned and this study is a perfect platform to understand the structure–property relationship between them.
 |
| | Fig. 1 Asymmetric dimers featuring a combination of cyanobiphenyl and azo moiety. | |
Naphthalene moiety and azo linkage play critical roles in the formation of liquid crystalline compounds due to their structural and electronic characteristics. The naphthalene ring, with its extended conjugated system, introduces rigidity and planarity to the molecule, which is essential for maintaining the anisotropic properties needed for liquid crystal phases.36–38 The novelty of this work lies in the incorporation of a naphthalene moiety at one terminal of the LC dimer, introducing asymmetry to the molecular design. While cyanobiphenyl-based dimers with azo linkages are well-studied, the use of an unsubstituted naphthalene unit remains scarce. Its larger π-system increases molecular breadth, potentially disrupting intermolecular interactions, yet the synthesized dimers exhibit stable mesomorphic properties. This synergy between cyanobiphenyl and naphthalene offers valuable insights into the structure–property relationships of LC dimers, demonstrating a fine balance between rigidity and flexibility to maintain liquid crystallinity.
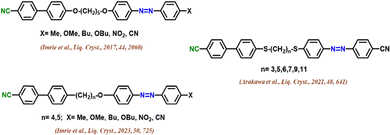
To deepen our understanding of the relationships between structure and properties in dimers based on cyanobiphenyl and incorporating naphthalene entities, and to evaluate how different flexible spacers influence their phase behaviour, here we synthesized a new series of calamitic–calamitic dimers. These dimers contain cyanobiphenyl ether and azo naphthyl. The mesogenic units in these compounds are linked via ether bonds and are separated by a flexible spacer ranging from 2–6, and 8–12 methylene groups in length. The abbreviated name CBOH represents compounds where “CB” denotes the cyanobiphenyl group. In, NpAzOH, the word “NpAz” indicates the rod-like azonaphthyl. Series CBnAZ dimers are dimers in which one end bears a cyanobiphenyl group and the other end bears an azonaphthyl moiety and “n” signifies the no. of carbon atoms/length of the flexible spacer for these unsymmetrical dimers.
2. Synthesis
The liquid crystalline dimers of the CBnAZ series were synthesized using a standardized procedure described in Scheme 1. Synthesis of key intermediate (E)-4-(naphthalen-2-yldiazenyl)phenol (NpAzOH) has been done according to the literature.38CBBr-n was synthesized by refluxing a mixture containing 4′-hydroxy-[1,1′-biphenyl]-4-carbonitrile (CBOH), α,ω-dibromoalkanes and K2CO3, in solvent acetone for a time period of 24 h, followed by filtration and purification using column chromatography. In CBBr-n, n is the no. of carbons present in the flexible spacer. The reaction of CBBr-n with NpAzOH, carried out via the Williamson ether synthesis in the presence of anhydrous K2CO3 and KI in acetone, resulted in the formation of CBnAZ (n = 2–6, 8–12).
 |
| | Scheme 1 Synthesis scheme for the dimers of series CBnAZ. | |
3. Results and discussion
3.1. Chemistry
The accurate structures were confirmed using a range of analytical techniques, such as FT-IR, 1H NMR, 13C NMR, mass spectrometry and elemental analysis. The molecular structure of CB6AZ serves as a representative example for the entire series. The FT-IR spectrum of the dimer CB6AZ exhibits C–H stretching bands for both the alkyl and benzylic groups in the range of 2800–3080 cm−1. Absorption bands with medium intensity observed in the range of 1610–1595 cm−1 are likely due to the stretching vibrations of the azo (–N![[double bond, length as m-dash]](https://www.rsc.org/images/entities/char_e001.gif) N–) group. Additionally, the stretching vibrations of the aromatic (–CC–) bonds are detected within the frequency range of 1550–1500 cm−1. The medium intensity band for the nitrile group (–C
N–) group. Additionally, the stretching vibrations of the aromatic (–CC–) bonds are detected within the frequency range of 1550–1500 cm−1. The medium intensity band for the nitrile group (–C![[triple bond, length as m-dash]](https://www.rsc.org/images/entities/char_e002.gif) N) appeared around 2220–2228 cm−1. The 1H NMR spectrum of CB6AZ revealed triplet peaks within the chemical shift range of δ 4.35–3.95 ppm, attributable to the protons on the carbon bonded to an oxygen atom. The remaining methylene protons exhibited a multiple signal in the range of δ 2.50–1.25 ppm. The aromatic protons were observed in the region of δ 6.80–8.50 ppm. In the 13C NMR of CB6AZ, peaks for methylene protons of the flexible spacer were observed around δ 25 to 30 ppm. The carbon, which is directly attached to the oxygen signal, was found around δ 65–69 ppm. The aromatic carbon signals were observed in the range of δ 110–165 ppm. The characteristic peak for the nitrile carbon (–CN) appeared around δ 117–119 ppm.
N) appeared around 2220–2228 cm−1. The 1H NMR spectrum of CB6AZ revealed triplet peaks within the chemical shift range of δ 4.35–3.95 ppm, attributable to the protons on the carbon bonded to an oxygen atom. The remaining methylene protons exhibited a multiple signal in the range of δ 2.50–1.25 ppm. The aromatic protons were observed in the region of δ 6.80–8.50 ppm. In the 13C NMR of CB6AZ, peaks for methylene protons of the flexible spacer were observed around δ 25 to 30 ppm. The carbon, which is directly attached to the oxygen signal, was found around δ 65–69 ppm. The aromatic carbon signals were observed in the range of δ 110–165 ppm. The characteristic peak for the nitrile carbon (–CN) appeared around δ 117–119 ppm.
3.2. Mesomorphic behaviour
The phase behaviour and mesomorphic properties of the dimers were analyzed using a differential scanning calorimeter (DSC) and a polarizing optical microscope (POM). The DSC measurements were conducted at a rate of 10 °C per minute during both the heating and cooling cycles, and the thermograms were acquired using the DSC-822 system (make: Mettler Toledo) along with Stare software. The transition temperatures (in °C) and corresponding transition enthalpy values (ΔH in kJ mol−1) for the CBnAZ dimers are summarized in Table 1. The DSC thermogram for the CB6AZ dimers can be seen in Fig. 2. During heating, the compound undergoes an endothermic transition from the Cr to N phase at 178.04 °C, accompanied by an enthalpy change (ΔH) of 51.57 kJ mol−1. The subsequent phase change from the nematic to the isotropic liquid state occurs at 225.60 °C with a smaller ΔH of 2.48 kJ mol−1. During the cooling process, the reverse transitions take place, demonstrating the reversibility of the phase changes. These transitions include Iso-to-N at 222.11 °C, N-to-SmC at 163.38 °C, and SmC-to-Cr at 147.52 °C, with all of them being exothermic, as shown in Fig. 2. It can be concluded that the compound exhibits an enantiotropic nematic phase along with a monotropic smectic C phase.
Table 1 The transition temperatures (°C) and the associated enthalpy values (ΔH) for CBnAZ
| Dimer |
n
|
Transition temperatures (in °C) [ΔH (in kJ mol−1)] |
| Heating cycle |
Cooling cycle |
| Cr: crystalline state; SmC: smectic C phase; N: nematic phase; Iso: isotropic Liquid |
|
CB2AZ
|
2 |
Cr 250.64 (55.22) N 268.70 (2.57) Iso |
Iso 265.38 (−2.52) N 197.05 (−50.99) Cr |
|
CB3AZ
|
3 |
Cr 196.98 (39.33) Iso |
Iso 168.32 (−0.80) N 150.30 (−36.39) Cr |
|
CB4AZ
|
4 |
Cr 208.06 (58.65) N 248.74 (2.91) Iso |
Iso 245.97 (−2.70) N 173.14 (−56.58) Cr |
|
CB5AZ
|
5 |
Cr 182.76 (45.50) Iso |
Iso 170.58 (−1.30) N 132.38 (−37.60) Cr |
|
CB6AZ
|
6 |
Cr 178.04 (51.57) N 225.60 (2.48) Iso |
Iso 222.11 (−2.21) N 163.38 (−0.44) SmC 147.52 (−49.93) Cr |
|
CB8AZ
|
8 |
Cr 162.88 (53.62) N 198.65 (2.98) Iso |
Iso 195.65 (−2.96) N 155.87 (−0.94) SmC 138.13 (−55.09) Cr |
|
CB9AZ
|
9 |
Cr 146.76 (46.58) N 173.28 (1.69) Iso |
Iso 169.93 (−1.40) N 114.73 (−46.19) Cr |
|
CB10AZ
|
10 |
Cr 157.40 (45.80) N 194.54 (2.43) Iso |
Iso 192.63 (−2.42) N 148.14 (−0.24) SmC 118.33 (−43.27) Cr |
|
CB11AZ
|
11 |
Cr 143.93 (42.72) N 169.64 (2.39) Iso |
Iso 166.06 (−2.64) N 124.60 (−0.37) SmC 113.08 (−46.08) Cr |
|
CB12AZ
|
12 |
Cr 150.58 (41.53) N 185.50 (2.16) Iso |
Iso 183.79 (−2.05) N 144.31 (−0.22) SmC 120.64 (42.69) Cr |
 |
| | Fig. 2 DSC thermogram of CB6AZ. | |
To determine the LC behaviour of the dimers being studied, the compounds were placed between coverslips and examined using POM. The samples were heated until they reached the isotropic phase and then slowly cooled at a rate of 10 °C per minute to observe the transition from the isotropic to the liquid crystalline phase. Fig. 3 depicts an optical microphotograph of the dimer CB6AZ during the first heating and cooling cycle. At 178 °C during heating (Fig. 3a), a change in the phase is observed, indicating a transition from a Cr to N phase. Subsequently, at 181 °C (Fig. 3b), a Schlieren texture emerges, followed by N to Iso phase transition at 225 °C (Fig. 3c), marking a shift from a nematic phase to an isotropic phase. Upon cooling, at 222 °C (Fig. 3d), nematic droplets form, indicating the presence of an enantiotropic nematic phase, which coalesces to give a Schlieren texture at 218 °C (Fig. 3e). Notably, at 164 °C (Fig. 3f), a transition from the N to SmC phase occurs, accompanied by a focal conic texture at 162 °C (Fig. 3g), characteristic of the SmC phase. Further cooling leads to the SmC-to-Cr transition at 148 °C (Fig. 3h), transitioning to a crystalline state observed at 143 °C (Fig. 3i).
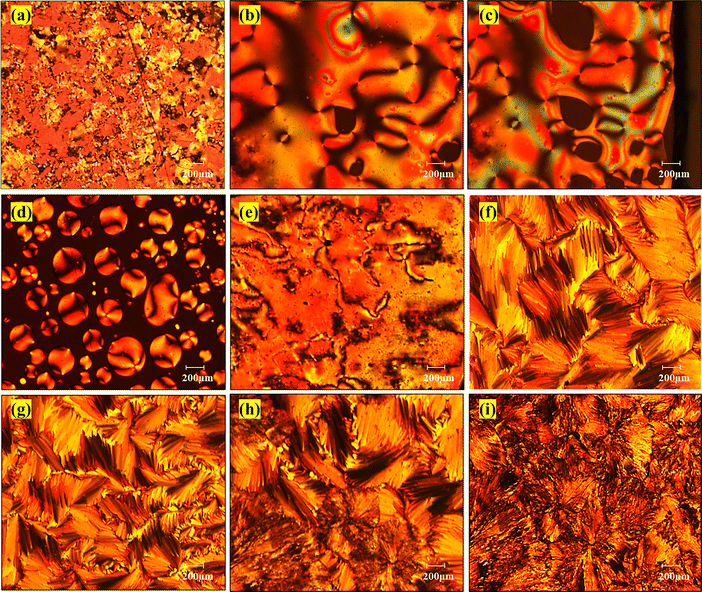 |
| | Fig. 3 Optical microphotographs of dimer CB6AZ: (a) nematic phase at 178 °C on heating, (b) at 181 °C, a Schlieren texture appears, (c) nematic to isotropic transition at 225 °C, (d) formation of nematic droplets at 222 °C upon cooling, (e) reappearance of Schlieren texture at 218 °C, (f) transition to SmC phase at 164 °C, (g) broken focal conic texture of the SmC phase at 162 °C, (h) transition from SmC to Cr at 148 °C, and (i) crystalline state at 143 °C. | |
3.3. Structure–property relationship
A line graph can be an effective way to visually depict the trends in the properties of LC dimers, showing how factors like the length of the spacer chain and odd–even effects impact clearing temperatures and phase behaviour. The graph in Fig. 4a displays the relationship between the number of carbons in the flexible spacer chain (n) on the x-axis and the transition temperatures (°C) on the y-axis. Each data point corresponds to a particular dimer, showing its clearing temperature in relation to the length of the spacer chain. In Fig. 4b, the bar graph illustrates the mesophase stability for dimers CBnAZ. Mesophase stability refers to the propensity of a liquid crystal material to maintain its ordered mesophase, such as the nematic or smectic phase, over a range of temperatures during both the heating and cooling cycle.
 |
| | Fig. 4 (a) Line graph displaying the transition temperatures as a function of the number of carbons in the flexible spacer, and (b) bar graph highlighting the mesophase stability of the series CBnAZ dimer. | |
Firstly, when the flexible spacer lengthens, the clearing temperatures and melting points typically decrease. This is attributed to the increased flexibility of the spacer, which weakens the intermolecular forces between the molecules. As a result, the molecules are less likely to align and exhibit ordered phases at higher temperatures, leading to lower clearing temperatures.
Secondly, odd-membered dimers often exhibit comparatively lower clearing temperatures, a characteristic known as the odd–even effect. This effect arises due to the differing molecular arrangements and intermolecular interactions between odd and even members. Odd-membered dimers often do not exhibit the SmC phase. The odd-numbered spacer introduces a conformational bend in the molecular structure, disrupting the uniform tilt required for SmC formation. This structural distortion results in the stabilization of nematic (N) phases instead, as seen in our study where n = 3, 5, and 9 show only nematic phases. As the spacer length increases, the odd–even effect weakens because the flexibility of the longer alkyl chain allows for structural relaxation. For example, n = 11 exhibits both an enantiotropic nematic and a monotropic smectic phase, indicating that as the chain length increases, the odd–even influence diminishes, and smectic phases can start appearing in odd-membered dimers as well.
Lastly, an increase in chain length often leads to the emergence of smectogenic behaviour. Higher-membered dimers, typically ranging from n = 6 to n = 12, exhibit smectic phases in the cooling cycle, indicative of layered structures with long-range positional order. In contrast, lower-membered dimers, ranging from n = 2 to n = 5, predominantly display the nematic phase, as their shorter chains limit the development of layered smectic structures. This trend underscores the pivotal role of molecular structure, particularly chain length, in dictating the phase behaviour of liquid crystal dimers, with longer chains favouring smectic phases and shorter chains favouring nematic phases.
3.4. Thermogravimetric analysis (TGA)
The TGA curve (Fig. 5) shows that the decomposition of CB6AZ begins around 400 °C, with a significant weight loss of 82.00% observed between 400–450 °C, indicating its primary thermal decomposition. The DTG curve further highlights this decomposition, with a peak at 450.2 °C indicating the maximum rate of weight loss. After 450.2 °C, the weight stabilizes, leaving a residue of 4.42%, which suggests the presence of stable, non-volatile residues. The DTA curve also shows an endothermic peak at 172.6 °C, possibly related to a phase transition, further characterizing the thermal behaviour of CB6AZ. This analysis provides valuable insights into the compound's thermal properties and decomposition processes.
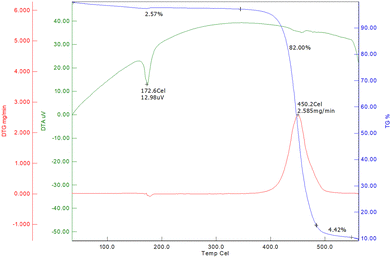 |
| | Fig. 5 TGA curve for dimer CB6AZ. | |
3.5. Computational studies
In our study, density functional theory (DFT) calculations were carried out using the B3LYP hybrid functional, which incorporates Becke's three-parameter approach, along with the 6-31G basis set. The computational framework employed Gaussian 09 software to conduct theoretical calculations essential for understanding molecular properties, such as optimized structures and vibrational frequencies.39–44 The process began with optimizing the energy of different conformations to determine the geometrical structure with the lowest energy. Subsequently, the optimized structure served as the basis for calculating frequencies and thermodynamic properties. Our depiction of molecular structures adheres to a specific colour scheme: carbon atoms are depicted in grey, nitrogen in blue, oxygen in red, and hydrogen in white. The intricate three-dimensional arrangement of the molecules under investigation arises from the precise spatial arrangement of atoms, interconnected through Sigma and pi bonds. Fig. 6 presents the optimized molecular structures of the dimers from both series, offering significant insights into their structural properties as derived from our computational analysis.
 |
| | Fig. 6 Optimized molecular structures of series CBnAZ. | |
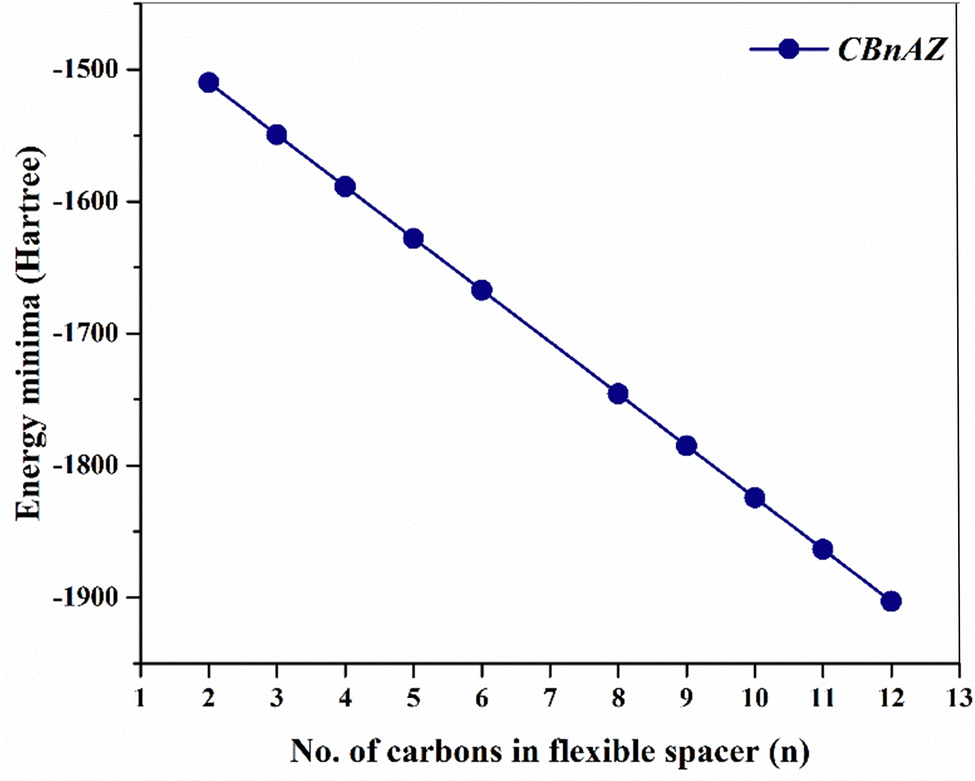
Table 2 presents the stabilization energy or energy minima values, expressed in Hartree, for each dimer. As depicted in Fig. 7, energy minima progressively decrease with an increase in the no. of carbon atoms in the flexible spacer chain of the dimers. The electronic characteristics, specifically the energies of the highest occupied molecular orbital (HOMO) and the lowest unoccupied molecular orbital (LUMO), were determined for the optimized structures. An investigation of the frontier molecular orbitals (FMOs) was performed to predict the stability and chemical reactivity of the dimers. To assess the potential for electron transfer in the compounds, the energy gap between the HOMO and LUMO was computed. In the CBnAZ series, the HOMO and LUMO are mainly derived from the π-orbitals of the naphthyl ring, with a small contribution from the azo linkage (–NN–). The LUMO, in particular, corresponds to the anti-bonding orbital of the biphenyl ring that has a cyano group attached (Fig. 8). The spatial distribution of electron densities within the molecular orbitals (MOs) is not significantly influenced by the length of the flexible spacer. As shown in Table 2, extending the length of the spacer does not notably alter the energy gap. The high charge density around the cores of the dimers, as illustrated in Fig. 8, accounts for the consistency observed in the energy gap. Notably, the dimers studied displayed almost identical values for parameters such as chemical hardness (η) and softness (δ), regardless of the length of the flexible spacer chains.
Table 2 DFT-computed quantum mechanical descriptors of series CBnAZ
| Dimer |
Energy minima (Hartree) |
HOMO |
LUMO |
I (eV) |
A (eV) |
ΔE (eV) |
η
|
δ = 1/η |
χ
|
ω
|
| Ionization potential (I); electron affinity (A); energy gap (ΔE); global hardness (η); global softness (δ); chemical reactivity (χ); electrophilicity index (ω) |
|
CB2AZ
|
−1509.842 |
−0.209 |
−0.083 |
5.678 |
2.251 |
3.427 |
1.714 |
0.584 |
3.965 |
4.586 |
|
CB3AZ
|
−1549.160 |
−0.208 |
−0.082 |
5.648 |
2.225 |
3.423 |
1.712 |
0.584 |
3.936 |
4.526 |
|
CB4AZ
|
−1588.478 |
−0.206 |
−0.081 |
5.615 |
2.193 |
3.422 |
1.711 |
0.584 |
3.904 |
4.454 |
|
CB5AZ
|
−1627.795 |
−0.206 |
−0.080 |
5.597 |
2.177 |
3.420 |
1.710 |
0.585 |
3.887 |
4.418 |
|
CB6AZ
|
−1667.111 |
−0.205 |
−0.079 |
5.578 |
2.159 |
3.419 |
1.709 |
0.585 |
3.869 |
4.378 |
|
CB8AZ
|
−1745.745 |
−0.204 |
−0.079 |
5.556 |
2.139 |
3.417 |
1.708 |
0.585 |
3.847 |
4.332 |
|
CB9AZ
|
−1785.061 |
−0.203 |
−0.077 |
5.548 |
2.119 |
3.429 |
1.714 |
0.583 |
3.833 |
4.285 |
|
CB10AZ
|
−1824.378 |
−0.204 |
−0.078 |
5.541 |
2.125 |
3.416 |
1.708 |
0.585 |
3.833 |
4.301 |
|
CB11AZ
|
−1863.695 |
−0.203 |
−0.077 |
5.536 |
2.104 |
3.432 |
1.716 |
0.582 |
3.820 |
4.252 |
|
CB12AZ
|
−1903.011 |
−0.203 |
−0.078 |
5.532 |
2.116 |
3.416 |
1.708 |
0.586 |
3.824 |
4.280 |
 |
| | Fig. 7 A plot depicting the variation in energy minima as the length of the flexible spacer chain increases in the CBnAZ dimer series. | |
 |
| | Fig. 8 Frontier molecular orbitals (FMOs) of the CBnAZ dimer series (HOMO, LUMO, and ΔE values in a.u.). | |
In the series of dimers, each molecule has a dipole moment ranging from approximately 4.6 to 5.2 Debye (Table 3). Typically, molecular interactions significantly impact dipole moments. Notably, odd-membered dimers have lower dipole moments than even-membered dimers. Table 3 also shows the polarizability values for both series CBnAZ, revealing a significant correlation between polarizability and the length of the flexible spacer. As the chain length increases, polarizability also increases proportionally. The odd-membered dimers have a greater molecular breadth due to their bent shape, resulting in lower aspect ratio values. Dimers with tetramethylene and hexamethylene spacers exhibit a higher mesophase range compared to other dimers. Furthermore, odd-membered dimers do not display liquid crystal properties during the heating cycle.
Table 3 Optical properties and dimensional parameters of the dimers
| Dimer |
Dipole moment μ (Debye) |
Polarizability α (a.u.) |
Length (L) Å |
Width (D) Å |
Aspect ratio (L/D) |
Mesophase range (ΔT) °C |
|
CB2AZ
|
5.202 |
439.038 |
27.798 |
5.569 |
4.991 |
18.06 |
|
CB3AZ
|
4.987 |
449.331 |
28.340 |
7.779 |
3.643 |
— |
|
CB4AZ
|
5.098 |
461.590 |
30.295 |
5.569 |
5.439 |
40.68 |
|
CB5AZ
|
4.922 |
472.091 |
30.882 |
7.776 |
3.971 |
— |
|
CB6AZ
|
5.045 |
484.010 |
32.803 |
5.568 |
5.891 |
47.56 |
|
CB8AZ
|
5.011 |
506.503 |
35.323 |
5.567 |
6.345 |
40.77 |
|
CB9AZ
|
4.867 |
517.544 |
36.008 |
7.689 |
4.683 |
26.52 |
|
CB10AZ
|
4.991 |
529.138 |
37.847 |
5.565 |
6.800 |
37.14 |
|
CB11AZ
|
4.615 |
540.735 |
38.391 |
7.625 |
5.034 |
25.71 |
|
CB12AZ
|
4.978 |
551.819 |
40.376 |
5.563 |
7.257 |
34.92 |
The molecular electrostatic potential (MEP) surface was created to visualize the distribution of electron density, which helps predict the sites for electrophilic and nucleophilic attacks. Additionally, mesophase formation in these compounds is impacted by molecular packing arrangements, which are likely influenced by charge distribution. In this study, the charge distribution was analyzed with the B3LYP/6-31G basis set. Fig. 9 illustrates the MEP surface, which is crucial for understanding these interactions. Electrophiles are attracted to regions with higher negative charge (red areas), whereas nucleophiles are drawn to regions with less negative charge (blue areas). The charge separation within the dimers induces end-to-end interactions, resulting in the formation of a nematic mesophase with restricted lateral ordering. Red regions are primarily concentrated around the cyano groups and nitrogen atoms of the azo groups, whereas blue regions are generally observed along the carbon chain of the flexible spacer. The distinct odd–even effects seen in the transitional properties of the dimers are driven by their molecular configuration, which depends on the number of atoms linking the mesogenic units. Dimers with an even number of atoms usually adopt a linear shape, while those with an odd number of atoms generally have a bent shape. The structural difference influences their compatibility within the molecular arrangement of the nematic phase, leading to variations in transitional behaviours, such as shifts in melting points and nematic–isotropic transition temperatures, as shown in Fig. 10.
 |
| | Fig. 9 MEP contours of the dimers of CBnAZ. | |
 |
| | Fig. 10 Space-filling models of (a) CB3AZ (odd-membered dimer) and (b) CB4AZ (even-membered dimer), illustrating the spacer in the all-trans configuration. | |
The calculated vibrational frequencies of the dimers were compared with the experimental values obtained from the FT-IR spectra. The theoretical frequencies showed good agreement with the experimental values, confirming the accuracy of the DFT calculations. The obtained geometries were further confirmed by the vibrational frequency analysis, which yielded no imaginary frequency. Fig. 11 presents a comparison between the experimental and theoretical vibrational frequencies for the CB6AZ dimer, calculated using the B3LYP-6-31G level of theory. The vibrational modes of the phenyl and naphthalene rings include C–H stretching vibrations in the range of 2800–3000 cm−1, in-plane and out-of-plane C–H bending vibrations between 700–850 cm−1, and –CC– stretching vibrations between 1500–1570 cm−1, with a strong agreement observed between the theoretical and experimental values. C–C stretching vibrations are observed between 1450–1300 cm−1, while in-plane C–C bending vibrations occur at around 1010–1030 cm−1. Vibrations at 1600 cm−1 indicate a –NN– double bond. The cyano group (nitrile) exhibits C–N stretching vibrations at 2220 cm−1. Ether groups display C–O stretching vibrations (1260–1200 cm−1) and O–C–O bending vibrations (720–640 cm−1) in line with theoretical calculations.
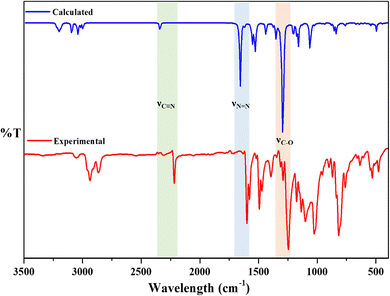 |
| | Fig. 11 Comparison of the experimental vibrational frequencies with calculated frequencies at the B3LYP-6-31G level of theory (gas phase) for the CB6AZ dimers. | |
3.6. Photoswitching behaviour
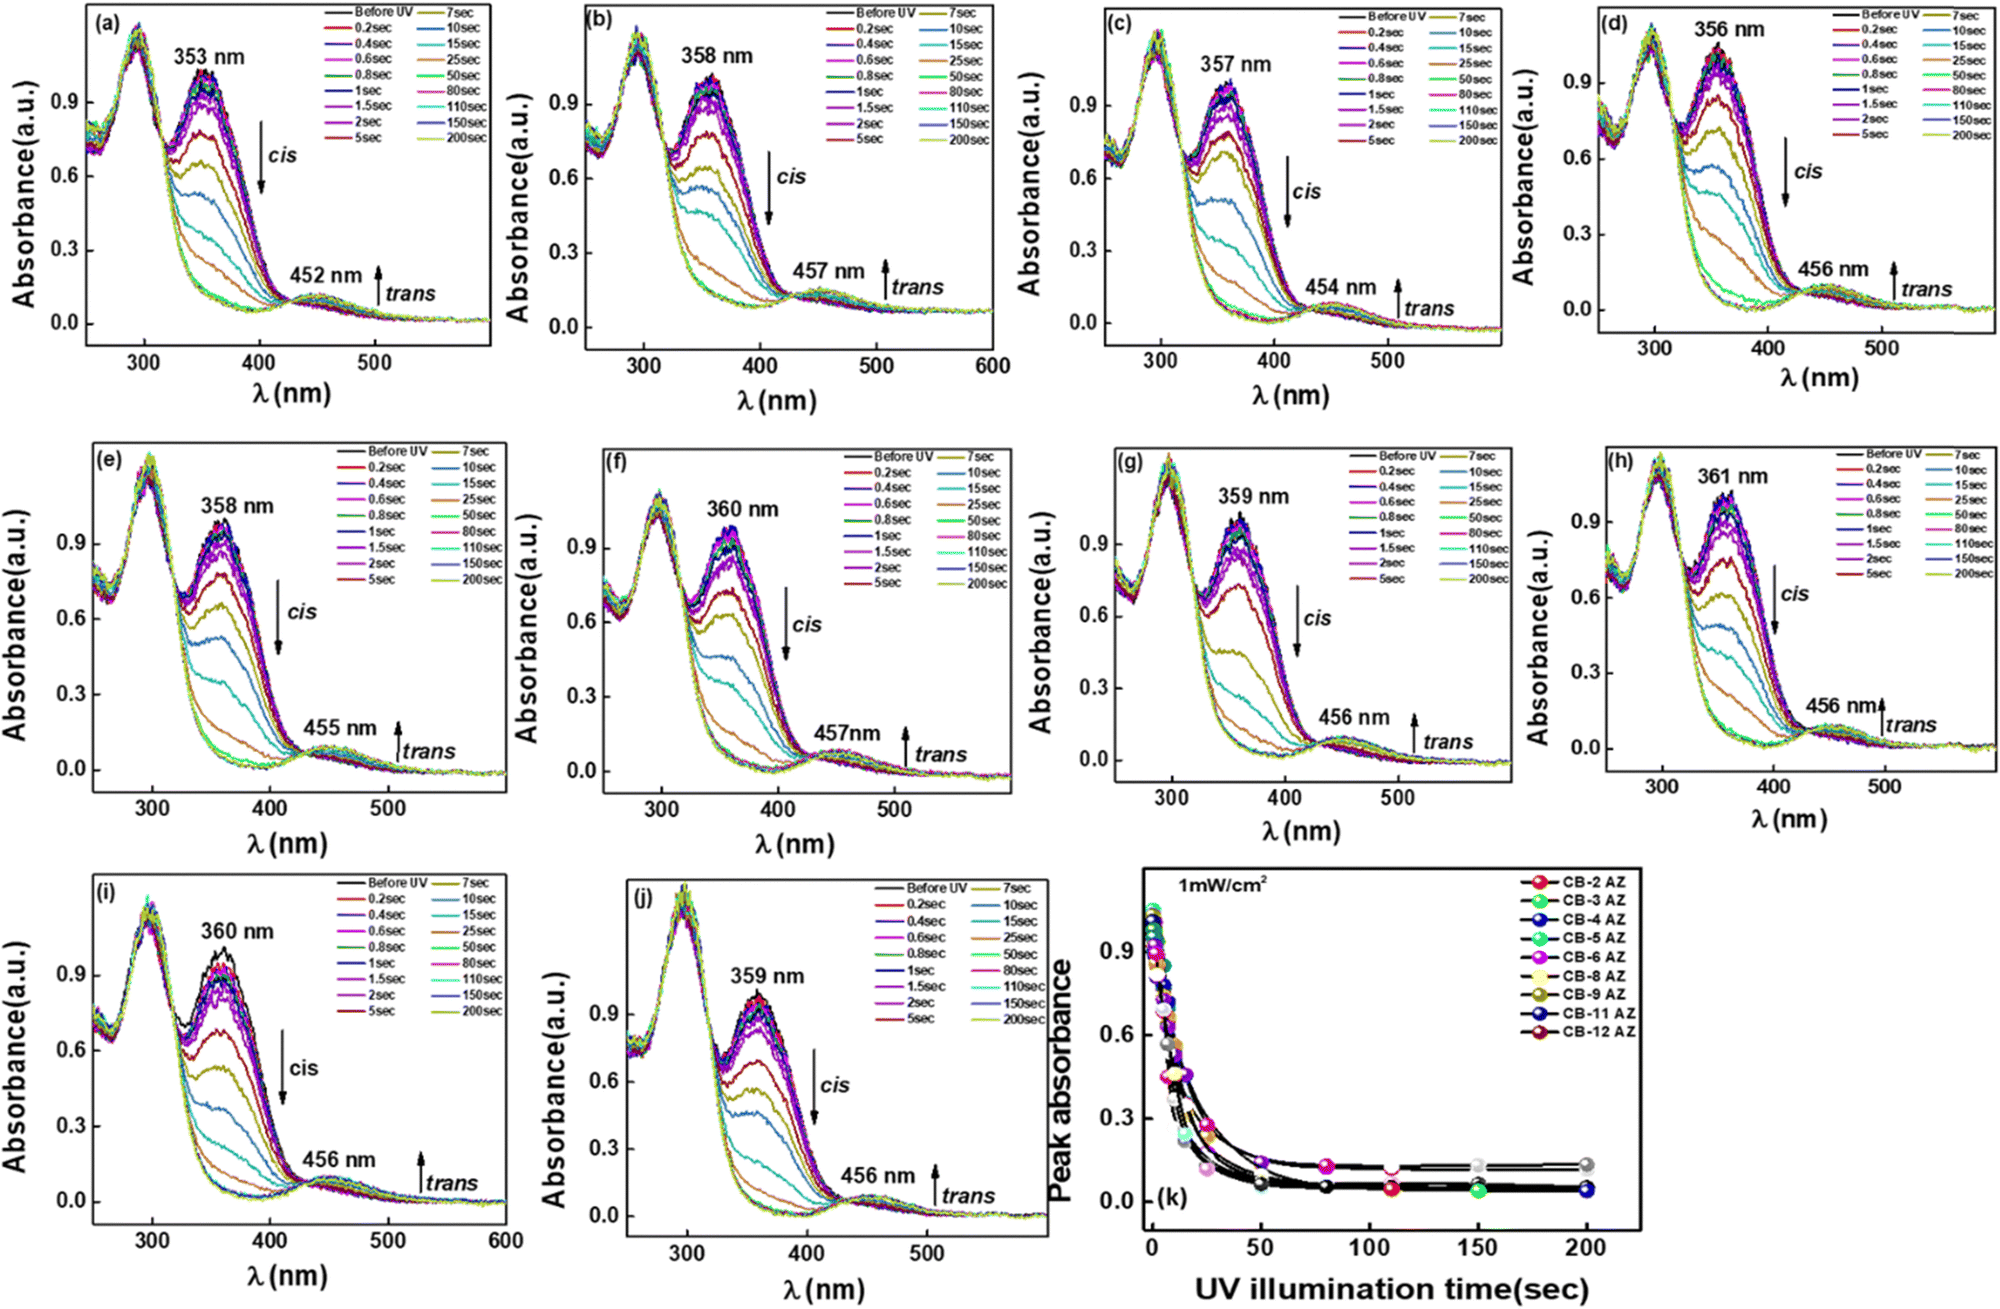
The absorption spectra for trans–cis photoisomerization and cis–trans thermal back relaxation were recorded in solution. These experiments were conducted in a dark room at room temperature (27 ± 1 °C) with the compounds dissolved in chloroform at a fixed concentration of approximately 1.0 × 10⁻⁵ mol L−1. The prepared samples were placed in a quartz cuvette (1 cm optical length) and positioned in the sample holder. The samples were then exposed to UV light with an intensity of around 1 mW cm−2, provided by an OMNICURE series 2000 UV light source, which was fitted with a heat filter to eliminate heat radiation and a 365 nm UV filter. The absorption spectra were first measured under UV irradiation at various exposure times, followed by spectra of compounds undergoing thermal back relaxation at different time intervals.
The photo-switching behaviour of the azobenzene molecules was studied by examining the influence of different chain lengths (n = 2–12) for the dimers of series CBnAZ. Prior to UV illumination, the absorption spectra of all dimers showed a significant peak around 358–361 nm, corresponding to the symmetry-allowed π–π* transition of the azo moiety, along with a weaker peak around 450 nm due to the symmetry-forbidden n–π* transition. Upon UV irradiation, the compounds underwent trans–cis photoisomerization, with a gradual decrease in the absorbance maximum near 365 nm, indicative of the trans–cis conversion, and a slight increase in the peak at approximately 450 nm. As shown in Table 4 and Fig. 12, all compounds exhibited similar photo-saturation times of approximately 45–50 seconds, suggesting that this behaviour depends solely on the UV intensity and is not influenced by the terminal groups or the length of the flexible spacer chain. The changes in the absorption peaks due to UV exposure are depicted in Fig. 12a–j, with the peak absorbance values plotted over time in Fig. 12k.
Table 4 Showing the E–Z and Z–E relaxation along with conversion efficiency
| Dimer |
Time for E–Z in seconds (∼) |
Time for Z–E in minutes |
CE (%) |
|
CB2AZ
|
49 |
600 |
88.70 |
|
CB3AZ
|
50 |
660 |
86.55 |
|
CB4AZ
|
50 |
720 |
95.19 |
|
CB5AZ
|
49 |
660 |
96.09 |
|
CB6AZ
|
48 |
600 |
94.23 |
|
CB8AZ
|
49 |
660 |
94.79 |
|
CB9AZ
|
47 |
600 |
94.77 |
|
CB10AZ
|
49 |
720 |
95.01 |
|
CB11AZ
|
48 |
600 |
96.13 |
|
CB12AZ
|
50 |
660 |
95.85 |
 |
| | Fig. 12 Absorption spectra as a function of UV exposure time for: (a) CB2AZ, (b) CB3AZ, (c) CB4AZ, (d) CB5AZ, (e) CB6AZ, (f) CB8AZ, (g) CB9AZ, (h) CB10AZ, (i) CB11AZ, and (j) CB12AZ. (k) Variation of peak absorbance extracted from (a) to (j) plotted against UV irradiation time. The UV light intensity is maintained at 1 mW cm−2, and a heat filter is placed between the solution and the UV light source to eliminate any thermal effects caused by the light. | |
One can observe from Table 4 that all the compounds show a similar conversion efficiency rate of 88–95% indicating the high sensitivity of the molecules under UV irradiation. Out of all of them, CB11AZ shows the highest conversion efficiency of 96% and CB2AZ has the lowest conversion efficiency of 88%.
Within 50 seconds of illumination, entire trans molecules converted to cis molecules indicating high conversion efficiency in such systems. The photo-conversion efficiency, as shown in eqn (1), can be used to determine the extent of photoisomerization.
| | 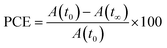 | (1) |
Here
A(
t0) is the initial absorbance (before UV exposure) and
A(
t∞) is the final absorbance (after UV exposure).
When the photo-induced saturation state is achieved, the molecular conformations, depending on their structure, remain stable for a considerable period. However, the cis-to-trans conversion can be triggered either by irradiating with white light at 450 nm or by keeping the system in the dark, which is referred to as thermal back relaxation. Since the ability to recover conformations without external irradiation is vital for optical storage applications, thermal back relaxation is preferred. To assess the back-relaxation time without the influence of external light, absorbance spectra were recorded for solutions in the dark. Fig. 13a–j illustrates the absorbance changes occurring during the thermal back-relaxation process, while Fig. 13k shows the peak absorbance values plotted over time. The variation in thermal back-relaxation time can be attributed to the influence of the terminal groups and the spacer length in the dimer structures. One can see from the figure and Table 4 that thermal back relaxation for all the compounds ranged between 10–12 hours, where CB2AZ will be the lowest and CB10AZ will be the highest thermal back relaxation times.
 |
| | Fig. 13 Thermal back relaxation studies of the CBnAZ series (n = 2–12) following UV irradiation are shown in “a” to “j”. The plot of peak absorbance versus time, representing thermal back relaxation behaviour derived from “a” to “j,” is illustrated in “k.” One can see that within 500 minutes most of the cis molecules are converted back to trans molecules. | |
3.6.1. Kinetic studies.
The kinetics of thermal isomerization provide valuable insights into the effects of both time and temperature on the process. The first-order plot of −kC–tt versus the thermal relaxation time for the studied compounds at room temperature can be generated by determining −kC–tt using eqn (2)| |  | (2) |
where A0, At and A∞ are the peak absorbance values at time zero, time t and time infinity, respectively. Fig. 14 shows the first-order to second-order plot for the compound CBnAZ series. The system demonstrated first-order kinetics for up to 400 minutes, as evident from the linear plot. However, deviations from first-order kinetics were observed in dimers with extended thermal back relaxation times, likely influenced by minor temperature fluctuations during the study.
 |
| | Fig. 14 Plots depicting first-order and second-order kinetics for the thermal cis–trans isomerization of the studied dimers. | |
3.6.2. The reason behind the phenomenon.
The study of liquid crystal materials containing azobenzene moieties with varying chain lengths at the core is particularly fascinating due to the competing effects that arise under exposure to specific wavelengths of light. In their initial state, these molecules exhibit a rod-like shape. However, upon illumination with UV light at a wavelength of 365 nm, their structure undergoes a transformation, adopting a distorted bent configuration. In a guest–host system used in practical devices, these molecules align as rod-like entities alongside the host liquid crystals. When exposed to UV light at 365 nm, their flexible core structure prompts a shift to a distorted bent orientation. This change also influences the host liquid crystals, causing them to remain in the bent configuration for extended periods due to increased thermal back relaxation times. In view of this we tried here to explain the observed phenomena using three distinct cases (see Fig. 15 for the cartoon diagram). Here we chose three cases such as n = 2, n = 6 and n = 12 to understand the influence of the spacer length on the guest–host systems.
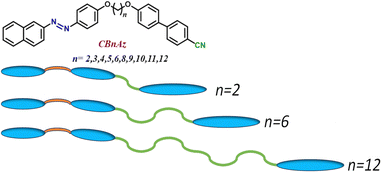 |
| | Fig. 15 Cartoon diagram showing the distribution of spacer length along with the chemical structure. | |
 |
| | Fig. 16 Picture depicting the situation where spacer length is fixed at n = 2. | |
 |
| | Fig. 17 Picture depicting the situation where spacer length is fixed at n = 6. | |
 |
| | Fig. 18 Picture depicting the situation where spacer length is fixed at n = 12. | |
In all the three cases, always unsymmetrical dimers create a difficult situation for the host molecules to relax back to the original configuration. Since this bending is happening at one end and the spacer is changing length at the other end, the overall chemical structure remains more or less the same except for the flexibility in the middle of the structure. Perhaps, in the future one can add spacer length at the end of the benzene ring to lead to different back relaxation times with respect to the change in the spacer length. A study on this is in progress and will be reported elsewhere.
3.6.3. Device fabrication.
The optical storage device is fabricated using an unsymmetrical dimer CB11AZ (n = 11 which showed the highest conversion efficiency) as the guest molecule and E7, room temperature liquid crystal as the host molecules. Here we mixed 5% of the guest unsymmetrical dimers in 95% of the host E7 molecules. A previously prepared ITO-coated rubbed polyimide cell is filled with the guest–host mixture using capillary action. After filling, a suitable mask is kept on top of the liquid crystal cell and UV light of wavelength 5 mW cm−2 is shined for 2 minutes. After that, the mask was removed and the device was seen through crossed polarizers.
One can see from Fig. 19 that, wherever the mask is protected, liquid crystal molecules remain in the ordered nematic phase (bright state) and wherever UV is exposed to them, they turn to the isotropic phase (dark state). One can clearly see the excellent contrast between the dark and the white states from the unsymmetrical dimers incorporated in the system.
 |
| | Fig. 19 Optical storage device fabricated using CB11AZ, where dimers were used as the guest molecule and the liquid crystal E7 was used as the host molecule. One can see from the device that the exposed region corresponds to the UV illumination (dark state) and the masked region is corresponding to that UV-protected area through the mask (dark state). | |
The current study depicts that, proper tuning of the spacers inside the chemical structure can enhance the device performance drastically and also a strong structure–property relationship is the key to success in the area of optical storage devices.
4. Conclusion
The series CBnAZ demonstrated mesogenic behaviour, characterized by enantiotropic nematic phases and, in certain cases, the presence of monotropic smectic C phases. The study revealed that the length of the flexible spacer significantly influences the thermotropic properties, with longer spacers leading to lower transition temperatures due to increased flexibility and reduced intermolecular forces. The odd–even effect further impacted the mesophase behaviour, where odd-membered dimers, particularly those with n = 3 and n = 5, exhibited lower clearing temperatures and monotropic nematic phase. Interestingly, in the case of n = 11, both nematic and smectic phases were observed, suggesting a diminishing odd–even effect with longer chains. As the chain length increased from n = 8 to n = 12, the emergence of smectic phases became more prominent, indicative of layered structures with long-range positional order, whereas shorter chains predominantly exhibited nematic phases. Additionally, photo-switching studies via UV-visible spectroscopy showed consistent conversion efficiencies of 88–95% across all dimers, highlighting their high sensitivity to UV irradiation along with a thermal back relaxation time of ∼500 minutes (irrespective of the spacer length). These findings underscore the critical role of molecular architecture in determining the mesogenic and photochromic properties of these liquid crystal dimers. An optical storage device was also fabricated showing excellent dark and bright contrast depicting the feasibility of the materials for further investigations.
Data availability
The data supporting this article have been included as part of the ESI.†
Conflicts of interest
The authors declare that they have no known competing financial interests or personal relationships or conflicts of interest that could have appeared to influence the work reported in this paper.
Acknowledgements
The authors (MR and AKP) are thankful to the Head, Department of Chemistry, Faculty of Science, The M. S. University of Baroda for providing laboratory facilities, and DST-FIST for providing NMR, POM, DSC and, elemental analysis facilities. Author GH would like to thank Vision Group on Science and Technology, Government of Karnataka for providing the K-FIST-L2 with grant number GRD-1022.
References
- G. W. Gray, Mol. Cryst., 1969, 7, 127–151 CrossRef CAS.
- R. J. Mandle and J. W. Goodby, RSC Adv., 2016, 6, 34885–34893 RSC.
- D. Dunmur, Crystals, 2022, 12, 309 CrossRef CAS.
- I. Dozov, Europhys. Lett., 2001, 56, 247 CrossRef CAS.
- R. Memmer, Liq. Cryst., 2002, 29, 483–496 CrossRef CAS.
- V. P. Panov, M. Nagaraj, J. K. Vij, Y. P. Panarin, A. Kohlmeier, M. G. Tamba, R. A. Lewis and G. H. Mehl, Phys. Rev. Lett., 2010, 105, 167801 CrossRef CAS PubMed.
- Y. Cao, J. Feng, A. Nallapaneni, Y. Arakawa, K. Zhao, H. Zhang, G. H. Mehl, C. Zhu and F. Liu, J. Mater. Chem. C, 2021, 9, 10020–10028 RSC.
- V. Borshch, Y.-K. Kim, J. Xiang, M. Gao, A. Jákli, V. P. Panov, J. K. Vij, C. T. Imrie, M. G. Tamba, G. H. Mehl and O. D. Lavrentovich, Nat. Commun., 2013, 4, 2635 CrossRef CAS PubMed.
- D. Chen, J. H. Porada, J. B. Hooper, A. Klittnick, Y. Shen, M. R. Tuchband, E. Korblova, D. Bedrov, D. M. Walba, M. A. Glaser, J. E. Maclennan and N. A. Clark, Proc. Natl. Acad. Sci. U. S. A., 2013, 110, 15931–15936 CrossRef CAS PubMed.
- P. K. Challa, V. Borshch, O. Parri, C. T. Imrie, S. N. Sprunt, J. T. Gleeson, O. D. Lavrentovich and A. Jákli, Phys. Rev. E:Stat., Nonlinear, Soft Matter Phys., 2014, 89, 60501 CrossRef CAS PubMed.
- K. Merkel, B. Loska, Y. Arakawa, G. H. Mehl, J. Karcz and A. Kocot, Int. J. Mol. Sci., 2022, 23, 11018 CrossRef CAS PubMed.
- J. Zhou, W. Tang, Y. Arakawa, H. Tsuji and S. Aya, Phys. Chem. Chem. Phys., 2020, 22, 9593–9599 RSC.
- M. P. Kumar, P. Kula and S. Dhara, Phys. Rev. Mater., 2020, 4, 115601 CrossRef CAS.
- N. Sebastián, D. O. López, B. Robles-Hernández, M. R. de la Fuente, J. Salud, M. A. Pérez-Jubindo, D. A. Dunmur, G. R. Luckhurst and D. J. B. Jackson, Phys. Chem. Chem. Phys., 2014, 16, 21391–21406 RSC.
- T. Ivšić, M. Vinković, U. Baumeister, A. Mikleušević and A. Lesac, RSC Adv., 2016, 6, 5000–5007 RSC.
- C. T. Archbold, E. J. Davis, R. J. Mandle, S. J. Cowling and J. W. Goodby, Soft Matter, 2015, 11, 7547–7557 RSC.
- K. Adlem, M. Čopič, G. R. Luckhurst, A. Mertelj, O. Parri, R. M. Richardson, B. D. Snow, B. A. Timimi, R. P. Tuffin and D. Wilkes, Phys. Rev. E:Stat., Nonlinear, Soft Matter Phys., 2013, 88, 22503 CrossRef CAS PubMed.
- D. A. Paterson, M. Gao, Y.-K. Kim, A. Jamali, K. L. Finley, B. Robles-Hernández, S. Diez-Berart, J. Salud, M. R. de la Fuente, B. A. Timimi, H. Zimmermann, C. Greco, A. Ferrarini, J. M. D. Storey, D. O. López, O. D. Lavrentovich, G. R. Luckhurst and C. T. Imrie, Soft Matter, 2016, 12, 6827–6840 RSC.
- Z. Lu, P. A. Henderson, B. J. A. Paterson and C. T. Imrie, Liq. Cryst., 2014, 41, 471–483 CrossRef CAS.
- R. J. Mandle, E. J. Davis, S. A. Lobato, C.-C. A. Vol, S. J. Cowling and J. W. Goodby, Phys. Chem. Chem. Phys., 2014, 16, 6907–6915 RSC.
- R. J. Mandle, C. C. A. Voll, D. J. Lewis and J. W. Goodby, Liq. Cryst., 2016, 43, 13–21 CrossRef CAS.
- A. A. Dawood, M. C. Grossel, G. R. Luckhurst, R. M. Richardson, B. A. Timimi, N. J. Wells and Y. Z. Yousif, Liq. Cryst., 2017, 44, 106–126 CAS.
- Y. Arakawa, K. Komatsu, T. Shiba and H. Tsuji, Mater. Adv., 2021, 2, 1760–1773 RSC.
- D. Wang, J. Liu, W. Zhao, Y. Zeng, J. Huang, J. Fang and D. Chen, Chem. - Eur. J., 2022, 28(70), e202202146 CrossRef CAS PubMed.
- Y. Arakawa, Y. Ishida and H. Tsuji, Chem. - Eur. J., 2020, 26, 3787 Search PubMed.
- Y. Arakawa, K. Komatsu, Y. Ishida and H. Tsuji, Liq. Cryst., 2021, 48, 641–652 CrossRef CAS.
- D. A. Paterson, R. Walker, J. M. D. Storey and C. T. Imrie, Liq. Cryst., 2023, 50, 725–736 CrossRef CAS.
- D. A. Paterson, R. Walker, J. P. Abberley, J. Forestier, W. T. A. Harrison, J. M. D. Storey, D. Pociecha, E. Gorecka and C. T. Imrie, Liq. Cryst., 2017, 44, 2060–2078 CAS.
- D. S. Kumari, A. Shetty, B. S. Ranjitha, M. Vandana, G. Shanker, M. Alaasar and G. Hegde, Heliyon, 2024, 10, e37455 CrossRef PubMed.
- M. L. Rahman, T. Xin Ting, M. S. Sarjadi, S. E. Arshad, S. Soloi, Z. Jamain, M. H. Abd Majid and G. Hedge, J. Macromol. Sci., Part A:Pure Appl. Chem., 2024, 61, 40–52 CrossRef CAS.
- B. S. Ranjitha, D. Sandhya Kumari, A. Shetty, G. Shanker, M. Alaasar, R. Pashameah and G. Hegde, J. Mol. Liq., 2023, 383, 121985 CrossRef CAS.
- J. M. Shivanna, M. Alaasar and G. Hegde, J. Mol. Liq., 2021, 341, 117341 CrossRef CAS.
- B. N. Sunil, M. Monika, G. Shanker, G. Hegde and V. Prasad, Front. Phys., 2021, 9, 728632 CrossRef.
- S. M. Gan, A. R. Yuvaraj, M. R. Lutfor, M. Y. Mashitah and H. Gurumurthy, RSC Adv., 2015, 5, 6279–6285 RSC.
- G. Hegde, G. Shanker, S. M. Gan, A. R. Yuvaraj, S. Mahmood and U. K. Mandal, Liq. Cryst., 2016, 43, 1578–1588 CrossRef CAS.
- M. Rabari and A. K. Prajapati, J. Mol. Struct., 2024, 1307, 137971 CrossRef CAS.
- M. Rabari and A. K. Prajapati, J. Mol. Struct., 2024, 1308, 138101 CrossRef CAS.
- M. Rabari, R. S. Kumar
CH and A. K. Prajapati, J. Mol. Struct., 2023, 1293, 136252 CrossRef CAS.
- J. P. Cornard, L. Dangleterre and C. Lapouge, J. Phys. Chem. A, 2005, 109, 10044–10051 CrossRef CAS PubMed.
- S. Sundaram, V. N. Vijayakumar and V. Balasubramanian, Comput. Theor. Chem., 2022, 1217, 113920 CrossRef CAS.
- M. J. Sani, Comput. Theor. Chem., 2023, 1223, 114100 CrossRef CAS.
- R. Kumar Yadav, B. Yadav and R. A. Yadav, Comput. Theor. Chem., 2023, 1228, 114264 CrossRef CAS.
-
L. Piela, Ideas of Quantum Chemistry, Elsevier, 2020, 3rd edn, pp. 191–252 Search PubMed.
- H. Henschel, A. T. Andersson, W. Jespers, M. Mehdi Ghahremanpour and D. van der Spoel, J. Chem. Theory Comput., 2020, 16, 3307–3315 CrossRef CAS PubMed.
|
| This journal is © The Royal Society of Chemistry 2025 |
Click here to see how this site uses Cookies. View our privacy policy here. 
 Open Access Article
 This Open Access Article is licensed under a Creative Commons Attribution-Non Commercial 3.0 Unported Licence
 *bc and
A. K.
Prajapati
*bc and
A. K.
Prajapati