
Fe–Co heteronuclear atom pairs as catalytic sites for efficient oxygen electroreduction†
Zhen
Sun
ab,
Ruijie
Gao
 *ab,
Fan
Liu
ab,
Hao
Li
ab,
Chengxiang
Shi
ab,
Lun
Pan
ab,
Zhen-Feng
Huang
*ab,
Xiangwen
Zhang
ab and
Ji-Jun
Zou
*ab
*ab,
Fan
Liu
ab,
Hao
Li
ab,
Chengxiang
Shi
ab,
Lun
Pan
ab,
Zhen-Feng
Huang
*ab,
Xiangwen
Zhang
ab and
Ji-Jun
Zou
*ab
aKey Laboratory for Green Chemical Technology of the Ministry of Education, School of Chemical Engineering and Technology, Institute of Molecular Plus, Tianjin University, Tianjin 300072, China
bCollaborative Innovative Center of Chemical Science and Engineering (Tianjin), Tianjin 300072, China. E-mail: gaoruijie@tju.edu.cn; zfhuang@tju.edu.cn; jj-zou@tju.edu.cn
First published on 22nd April 2024
Abstract
Single-site Fe–N–C catalysts are the most promising Pt-group catalyst alternatives for the oxygen reduction reaction, but their application is impeded by their relatively low activity and unsatisfactory stability as well as production costs. Here, cobalt atoms are introduced into an Fe–N–C catalyst to enhance its catalytic activity by utilizing the synergistic effect between Fe and Co atoms. Meanwhile, phenanthroline is employed as the ligand, which favours stable pyridinic N-coordinated Fe–Co sites. The obtained catalysts exhibit excellent ORR performance with a half-wave potential of 0.892 V and good stability under alkaline conditions. In addition, the excellent ORR activity and durability of FeCo–N–C enabled the constructed zinc–air battery to exhibit a high power density of 247.93 mW cm−2 and a high capacity of 768.59 mA h gZn−1. Moreover, the AEMFC based on FeCo–N–C also achieved a high open circuit voltage (0.95 V) and rated power density (444.7 mW cm−2), surpassing those of many currently reported transition metal-based cathodes. This work emphasizes the feasibility of this non-precious metal catalyst preparation strategy and its practical applicability in fuel cells and metal–air batteries.
1 Introduction
The consumption of fossil fuels (oil, coal, natural gas) not only causes resource crises, but also seriously endangers the natural environment and human health.1–7 Among the new generation of energy conversion and output devices, zinc–air batteries (ZABs) and fuel cells have attracted much attention due to their high power density and environmental friendliness.8–10 The key shared cathode reaction is the oxygen reduction reaction (ORR) and its overall efficiency is severely limited by slow kinetics and high O2 activation barriers.11–14 Although platinum-based catalysts are recognized as the most effective electrocatalysts for the ORR, their high material cost and low stability limit their large-scale application. Therefore, it is very necessary to find a high-performance, high stability and low-cost alternative.Until now, Fe–N–C catalysts have shown high ORR electrochemical performance.15–21 However, it is difficult to break the scaling relationship between intermediates over a single active site. In addition, the demetallation of Fe–N–C catalysts caused by Fe–N bond cleavage during the ORR is the main reason for their low stability22–26 and reducing the O2 activation energy is expected to improve their stability. So introducing a more stable but less active metal into the active center and transforming it into a heteronuclear atom pair can cooperatively change the pathway of catalytic reactions and reduce reaction energy barriers, which improves the activity and stability of the catalyst.27–31 Additionally, using phenanthroline to construct pyridinic N-coordinated MN4C10-type catalytic sites may further improve the anti-demetallization performance of the catalyst and maintain its stability.32–34 Furthermore, from the application perspective, using phenanthroline as a ligand can further improve the production of M–N–C catalysts compared to the pyrolysis of other metal–organic precursors.35–41
Herein, we successfully synthesized a heteronuclear Fe–Co dual-metal catalytic pair (FeCo–N–C) using a preheating strategy where ferric chloride and cobalt chloride were used as metal precursors, and phenanthroline was used as the metal-anchoring agent. After performing high-angle dark field scanning transmission electron microscopy (HAADF-STEM) and X-ray absorption (XAS) spectral analysis, it was confirmed that Fe and Co atoms are atomically dispersed and coupled with nitrogen-doped carbon. The synthesized FeCo–N–C catalyst exhibits excellent ORR performance and stability under alkaline conditions (E1/2 = 0.892 V, Eonset = 1.08 V, stable operation for 100 h at 0.8 V), surpassing those of Fe–N–C, Co–N–C and commercial Pt/C catalysts. The excellent ORR activity of this catalyst also enables the constructed zinc–air battery to exhibit a great power density of 247.93 mW cm−2 and a high capacity of 768.59 mA h gZn−1, and it also delivers a superior performance in H2/O2 anion exchange membrane fuel cells. This study provides a convenient and feasible way for the large-scale synthesis of efficient ORR catalysts.
2 Experimental section
2.1 Chemicals
Methanol (≥99.9%) and Nafion solution (∼5 wt%) were purchased from Sigma Aldrich. 1,10-Phenanthroline and ferrous chloride tetrahydrate were obtained from Meryer in Shanghai. Cobalt chloride was purchased from Shanghai Macklin Co., Ltd. Cabot Vulcan XC72 was produced by Cabot Company. Ketjen black and other types of porous carbon were produced by Guangdong Canrd New Energy Technology Co., Ltd. Commercial Pt/C was purchased from E-TEK. All experiments were conducted using high-purity water (18.25 MΩ cm) provided by a Milli-q Gradient A10 system. All chemicals were used as received.2.2 Catalyst synthesis
First, 32 mg of FeCl2·4H2O, 5.2 mg of CoCl2 and 200 mg of carbon black (Ketjen black ECP-600JD) were added to 9 mL of methanol as solution A, while 108 mg of 1,10-phenanthroline was dissolved in 1 mL of methanol as solution B. Then, the solutions were subjected to ultrasound separately for 20 minutes to ensure uniform dispersion; afterwards, solution B was added to solution A and the ultrasound treatment was continued for 120 minutes. Thereafter, the reaction solution was directly vacuum rotary evaporated until the solvent disappeared and the product finally dried in a vacuum at 60 °C overnight. After cooling to room temperature, the prepared sample was placed in a corundum ark under argon gas conditions. First, it was heated to 150 °C at a heating rate of 5 °C min−1 and kept for 1 hour at a constant temperature. Next, the temperature was continually increased to 800 °C at a heating rate of 5 °C min−1 and kept for 1 hour. After naturally cooling to room temperature, the catalyst was collected and labelled as FeCo–N–C. After weighing, the catalyst prepared by this method can achieve a mass of over 220 mg (Fig. S1, ESI†).Individual Fe–N–C and Co–N–C catalysts were synthesized using the same method, except that Fe–N–C was prepared with 40 mg of FeCl2·4H2O and Co–N–C was prepared with 26 mg of CoCl2. Considering the metal salts and carbon black in the experiment may have an impact on the performance of the catalyst, other types of metal salts and carbon black were also used in the experiment. The specific experimental results and conclusions can be seen in the ESI.†
3 Results and discussion
3.1 Catalyst synthesis and structural characterization
FeCo–N–C was synthesized using a preheating strategy.31 After optimizing various influencing factors involved in the experiment, the catalyst with the best performance was selected as the research object (Fig. S20–S27, ESI†). The scanning electron microscopy (SEM) image of FeCo–N–C shows that the morphology of the FeCo–N–C catalyst remained basically the same as that of carbon black ECP-600JD after loading and pyrolysis (Fig. 1a and Fig. S2, ESI†). In addition, the chain-shaped spherical structure of the carbon black substrate also provides a rich surface for loading the metal–phenanthroline precursor (named M-phen). Transmission electron microscopy (TEM) images (Fig. 1b and c) show that the catalyst surface was almost entirely composed of onion-like graphite carbon layers, and no obvious metal nanoparticles were observed. The inset of Fig. 1c is a selected area electron diffraction (SAED) image showing two typical electron diffraction rings, belonging to the (002) and (101) crystal planes of graphite carbon, respectively, indicating a certain degree of graphitization of carbon in the FeCo–N–C catalyst. Meanwhile, energy dispersive X-ray spectroscopy (EDS) mappings confirmed the even distribution of Fe and Co elements in the FeCo–N–C catalyst (Fig. 1d). Similar TEM and selected area electron diffraction images were also detected in the Fe–N–C and Co–N–C catalysts obtained by the same preparation method (Fig. S3–S6, ESI†), demonstrating the feasibility of this method to synthesize M–N–C catalysts with good metal dispersibility. As a comparison, the TEM images of the catalyst without preheating treatment (Fe@Fe–N–C) show clear lattice stripes, while many bright spots observed in its SAED proved the existence of metal particles in the material (Fig. S7, ESI†). | ||
| Fig. 1 (a) SEM image of FeCo–N–C. (b and c) TEM and SAED (inset) images of FeCo–N–C. (d) HAADF-STEM and the corresponding elemental mapping images of FeCo–N–C. (e) Aberration-corrected HAADF-STEM image of FeCo–N–C, where some Fe–Co diatomic sites are highlighted by red circles (the red circles 1, 2 and 3 are partially enlarged on the right). (f) Intensity profiles of the three numbered sites in (e). | ||
It is worth noting that the preheating treatment is the key step to avoid metal aggregation demonstrated by melting point and thermogravimetric (TG) measurements conducted on pure Fe-phen and the precursor Fe-phen@C. The capillary method was used for the melting point meter test (Fig. S8, ESI†), and the results show that the melting point of Fe-phen is around 90 °C. The thermogravimetric measurement results (Fig. S9, ESI†) only show a significant mass loss area approximately between 200 and 320 °C, suggesting that the melting process of M-phen occurs before 200 °C so that there is basically no significant mass loss, while the mass loss after 200 °C is caused by the decomposition process of M-phen molecules. Therefore, selecting the preheating temperature between the melting and decomposition points of M-phen can ensure that the M-phen molecules adsorbed on carbon black melt in a structurally intact manner. At this temperature, maintaining a constant temperature for a period of time allows the material to continue to melt and prevent the stacking of M-phen molecules during the adsorption process, thereby avoiding the aggregation of a large number of metal ions that exist locally during the subsequent high-temperature calcination process.
Aberration-corrected high-angle annular dark field scanning transmission electron microscopy (AC HAADF-STEM) was carried out to observe the detailed structure of FeCo–N–C. As illustrated in Fig. 1e, highlights representing metal atoms are evenly dispersed on the carbon layer. The presence of paired metal atoms can also be clearly observed and are highlighted in red circles, indicating that the diatomic catalyst pair has been successfully synthesized. Meanwhile, the distance between adjacent atoms in the red circles (Fig. 1f and Fig. S10, ESI†) is about 2.5 Å. Furthermore, it is worth noting that the intensity of atoms in the HAADF-STEM images largely depends on their atomic number (Z).42,43 After analyzing the intensity of the atomic pair region, we found that the two types of atoms in the atomic pair have different intensities, thus indicating that the atomic pair is a heteronuclear atomic pair.
In order to further obtain the phase composition of the FeCo–N–C catalyst, X-ray diffraction (XRD) characterization was also performed. The synthesized Fe–N–C, Co-N–C, and FeCo–N–C exhibited similar XRD diffraction patterns (Fig. 2a) with two typical diffraction peaks between 20–30° and 40–50°, respectively, attributed to the (002) and (101) crystal planes of graphite carbon (JCPDS No. 41-1487). Moreover, no signals of metals, metal carbides or oxides were found, indicating that the Fe and/or Co atoms are highly dispersed. In addition, the Raman spectra exhibit D bands (attributed to defect carbon) and G bands (attributed to graphite carbon) at 1340–1350 cm−1 and 1580–1600 cm−1 (Fig. 2b), indicating that all catalysts possess certain defect state characteristics. According to the intensity ratio of D-band to G-band (ID/IG), the degree of graphitization of different samples can be compared. The value of ID/IG decreases in the following order: ECP-600JD (1.24) > Fe–N–C (1.01) > FeCo–N–C (0.98) > Co–N–C (0.91); an ID/IG value of around 1 means that there are many defects while ensuring high conductivity. Additionally, it can also be found that the addition of Fe and Co atoms deceases the ID/IG value, indicating that increased graphitization will enhance the conductivity of the catalyst and improve the catalytic activity.
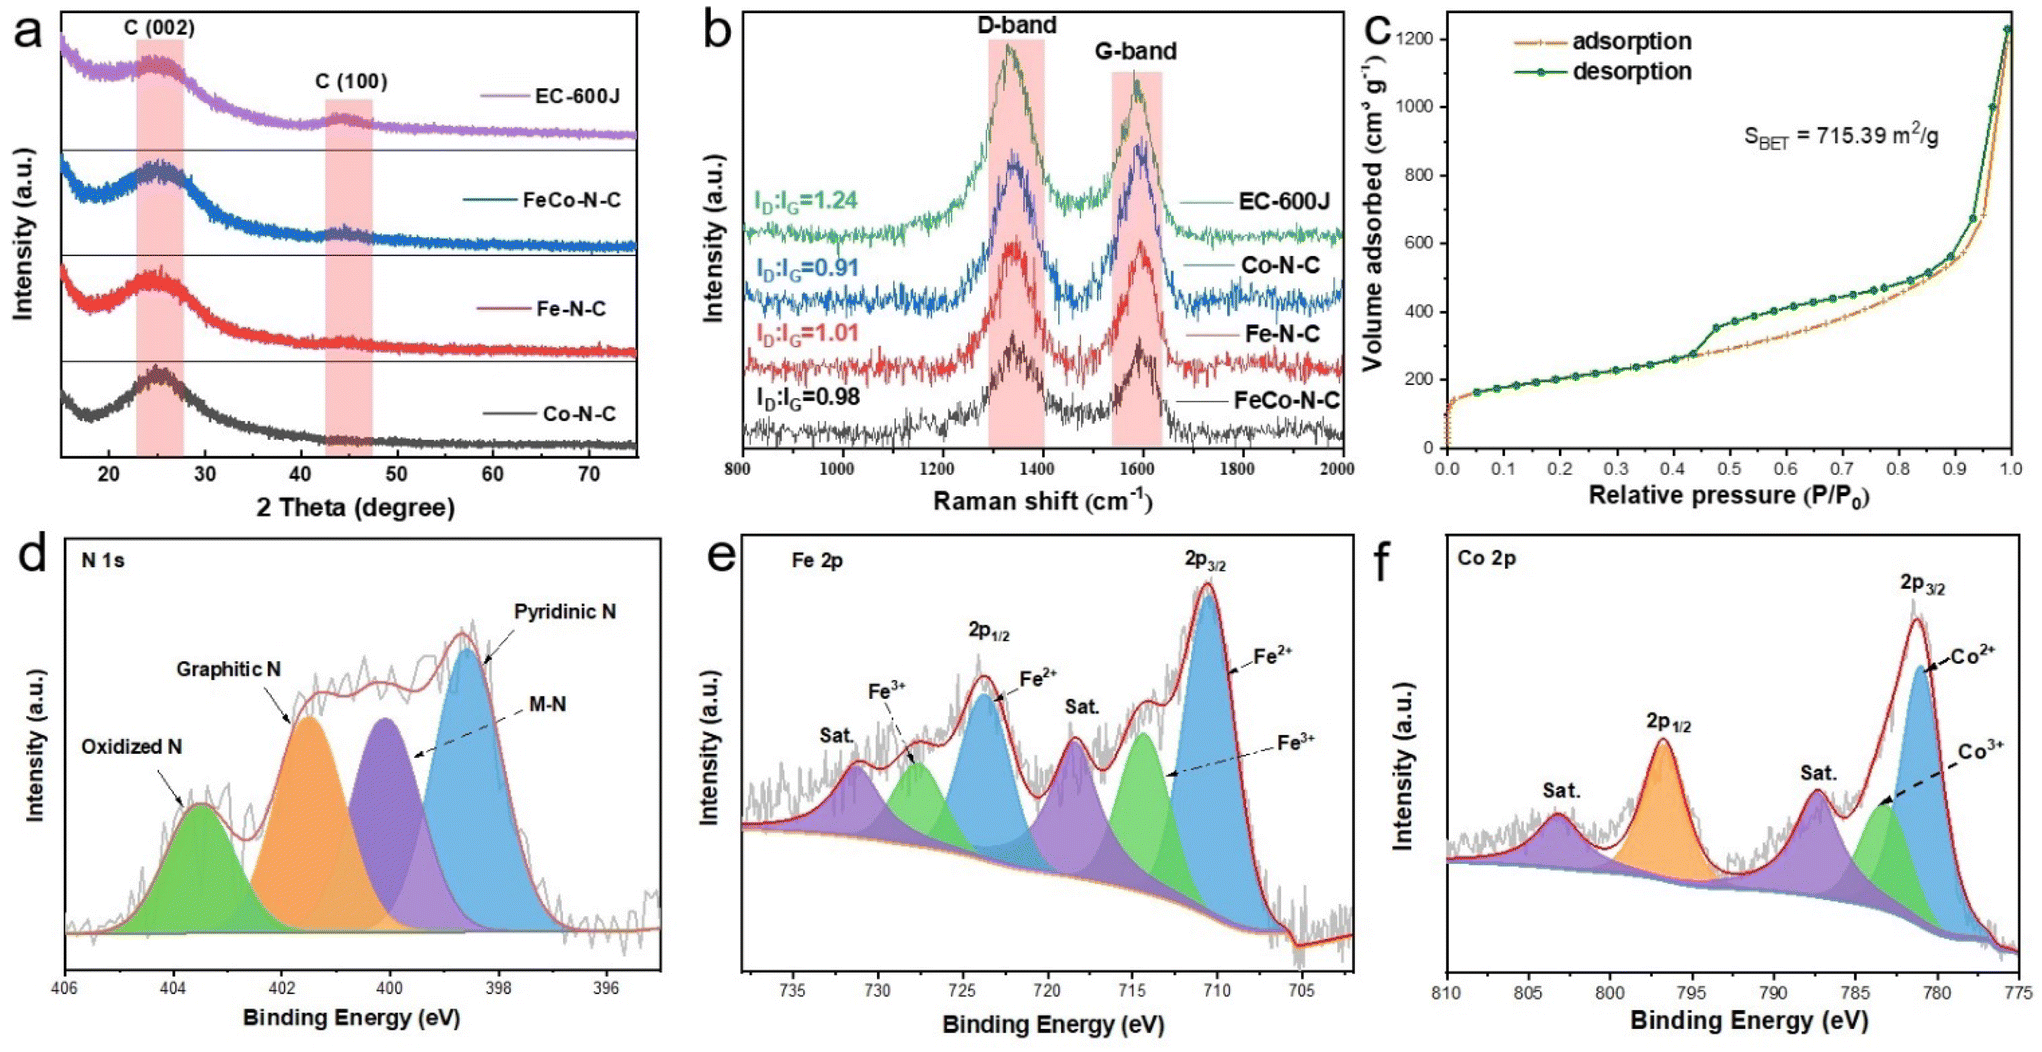 | ||
| Fig. 2 (a) XRD patterns and (b) Raman spectra of FeCo–N–C. (c) N2 adsorption–desorption isotherm curve and pore size distribution of FeCo–N–C. (d) N 1s, (e) Fe 2p and (f) Co 2p XPS spectra of FeCo–N–C. | ||
The surface area and pore volume of the catalysts were determined from N2 adsorption/desorption isotherms. As shown in Fig. 2c, the FeCo–N–C catalyst exhibited H4-type isotherms and type IV hysteresis loops, and its specific surface area was 715.38 m2 g−1. As shown in Fig. S11 (ESI†), the pore size distribution curve showed pore sizes ranging from 0.5 to 10 nm, demonstrating the coexistence of micropores and mesopores. As a result, the large specific surface area and rich pore structure allow the catalyst to expose more catalytic sites, which is conducive to the progress of the reaction. X-ray photoelectron spectroscopy (XPS) was also used to determine the elemental composition and bond energy state of the catalyst surface. The binding energy position of N element electrons (Fig. 2d) is divided into pyridinic N (398.6 eV), M–N (400.1 eV), graphitic N (401.5 eV), and oxidized N (403.5 eV), respectively. Among them, the content of pyridinic N is 33.4%, and the high content of pyridinic N provides sufficient anchoring points for metal sites in these catalysts, demonstrating the important role of phenanthroline. As shown in the high-resolution Fe 2p (Fig. 2e) and Co 2p XPS spectra (Fig. 3f), Fe 2p3/2 and Fe 2p1/2 are located at 710.68 and 723.78 eV, respectively, and Co 2p3/2 and Co 2p1/2 are located at 781.1 and 796.7 eV, respectively, and both of them are accompanied by satellite peaks. Through deconvolution of the peaks, the presence of Fe0 and Co0 was not found, which is consistent with the results of TEM and XRD. At the same time, a small amount of Fe and Co elements exist in the form of Fe3+ and Co3+ in FeCo–N–C.
 | ||
| Fig. 3 (a) Fe K-edge XANES spectra of FeCo–N–C, Fe2O3, FePc and Fe foil. (b) Fourier transform EXAFS spectra at the R-space of Fe. (d) Co K-edge XANES spectra of FeCo–N–C, Co2O3, CoPc and Co foil. (e) Fourier transform EXAFS spectra at the R-space of Co. Fitting curves in the R-space for (c) Fe and (f) Co. (g) WT k3-weighted EXAFS spectra and the corresponding metal foil reference. | ||
X-ray absorption structure (XAS) analysis was performed to further reveal the local coordination geometry and electronic states of Fe and Co single atoms in FeCo–N–C.44 As shown in Fig. 3a, the K-edge position of Fe in FeCo–N–C is located between Fe2O3 and FePc, indicating that the valence state of Fe is between +2 and +3. Compared with FePc, the significant positive shift of the absorption edge indicates a change in the electronic structure of the atomic Fe site, which is also confirmed by the Fe 2p XPS spectrum. The dominant peak at approximately 1.5 Å in the Fourier transform (FT) spectra of the FeCo–N–C samples (Fig. 3b) can be regarded as the Fe–N coordination peak, and the significant peak at 2.4 Å provides evidence for possible Fe–Co bonding. In addition, the absence of Fe–Fe coordination peaks (2.25 Å) and Fe–O coordination peaks (1.3 Å) in FeCo–N–C indicates the absence of iron clusters and oxides in the catalyst. In addition, the XAS spectrum of the FeCo–N–C catalyst (Fig. 3d) shows that the K-edge position of Co in the catalyst is located between CoPc and Co foil, indicating that the valence state of Co in the catalyst is between 0 and +2, which is consistent with subsequent test results. Besides, the peaks located at 2.38 Å and 1.49 Å in the R-space (Fig. 3e) point towards Co–Fe and Co–N in the XAS of Co, respectively, and no significant Co–Co coordination peaks (∼2.24 Å) are detected. Meanwhile, FeCo–N–C shows the WT-maximum with k values of the Fe–N path and the Co–N path at around 4.9 Å−1 and 6 Å−1, respectively (as shown in Fig. 3g), which are significantly different from metal foils and phthalocyanine metals (Fig. S12, ESI†). The K-edge XAS fitting curve and fitting results of Fe are shown in Fig. 3c and Table S1 (ESI†). The coordination numbers of Fe–N and Fe–Co are 2.9 and 1.1, respectively, indicating that most Fe atoms form atomic pair structures with adjacent Co atoms.45 As for Co species, Co atoms mainly bind to adjacent Fe atoms and the surrounding three N atoms (Fig. 3f and Table S2, ESI†). The coordination numbers of Co–N and Co–Fe are 3.0 and 1.0, respectively. At the same time, in order to further determine the coordination structure of catalytic sites, we calculated the K-edge absorption spectra of Fe and Co in FeCoN6 atomic pairs using FDMNES with Fe and Co as the core radiating radii based on the results of synchrotron radiation fitting and DFT-optimized models. As shown in Fig. S13 (ESI†), the theoretical radiation spectrum obtained through simulation is almost identical to the experimental K-edge absorption spectra of Fe and Co, and correctly reproduces the white line and back edge features. These simulations clearly indicate that a single metal center has three N atoms in the first coordination sphere and one metal atom in the second coordination sphere (as shown in the structural model in Fig. S13a, ESI†), which is completely consistent with the XAS results.46 Besides, the fitted bond length of the Fe–Co path (∼2.58 Å) in FeCo–N–C is consistent with the statistical distance of Fe and Co atoms in AC HAADF-STEM. The low Co content in FeCo–N–C results in a longer fitted Co–Fe bond (Tables S1and S2, ESI†).
3.2 ORR performance
In order to study the electrochemical ORR performance of FeCo–N–C, we conducted electrochemical tests using an RDE. Fig. 4a shows the cyclic voltammetry (CV) curves of FeCo–N–C and Pt/C in O2- and N2-saturated solutions. In 0.1 mol L−1 KOH electrolyte saturated with N2, there is no cathodic reduction peak. A significant cathodic oxygen reduction peak in the O2-saturated electrolyte indicates that FeCo–N–C has a catalytic oxidation effect on O2. As shown in Fig. 4b, FeCo–N–C exhibits the best electrochemical activity with initial and half-wave potentials of 1.08 V and 0.892 V (vs. RHE), respectively, outperforming those of Fe–N–C (E1/2 = 0.874 V, Eonset = 1.04 V), Co–N–C (E1/2 = 0.816 V, Eonset = 0.949 V), Pt/C catalysts (E1/2 = 0.858 V, Eonset = 1.005 V) and most other non-noble metal catalysts (Fig. 4c and Table S8, ESI†). Moreover, the activity of the physical mixture Fe + Co-mix (E1/2 = 0.833 V, Eonset = 0.961 V) is between that of Fe–N–C and Co–N–C, indicating that the synergistic effect between the two metal sites in FeCo–N–C improves the catalytic activity. | ||
| Fig. 4 (a) CV curves of 20% Pt/C, FeCo–N–C, Fe–N–C and Co–N–C in N2-saturated (dashed line) or O2-saturated (solid line) 0.1 M KOH solution. (b) LSV curves of 20% Pt/C, FeCo–N–C, Fe–N–C, Co–N–C and Fe + Co-mix. (c) Comparison of the E1/2 and Eonset values of FeCo–N–C with those of previously reported catalysts. (d) H2O2 yield and n of FeCo–N–C and 20% Pt/C. (e) Durability tests of 20% Pt/C, FeCo–N–C, Fe–N–C and Co–N–C at −0.8 V vs. RHE. (f) Tafel slopes of 20% Pt/C, FeCo–N–C, Fe–N–C, Co–N–C and N–C. | ||
In order to illustrate the electron transfer number (n) of FeCo–N–C, we recorded the LSV curves at different speeds and obtained K–L plots. As shown in Fig. S14 (ESI†), the corresponding K–L plot has a good linear relationship with a calculated electron transfer number n = 3.8 at 0.6 V in an alkaline medium, indicating that the reaction process is a four-electron O2 reduction pathway. As shown in Fig. 4d, the rotating ring disk electrode (RRDE) test result shows that when the potential is higher than the equilibrium potential of O2 reduction to HO2− (0.682 V), the electron transfer number is higher than 3.95. With the negative potential sweep (below 0.682 V), the n of FeCo–N–C from RRDE results is almost the same as that of 20% Pt/C, indicating that the FeCo–N–C catalyst has high four-electron selectivity.
To assess stability, an accelerated durability test (ADT) was performed by continuously cycling the FeCo–N–C catalyst between 0.6 and 1.0 V. As shown in Fig. S15 (ESI†), the half-wave potential of FeCo–N–C reveals a reduction of only 11 mV after 5000 cycles, better than that of Pt/C (38 mV). Besides, a chronoamperometric response at 0.80 V under an O2-saturated atmosphere was used to assess the catalyst's long-term stability. The time–current response curves of FeCo-N–C and commercial Pt/C are shown in Fig. 4e. After running for 80![[thin space (1/6-em)]](https://www.rsc.org/images/entities/char_2009.gif) 000 seconds, the current density loss of commercial Pt/C electrodes reaches 31.2%, whereas FeCo–N–C maintains up to 97.9% of its initial current with high stability. In addition, FeCo–N–C was also subjected to longer stability tests, and its current retention rate can still remain at over 90% after 100 hours of testing at 0.8 V under alkaline conditions (as shown in Fig. S16, ESI†). The TEM images, XRD patterns, and Raman spectra obtained after 100 hours of stability testing are shown in Fig. S17–S19 (ESI†). The above characterization of FeCo–N–C after catalysis did not show significant changes, indicating that the structure of the catalyst is well preserved. The Tafel slopes further confirm the excellent ORR kinetics of FeCo–N–C, as shown in Fig. 4f. The Tafel slopes of FeCo–N–C, 20% Pt/C, Fe–N–C and Co-N–C are 65.9, 68.0, 78.0 and 85.1 mV dec−1, respectively, indicating that FeCo–N–C has more favorable ORR kinetics compared to that of Fe–N–C and Co–N–C.
000 seconds, the current density loss of commercial Pt/C electrodes reaches 31.2%, whereas FeCo–N–C maintains up to 97.9% of its initial current with high stability. In addition, FeCo–N–C was also subjected to longer stability tests, and its current retention rate can still remain at over 90% after 100 hours of testing at 0.8 V under alkaline conditions (as shown in Fig. S16, ESI†). The TEM images, XRD patterns, and Raman spectra obtained after 100 hours of stability testing are shown in Fig. S17–S19 (ESI†). The above characterization of FeCo–N–C after catalysis did not show significant changes, indicating that the structure of the catalyst is well preserved. The Tafel slopes further confirm the excellent ORR kinetics of FeCo–N–C, as shown in Fig. 4f. The Tafel slopes of FeCo–N–C, 20% Pt/C, Fe–N–C and Co-N–C are 65.9, 68.0, 78.0 and 85.1 mV dec−1, respectively, indicating that FeCo–N–C has more favorable ORR kinetics compared to that of Fe–N–C and Co–N–C.
3.3 Zn–air battery and AEMFC performance
Considering the excellent ORR activity of the prepared FeCo–N–C catalyst, the obtained catalyst was used as a positive electrode material for assembling a ZAB to demonstrate its practical application value. As shown in Fig. 5a, the ZAB in the laboratory was assembled by using the FeCo–N–C catalyst cathode and a zinc plate anode in 6 M KOH solution. At the same time, commercial catalysts and other catalysts prepared in this article were also assembled for comparison. As shown in Fig. 5b, the FeCo–N–C-based ZAB has a stable open circuit voltage (OCV) of approximately 1.52 V, which is higher than that of a commercial 20% Pt/C-based ZAB (1.5 V), and within a testing time of 20 hours (Fig. S30, ESI†), the OCV can be maintained above 1.51 V, demonstrating its good stability. According to the polarization curve and the corresponding power density curve in Fig. 5c, it can be seen that the maximum power density of the FeCo–N–C-based ZAB (247.93 mW cm−2) has increased by 1.76 times compared to that of commercial Pt/C (140.5 mW cm−2), and is significantly higher than that of the batteries assembled with Fe–N–C and Co–N–C prepared in this article (Fig. S29, ESI†). This result indicates that the prepared FeCo–N–C catalyst has good discharge ability. In addition, the zinc–air battery assembled based on FeCo–N–C exhibits almost linear polarization curves in the low current density and high current density regions, exhibiting good mass transfer characteristics (i.e. low concentration polarization).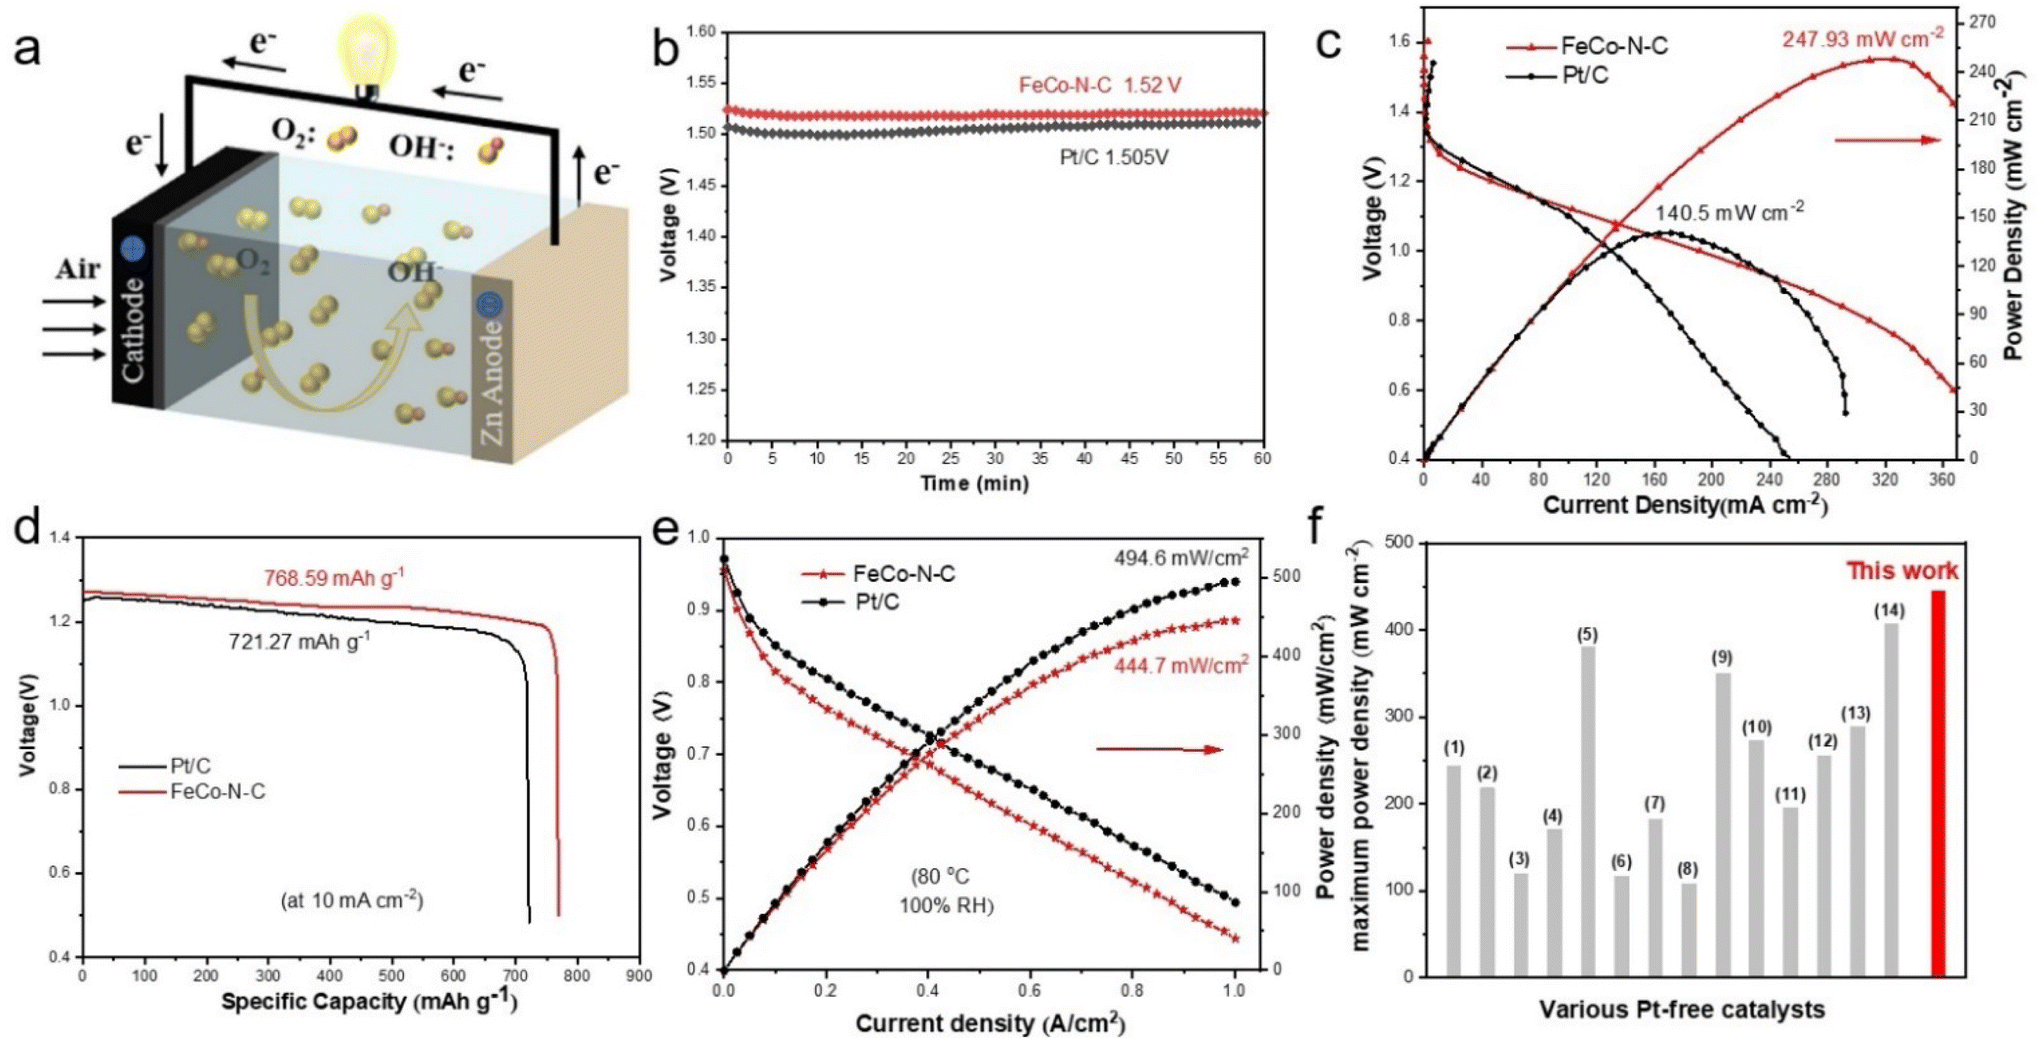 | ||
| Fig. 5 (a) Device diagram of the Zn–air battery. (b) Open-circuit potential (OCP) of the ZAB based on FeCo–N–C and the 20% Pt/C catalysts. (c) Polarization curves and power density of the assembled ZAB. (d) Specific capacity of the assembled ZAB. (e) Discharging polarization curves and the corresponding power density plots of the AEMFC with FeCo–N–C and Pt/C catalysts. (f) Comparison of the AEMFC performance of FeCo–N–C with that of reported Pt-free catalysts. | ||
The discharge capacity of the ZAB was also tested using a constant current discharge method with a discharge density of 10 mA cm−2, as shown in Fig. 5d. The discharge profile of the FeCo–N–C-based ZAB can be maintained above 1.23 V and can discharge continuously for 17.3 hours, which is higher than that of the ZAB using Pt/C as catalyst. After normalizing the discharge capacity based on the mass of zinc consumed during the discharge process, the specific capacity of the ZAB using FeCo–N–C as catalyst is 768.59 mA h gZn−1, corresponding to an energy density of 950.39 W h kgZn1, which is higher than that of the ZAB using Pt/C as a catalyst (721.27 mA h gZn−1, 865.52 W h kgZn−1). From this, it can be seen that the assembly of the ZAB with FeCo–N–C catalysts has great practical application potential. In order to obtain more intuitive test results, we used the assembled batteries and a 1.5 V LED lamp to form a circuit. As shown in Fig. S28 (ESI†), only a battery assembled with the FeCo–N–C catalyst can make the LED glow, while a battery assembled with Pt/C cannot illuminate the LED. This is precisely because batteries assembled with FeCo–N–C catalysts have a higher open circuit voltage. This also proved the feasibility of FeCo–N–C catalysts in device applications. To further demonstrate its practicality in energy conversion equipment, FeCo–N–C was also used in an H2/O2 fuel cell (Fig. S31, ESI†). The performances of anion exchange membrane fuel cells (AEMFCs) were measured, and the results are shown in Fig. 5e. The FeCo–N–C cathode generates an excellent rated power density (Pmax) of 444.7 mW cm−2 and an open-circuit voltage of 0.95 V, exceeding those values of other reported Pt-free catalysts (Fig. 5f and Table S9, ESI†).
3.4 In situ SR-FTIR analysis
In order to gain a deep understanding of the mechanism of oxygen reduction in FeCo–N–C, we conducted spectral analysis using in situ attenuated total reflection surface enhanced infrared absorption (ATR-SIRAS). As shown in Fig. 6a, the absorption vibration at 1090 cm−1 is attributed to *OO* intermediate substances,47–49 and statistical analysis was further conducted on the intensity of vibration peaks at different applied voltages (Fig. 6c). When the ORR voltage exceeds 0.7 V, the *OO* peak intensity rapidly increases and gradually decreases after exceeding a certain voltage. Besides, no other intermediates are observed during the reaction process, indicating that the Fe–Co dual sites generate the key intermediate O–O and forms an Fe–O–O–Co structure during the ORR process.42,50 As a reference (Fig. 6b), the spectrum of Fe–N–C shows a newly formed peak located at 1010 cm−1, indicating the formation of *OOH on Fe sites. The detailed scheme of the reaction mechanism pathway at the heteronuclear atom pair sites is summarized in Fig. 6d. The above results prove that the Fe–Co dual site can accelerate the direct cleavage of O–O bonds and bypass the generation of *OOH intermediates,43,51,52 which can lower the reaction energy barrier and increase the reaction activity. | ||
| Fig. 6 In situ FTIR characterization of (a) FeCo–N–C and (b) Fe–N–C. (c) FTIR absorption stretching at 1090 cm−1 for FeCo–N–C and 1014 cm−1 for Fe–N–C. (d) Schematic of the ORR mechanism for FeCo–N–C. | ||
4 Conclusions
In summary, we successfully synthesized a heteronuclear FeCo–N–C dual-metal catalyst that can be efficiently applied to different devices by directly loading complexes of different metals with phenanthroline on carbon black. Benefiting from the construction of atom pair sites after introducing Co atoms into Fe–N–C, the prepared FeCo–N–C catalyst exhibits a high E1/2 of 0.892 V and works stably for 100 h at 0.8 V under alkaline conditions. Moreover, a zinc–air battery based on this catalyst exhibits a high capacity density of 768.59 mA h gZn−1 and a maximum power density of 247.93 mW cm−2. Notably, we also observed a maximum power density of 444.7 mW cm−2 and an open-circuit voltage of 0.95 V for the FeCo–N–C-based AEMFC. In addition, in situ infrared test results showed that the Fe–Co catalytic pair in FeCo–N–C can alter the catalytic reaction pathway to bypass the production of *OOH intermediates and improve the activity of the ORR. Overall, this work provides an approach for the large-scale synthesis of high-performance non-precious metal catalysts that can be applied to fuel cells and metal–air batteries.Conflicts of interest
The authors declare no conflict of interest.Acknowledgements
The authors acknowledge the support from the National Key R&D Program of China (2020YFA0710000), the National Natural Science Foundation of China (22208330, 22278307, 22008170, 22222808, and 22121004), the Natural Science Foundation of Hubei Province (2021CFB178), and the Haihe Laboratory of Sustainable Chemical Transformations.References
- K. Li, R. Zhang, R. Gao, G. Shen, L. Pan, Y. Yao, K. Yu, X. Zhang and J. J. Zou, Appl. Catal., B, 2019, 244, 536–545 CrossRef CAS.
- M. Luo, Z. Zhao, Y. Zhang, Y. Sun, Y. Xing, F. Lv, Y. Yang, X. Zhang, S. Hwang, Y. Qin, J. Y. Ma, F. Lin, D. Su, G. Lu and S. Guo, Nature, 2019, 574, 81–85 CrossRef CAS PubMed.
- L. Chong, J. Wen, J. Kubal, F. G. Sen, J. Zou, J. Greeley, M. Chan, H. Barkholtz, W. Ding and D. J. Liu, Science, 2018, 362, 1276–1281 CrossRef CAS PubMed.
- H. T. Chung, D. A. Cullen, D. Higgins, B. T. Sneed, E. F. Holby, K. L. More and P. Zelenay, Science, 2017, 357, 479–484 CrossRef CAS PubMed.
- Y. Liu, X. Liu, Z. Lv, R. Liu, L. Li, J. Wang, W. Yang, X. Jiang, X. Feng and B. Wang, Angew. Chem., 2022, 134, e202117617 CrossRef.
- M. Li and L. Feng, Chin. J. Struct. Chem., 2022, 41, 2201019–2201024 CAS.
- R. He, C. Wang and L. Feng, Chin. Chem. Lett., 2023, 34, 107241 CrossRef CAS.
- Y. Tan, Z. Zhang, Z. Lei, L. Yu, W. Wu, Z. Wang and N. Cheng, Appl. Catal., B, 2022, 304, 121006 CrossRef CAS.
- T. Liu, J. Mou, Z. Wu, C. Lv, J. Huang and M. Liu, Adv. Funct. Mater., 2020, 30, 2003407 CrossRef CAS.
- J. C. Li, Y. Meng, L. Zhang, G. Li, Z. Shi, P. X. Hou, C. Liu, H. M. Cheng and M. Shao, Adv. Funct. Mater., 2021, 31, 2103360 CrossRef CAS.
- W. Sun, F. Wang, B. Zhang, M. Zhang, V. Küpers, X. Ji, C. Theile, P. Bieker, K. Xu, C. Wang and M. Winter, Science, 2021, 371, 46–51 CrossRef CAS PubMed.
- R. Gao, J. Wang, Z. F. Huang, R. Zhang, W. Wang, L. Pan, J. Zhang, W. Zhu, X. Zhang, C. Shi, J. Lim and J. J. Zou, Nat. Energy, 2021, 6, 614–623 CrossRef CAS.
- X. Ge, A. Sumboja, D. Wuu, T. An, B. Li, F. W. T. Goh, T. S. A. Hor, Y. Zong and Z. Liu, ACS Catal., 2015, 5, 4643–4667 CrossRef CAS.
- F. Liu, C. Shi, L. Pan, Z. F. Huang, X. Zhang and J. J. Zou, EES Catal., 2023, 1, 562–570 RSC.
- Y. Li, P. Zhang, L. Wan, Y. Zheng, X. Qu, H. Zhang, Y. Wang, K. Zaghib, J. Yuan, S. Sun, Y. Wang, Z. Zhou and S. Sun, Adv. Funct. Mater., 2021, 31, 2009645 CrossRef CAS.
- Q. Ma, H. Jin, J. Zhu, Z. Li, H. Xu, B. Liu, Z. Zhang, J. Ma and S. Mu, Adv. Sci., 2021, 8, 2102209 CrossRef CAS PubMed.
- C. Rong, X. Shen, Y. Wang, L. Thomsen, T. Zhao, Y. Li, X. Lu, R. Amal and C. Zhao, Adv. Mater., 2022, 34, 2110103 CrossRef CAS.
- Z. Liang, N. Kong, C. Yang, W. Zhang, H. Zheng, H. Lin and R. Cao, Angew. Chem., 2021, 133, 12869–12874 CrossRef.
- S. Liu, Q. Shi and G. Wu, Nat. Catal., 2021, 4, 6–7 CrossRef.
- L. Osmieri, J. Park, D. A. Cullen, P. Zelenay, D. J. Myers and K. C. Neyerlin, Curr. Opin. Electrochem., 2021, 25, 100627 CrossRef CAS.
- S. Liu, C. Li, M. J. Zachman, Y. Zeng, H. Yu, B. Li, M. Wang, J. Braaten, J. Liu, H. M. Meyer, M. Lucero, A. J. Kropf, E. E. Alp, Q. Gong, Q. Shi, Z. Feng, H. Xu, G. Wang, D. J. Myers, J. Xie, D. A. Cullen, S. Litster and G. Wu, Nat. Energy, 2022, 7, 652–663 CrossRef CAS.
- H. Yang, L. Shang, Q. Zhang, R. Shi, G. I. N. Waterhouse, L. Gu and T. Zhang, Nat. Commun., 2019, 10, 4585 CrossRef PubMed.
- S. Dou, J. Song, S. Xi, Y. Du, J. Wang, Z. F. Huang, Z. J. Xu and X. Wang, Angew. Chem., Int. Ed., 2019, 58, 4041–4045 CrossRef CAS PubMed.
- S. Möller, S. Barwe, J. Masa, D. Wintrich, S. Seisel, H. Baltruschat and W. Schuhmann, Angew. Chem., Int. Ed., 2020, 59, 1585–1589 CrossRef PubMed.
- K. Song, B. Yang, X. Zou, W. Zhang and W. Zheng, Energy Environ. Sci., 2024, 17, 27–48 RSC.
- H. Schmies, E. Hornberger, B. Anke, T. Jurzinsky, H. N. Nong, F. Dionigi, S. Kghl, J. Drnec, M. Lerch and C. Cremers, Chem. Mater., 2018, 30, 7287 CrossRef CAS.
- X. Wang, Y. Wang, X. Sang, W. Zheng, S. Zhang, L. Shuai, B. Yang, Z. Li, J. Chen, L. Lei, N. M. Adli, M. K. H. Leung, M. Qiu, G. Wu and Y. Hou, Angew. Chem., Int. Ed., 2021, 60, 4192–4198 CrossRef CAS PubMed.
- C. Liu, T. Li, X. Dai, J. Zhao, D. He, G. Li, B. Wang and X. Cui, J. Am. Chem. Soc., 2022, 144, 4913–4924 CrossRef CAS PubMed.
- J. Yang, P. Li, X. Li, L. Xie, N. Wang, H. Lei, C. Zhang, W. Zhang, Y. M. Lee, W. Zhang, R. Cao, S. Fukuzumi and W. Nam, Angew. Chem., 2022, 134, e202208143 CrossRef.
- J. Wang, Z. Huang, W. Liu, C. Chang, H. Tang, Z. Li, W. Chen, C. Jia, T. Yao, S. Wei, Y. Wu and Y. Li, J. Am. Chem. Soc., 2017, 139, 17281–17284 CrossRef CAS PubMed.
- C. Ouyang, L. Zheng, Q. Zhang and X. Wang, Adv. Mater., 2022, 34, 2205372 CrossRef CAS PubMed.
- Y. Zeng, C. Li, B. Li, J. Liang, M. J. Zachman, D. A. Cullen, R. P. Hermann, E. E. Alp, B. Lavina, S. Karakalos, M. Lucero, B. Zhang, M. Wang, Z. Feng, G. Wang, J. Xie, D. J. Myers, J.-P. Dodelet and G. Wu, Nat. Catal., 2023, 6, 1215–1227 CrossRef CAS.
- J. Li, M. T. Sougrati, A. Zitolo, J. M. Ablett, I. C. Oğuz, T. Mineva, I. Matanovic, P. Atanassov, Y. Huang, I. Zenyuk, A. D. Cicco, K. Kumal, L. Dubau, F. Maillard, G. Dražić and F. Jaouen, Nat. Catal., 2021, 4, 10–19 CrossRef CAS.
- T. Marshall-Roth, N. J. Libretto, A. T. Wrobel, K. J. Anderton, M. L. Pegis, N. D. Ricke, T. V. Voorhis, J. T. Miller and Y. Surendranath, Nat. Commun., 2020, 11, 5283 CrossRef CAS PubMed.
- D. Menga, J. L. Low, Y.-S. Li, I. Arčon, B. Koyutürk, F. Wangner, F. Ruiz-Zepeda, M. Gaberšček, B. Paulus and T.-P. Fellonger, J. Am. Chem. Soc., 2021, 143, 18010–18019 CrossRef CAS PubMed.
- X. Wang, H. Zhang, H. Lin, S. Gupta, C. Wang, Z. Tao, H. Fu, T. Wang, J. Zheng, G. Wu and X. Li, Nano Energy, 2016, 25, 110 CrossRef CAS.
- Q. Ma, H. Jin, J. Zhu, Z. Li, H. Xu, B. Liu, Z. Zhang, J. Ma and S. Mu, Adv. Sci., 2021, 8, 2102209 CrossRef CAS PubMed.
- J. Ohyama, M. Moriya, R. Takahama, K. Kamoi, S. Kawashima, R. Kojima, T. Hayakawa and Y. Nabae, JACS Au, 2021, 1, 1798–1804 CrossRef CAS PubMed.
- H. Cai, G. Zhang, X. Zhang, B. Chen, Z. Lu, H. Xu, R. Gao and C. Shi, Small, 2022, 18, 2200911 CrossRef CAS PubMed.
- L. Wu, T. Guo and T. Li, Adv. Funct. Mater., 2022, 32, 2203439 CrossRef CAS.
- Y. He, X. Yang, Y. Li, L. Liu, S. Guo, C. Shu, F. Liu, Y. Liu, Q. Tan and G. Wu, ACS Catal., 2022, 12, 1216–1227 CrossRef CAS.
- J. Hu, W. Shang, C. Xin, J. Guo, X. Cheng, S. Zhang, S. Song, W. Liu, F. Ju, J. Hou and Y. Shi, Angew. Chem., Int. Ed., 2023, 62, e202304754 CrossRef CAS PubMed.
- F. Liu, R. Gao, C. Shi, L. Pan, Z. F. Huang, X. Zhang and J. J. Zou, J. Am. Chem. Soc., 2023, 145, 25252–25263 CrossRef CAS PubMed.
- J. Wang, W. Liu, G. Luo, Z. Li, C. Zhao, H. Zhang, M. Zhu, Q. Xu, X. Wang, C. Zhao, Y. Qu, Z. Yang, T. Yao, Y. Li, Y. Lin, Y. Wu and Y. Li, Energy Environ. Sci., 2018, 11, 3375–3379 RSC.
- X. Sun, Y. Qiu, B. Jiang, Z. Chen, C. Zhao, H. Zhou, L. Yang, L. Fan, Y. Zhang and N. Zhang, Nat. Commun., 2023, 14, 291 CrossRef CAS PubMed.
- H. Fei, J. Dong, Y. Feng, C. S. Allen, C. Wang, B. Volosskiy, M. Li, Z. Zhao, Y. Wang, H. Sun, P. An, W. Chen, Z. Guo, C. Lee, D. Chen, I. Shakir, M. Liu, T. Hu, Y. Li, A. I. Kirkland, X. Duan and Y. Huang, Nat. Catal., 2018, 1, 63–72 CrossRef CAS.
- J. M. Heng, H. L. Zhu, Z. H. Zhao, C. Yu, P. Q. Liao and X. M. Chen, J. Am. Chem. Soc., 2023, 145, 21672–21678 CrossRef CAS PubMed.
- P. Cao, X. Quan, X. Nie, K. Zhao, Y. Liu, S. Chen, H. Yu and J. G. Chen, Nat. Commun., 2023, 14, 172 CrossRef CAS PubMed.
- R. R. Rao, M. J. Kolb, L. Giordano, A. F. Pedersen, Y. Katayama, J. Hwang, A. Mehta, H. You, J. R. Lunger, H. Zhou, N. B. Halck, T. Vegge, I. Chorkendorff, I. E. L. Stephens and Y. Shao-Horn, Nat. Catal., 2020, 3, 516–525 CrossRef CAS.
- C. Lang, J. Li, K. R. Yang, Y. Wang, D. He, J. E. Thorne, S. Croslow, Q. Dong, Y. Zhao, G. Prostko, G. W. Brudvig, V. S. Batista, M. M. Waegele and D. Wang, Chem, 2021, 7, 2101–2117 CAS.
- N. Sivasankar, W. W. Weare and H. J. Frei, Am. Chem. Soc., 2011, 133, 12976–12979 CrossRef CAS PubMed.
- W. Zhou, H. Su, W. Cheng, Y. Li, J. Jiang, M. Liu, F. Yu, W. Wang, S. Wei and Q. Liu, Nat. Commun., 2022, 13, 6414 CrossRef CAS PubMed.
Footnote |
| † Electronic supplementary information (ESI) available. See DOI: https://doi.org/10.1039/d4nr00077c |
| This journal is © The Royal Society of Chemistry 2024 |