 Open Access Article
Adsorption efficiency of crystal violet from the aqueous phase onto a carbonaceous material prepared from waste cotton and polyester
Fumihiko
Ogata
a,
Kazuki
Sugimura
a,
Noriaki
Nagai
a,
Chalermpong
Saenjum
bc,
Keiji
Nishiwaki
 a and
Naohito
Kawasaki
 *ad
*ad
aFaculty of Pharmacy, Kindai University, 3-4-1 Kowakae, Higashi-Osaka, Osaka 577-8502, Japan. E-mail: kawasaki@phar.kindai.ac.jp
bFaculty of Pharmacy, Chiang Mai University, Suthep Road, Muang District, Chiang Mai, 50200, Thailand
cCenter of Excellence for Innovation in Analytical Science and Technology for Biodiversity-based Economic and Society (I-ANALY-S-T_B.BES-CMU), Chiang Mai University, Chiang Mai, 50200, Thailand
dAntiaging Center, Kindai University, 3-4-1 Kowakae, Higashi-Osaka, Osaka 577-8502, Japan
First published on 4th December 2023
Abstract
This research aims to evaluate waste cotton and polyester as effective potential adsorbents for the removal of crystal violet (CV) from aqueous phases. Carbonaceous materials (VCP1000 or VC1000) from waste cotton and polyester were prepared at different calcination temperatures, and their characteristics were assessed using scanning electron microscopy, pHpzc, surface functional groups, and specific surface areas. The values of the parameters of VCP1000 or VC1000 were greater than those of other adsorbents. Additionally, adsorption experiments were performed in batch mode, and various parameters, including initial concentration, adsorption temperature, contact time, and pH, were demonstrated in this study. The amount of CV adsorbed onto VCP1000 and/or VC1000 was higher than those onto other VCP and/or VC adsorbents. The adsorption equilibrium of CV was achieved within 24 h. These data were fitted to the pseudo-second-order model (correlation coefficient: 0.991–0.995). The adsorption capacity increased with increasing adsorption temperatures (7 °C < 25 °C < 45 °C). The adsorption isotherm data were fitted to both the Langmuir and Freundlich models as well. The adsorption of CV using VCP1000 or VC1000 was significantly influenced by pH under our experimental conditions. Finally, elemental distribution and binding energy analyses were conducted to elucidate the adsorption mechanisms of CV. The obtained results indicate that the adsorbed CV was presented onto the VCP1000 and/or VC1000 surface. Collectively, these obtained results show that VCP1000 or VC1000 holds promise for the removal of CV from aqueous phases.
Sustainability spotlightGoal 12, specifically focused on responsible consumption and production, aims to foster the development of innovative recycling technologies for reducing waste worldwide. In this study, we focus on textile products. The most produced fibers, such as cotton and polyester, were produced at 26 and 55 million tons, respectively. Interwoven cotton and polyester blends are extremely difficult to recycle and/or handle to reproduce new yarns. Hence, the development of value-added products, such as novel adsorbents derived from waste cotton and polyester for the purpose of removing CV from aqueous solutions, has the potential to make a substantial contribution to the realization of the SDGs and the purification of wastewater containing CV. |
1 Introduction
Production of textiles clearly contributes to the rapid growth of economic expansion.1 However, environmental pollution and the potential risks to human health from dye contamination are major concerns because large amounts of colored wastewater are being released into water environments.2 In addition, many serious environmental problems have been caused by wastewater containing harmful materials including dyes, owing to their carcinogenic properties and high toxicity.3–6 It is estimated that over tens of thousands of dyes and/or pigments are used industrially, corresponding to approximately 7 × 10⁵ tons annually worldwide.7 According to estimates, an annual production of at least two hundred billion liters of dyeing wastewater has been recorded.8Dyes possess intricate molecular structures and exhibit resilience against aerobic decomposition, remaining stable when exposed to light, heat, and oxidizing agents.7 Dyes can be categorized into three different classes: cationic, anionic, and nonionic dyes. In particular, cationic dyes are more dangerous than the other types. Crystal violet (CV) is a widely recognized triarylmethane dye among the different types of cationic dyes. CV accumulation can reportedly cause harmful effects because of its carcinogenic and mutagenic nature.9,10 Therefore, CV must be removed from aqueous phases.
Many researchers have reported several treatment processes for removing harmful materials, including dyes (CV), over the last few decades. Such technologies include physical, chemical, and physicochemical treatments (e.g., adsorption, membrane filtration, ion exchange, electrochemical techniques, coagulation, flocculation, reverse osmosis, ozonation, chemical oxidation, activated sludge, and bacterial action).11–13 Among these methods, adsorption stands out as a prominent technique in green chemistry for removing pollutants from aqueous phases. This is primarily due to its cost-effectiveness, adaptability with minimal sludge generation, straightforwardness, effectiveness, and rapidity.13,14 Furthermore, it typically does not generate by-products with substantial environmental hazard risks.15–17
Previous research has focused on assessing affordable, readily available, sustainable waste biomass-based adsorbents with high adsorption capacities. This approach was prompted by the drawbacks associated with the widely used adsorbent, activated carbon, which is renowned for its costly production and the need for regeneration during the adsorption process.18,19
In 2015, all United Nations member states adopted the Sustainable Development Goals (SDGs) to establish a sustainable society. Goal 12, specifically focused on responsible consumption and production, aims to foster the development of innovative recycling technologies for reducing waste worldwide. Therefore, numerous researchers have directed their attention towards renewable materials, including agricultural waste and residues, to assess their potential for converting these discarded resources into value-added products. Preparing adsorbents based on waste biomass is one of the most useful recycling technologies to achieve the SDGs.
In this study, we focus on textile products. The most produced fibers, such as cotton and polyester, were produced at 26 and 55 million tons, respectively.20 According to a previous report, the yearly fiber production for consumer clothing was approximately 53 million tons, with a significant portion of 73% being discarded in landfills or waste incinerators.21 Additionally, interwoven cotton and polyester blends are extremely difficult to recycle and/or handle to reproduce new yarns.22–24 Hence, the development of value-added products, such as novel adsorbents derived from waste cotton and polyester for the purpose of removing CV from aqueous solutions, has the potential to make a substantial contribution to the realization of the SDGs and the purification of wastewater containing CV.
Therefore, this study aims to prepare an adsorbent produced from waste cotton and/or polyester treated with calcination, and its characteristics, including morphology, specific surface area, surface functional group, and pHpzc, were evaluated. Furthermore, this paper presents a demonstration of the adsorption capacity of CV using the prepared adsorbent. The effect of factors, including contact time, initial concentration, temperature, and pH level, on the adsorption of CV was also evaluated. Furthermore, kinetics and equilibrium modeling, elemental distribution, and binding energy assessment were conducted to gain a comprehensive understanding of the adsorption mechanism of CV onto the chosen adsorbents. Finally, the purpose of this study is to transform waste cotton/polyester into useful adsorbents for purification of wastewater including CV.
2 Experimental section
2.1 Materials and methods
Waste cotton (VC) or waste fabric made of cotton and polyester (VCP) was used to prepare adsorbents. The prepared adsorbents were calcined at 600 °C, 800 °C, and 1000 °C for 2 h. The samples were labeled VC600, VC800, VC1000, VCP600, VCP800, and VCP1000. CV (C25H30ClN3) was purchased from FUJIFILM Wako Pure Chemical Co., Ltd (Japan). The morphologies of the prepared carbonaceous materials were monitored using a scanning electron microscope (SEM) SU1510 (Hitachi High Technologies Co., Japan) operating at an accelerating voltage range of 5 to 15 kV. The specific surface area was determined using a BELSORP MINI X instrument (MicrotracBEL, Japan). Finally, we determined the surface functional groups and point of zero charge (pHpzc) using established methods as described in prior studies.25,26 Briefly, 0.75 g of the adsorbent was added to a 0.01 mol per L NaCl solution of 25 mL at pH from 3 to 11. Subsequently, the mixture solution was shaken at 100 rpm for 72 h at 25 °C. pHpzc is the point where the curve of pHfinalvs. pHinitial crosses the line pHfinal = pHinitial. In addition, thermogravimetric-differential thermal analysis (TG-DTA) and Fourier transform infrared spectroscopy (FT-IR) of the prepared carbonaceous materials were also assessed using TG8210 (Rigaku Co., Japan) and FT-710 (HORIBA Ltd, Kyoto).2.2 Adsorption capacity of CV
First, CV solution was prepared by the following procedure. CV was dissolved with purified water, and then the concentration of CV was adjusted at 100 mg L−1 (stock solution). This stock solution was appropriately diluted and then used in each experiment or the calibration curve. The screening experiment of CV adsorption was demonstrated. 0.02 g of adsorbent was added to 50 mL of a 50 mg per L CV solution for 24 h at 25 °C at 100 rpm. Subsequently, the parameter effects on the adsorption of CV using VCP1000 or VC1000 were evaluated. Initially, 0.02 g of VCP1000 or VC1000 was added to 50 mL of a 100 mg per L CV solution at 25 °C for 10 and 30 min and 1, 1.5, 3, 6, 9, 12, 15, 18, 20, and 24 h at 100 rpm. Next, 0.02 g of VCP1000 or VC1000 was added to 50 mL of 10, 20, 30, 40, 50, 60, 80, and 100 mg per L CV solutions at 7 °C, 25 °C, and 45 °C for 24 h at 100 rpm to clarify the effect of the initial concentration and temperature on the adsorption of CV. In addition, the adsorption mechanism of CV with VCP1000 or VC1000 was evaluated using an electron probe microanalyzer JXA-8530 F (JEOL, Japan) (measurement conditions: accelerating voltage, 15.0 kV; beam diameter, 2 mm) and AXIS-NOVA (Shimadzu, Japan) (measurement conditions: radiation source, Al Kα; voltage, 15.0 kV; current, 5 mA), respectively. Finally, 0.02 g of VCP1000 or VC1000 was added to 50 mL of a 100 mg per L CV solution (pH 2, 4, 6, and 8) at 25 °C for 24 h at 100 rpm to clarify the impact of pH on adsorption. The pH of the solution was measured using an F-73 digital pH meter (HORIBA, Japan).The concentration of CV was measured through the following procedures. The equilibrium concentration of CV in the filtered sample solution after the adsorption reaction was determined using an ultraviolet-visible spectrophotometer UV-1280 (Shimadzu, Japan). The maximum absorption wavelength was 590 nm. The calibration curve was prepared over the range of 0.1–5.0 mg L−1 and the correlation coefficient was determined to be over 0.999. Furthermore, the adsorbed CV was quantified by comparing concentrations before and after adsorption at various levels. All data are expressed as mean ± standard error (n = 3–4).
3 Results and discussion
3.1 Characteristics of the prepared adsorbents
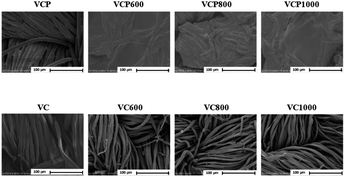
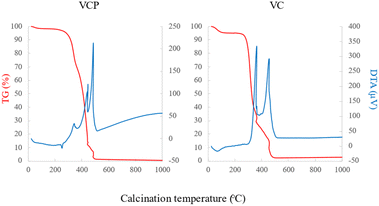
The SEM images of the prepared adsorbents are shown in Fig. 1. The surface of VC remained significantly unchanged following calcination, whereas the surface of VCP clearly changed with calcination under the experimental conditions employed in our study. A previous study reported that polyester fiber was melted at approximately 250 °C.27 Therefore, the surface of VCP adsorbent was smoothed as the calcination temperature increased.Additionally, we could observe that VCP was clearly thermally decomposed at approximately 250 °C in this study (Fig. 2). These data supported the changes of the SEM image with calcination temperature.
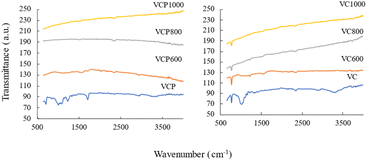
In Table 1, the physicochemical properties of the adsorbents are presented. The value of pHpzc increased with increasing calcination temperature. Additionally, the basic functional groups and specific surface areas also increased with increasing calcination temperature. Conversely, acidic functional groups exhibited different changes in the prepared adsorbents compared with other properties. FT-IR spectra of VCPs and VCs are shown in Fig. 3. O–H stretching vibration (3200–3550 cm−1), O–H bending (850–1140 cm−1), and C–O stretching vibration (1700–1720 cm−1) were found in VCP and VC, whereas no characteristic peaks were found in calcined VCP and VC samples. In this study, the specific functional groups were not determined by FT-IR spectra. Therefore, further studies are necessary for determining the specific functional groups of carbonaceous materials prepared from waste cotton in detail.
| Adsorbents | pHpzc | Basic functional groups (mmol g−1) | Acidic functional groups (mmol g−1) | Specific surface area (m2 g−1) |
|---|---|---|---|---|
| VCP | 6.72 | 0.00 | 0.03 | N.D. |
| VCP600 | 6.60 | 0.08 | 0.26 | 583 |
| VCP800 | 7.29 | 0.29 | 0.28 | 634 |
| VCP1000 | 7.25 | 0.30 | 0.30 | 823 |
| VC | 6.42 | 0.00 | 0.11 | N.D. |
| VC600 | 7.04 | 0.26 | 0.31 | 508 |
| VC800 | 7.78 | 0.63 | 0.23 | 639 |
| VC1000 | 9.89 | 0.82 | 0.17 | 660 |
3.2 Adsorption capacity of CV
Fig. 4 presents the amount of adsorbed CV using the prepared adsorbents. The amounts adsorbed onto VCP1000 and VC1000 were greater compared with those of other VCP and VC adsorbents. Previous research has indicated that factors, including functional groups, porous structures, micropores, and mesopores, can substantially influence the adsorption capacity and efficiency of selected adsorbents.28–30 Therefore, the correlation between the adsorbed CV amounts and the adsorbents' characteristics was evaluated. A high correlation was confirmed by a correlation coefficient of 0.930–0.969. In particular, the specific surface area is considered one of the factors that affect the adsorption capacity. Additionally, the high internal surface area of an adsorbent creates the high capacity needed for a successful purification process. In this study, this factor might be significantly related to the adsorption capacity of CV. Similar trends were observed in a previously reported study.31 These trends indicate that the surface characteristics of the prepared adsorbent are important factors for removing CV from aqueous phases.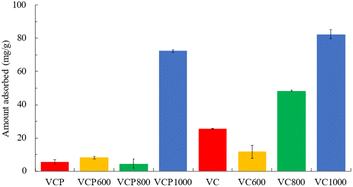 | ||
| Fig. 4 The amount of CV adsorbed onto adsorbents. Initial concentration: 50 mg L−1, sample volume: 50 mL, adsorbent: 0.02 g, temperature: 25 °C, contact time: 24 h, 100 rpm. | ||
3.3 Parameter effects on CV adsorption
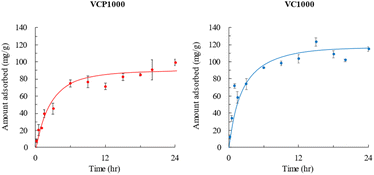
The effects of the contact time on the adsorption of CV, using either VCP1000 or VC1000, are shown in Fig. 5. The amount of adsorbed CV increased with increasing adsorption time. The equilibrium concentration was achieved within 24 h under our experimental conditions.Pseudo-first-order32 and pseudo-second-order models33 are commonly applied to predict adsorption mechanisms. These models demonstrate the relationship between the amount of CV adsorbed as a function of time.32 We applied these models to analyze the data acquired from adsorption experiments, enabling us to establish kinetic parameters.
| ln(qe − qt) = ln(qe) − k1t | (1) |
 | (2) |
The data obtained for kinetic models are shown in Table 2. The correlation coefficient of the pseudo-second-order-model (0.991–0.995) was higher than that of the pseudo-first-order-model (0.941–0.963). Furthermore, the values of qe (VCP1000, 99.4 mg g−1; VC1000, 114.8 mg g−1) estimated from experimental data also strongly align with the pseudo-second-order model (VCP1000, 103.5 mg g−1; VC1000, 117.8 mg g−1) compared with the pseudo-first-order model (VCP1000, 75.1 mg g−1; VC1000, 70.4 mg g−1). According to the results, CV adsorption onto VCP1000 or VC1000 may have occurred chemically.
| Adsorbents | q e,exp (mg g−1) | Pseudo-first-order model | Pseudo-second-order model | ||||
|---|---|---|---|---|---|---|---|
| q e,cal (mg g−1) | k 1 (h−1) | r | q e,cal (mg g−1) | k 2 (mg g−1 h−1) | r | ||
| VCP1000 | 99.4 | 75.1 | 0.103 | 0.963 | 103.5 | 3.2 × 10⁻³ | 0.991 |
| VC1000 | 114.8 | 70.4 | 0.087 | 0.941 | 117.8 | 6.2 × 10⁻³ | 0.995 |
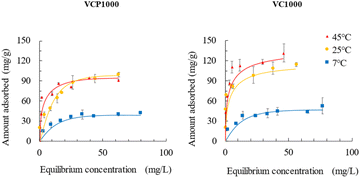
Fig. 6 presents the adsorption isotherms of CV onto VCP1000 or VC1000. The amount of CV adsorbed increased with increasing adsorption temperatures (7 °C < 25 °C or 45 °C). The amount adsorbed at 45 °C slightly increased or did not significantly change compared with that at 25 °C. These patterns indicate that the saturated adsorption capacity of CV occurred within the temperature range of 25 °C to 45 °C.
The Langmuir and Freundlich isotherm models also provide valuable insights into adsorption mechanisms by estimating the adsorption of an adsorbate as a function of equilibrium concentration.34 The Langmuir isotherm model assumes that adsorption takes place at specific homogeneous adsorption sites.35 Meanwhile, at the same time, the Freundlich isotherm model is applicable for characterizing adsorption on heterogeneous surfaces.36
 | (3) |
 | (4) |
The Langmuir and Freundlich constants for the adsorption of CV are presented in Table 3. Under our experimental conditions, the Langmuir correlation coefficient (r = 0.954–0.996) and Freundlich correlation coefficient (r = 0.940–0.993) were found to be suitable for fitting the data. The value of qmax using both VCP1000 and VC1000 increased with increasing adsorption temperatures. In addition, the value of KF increased as the adsorption temperature increased, which indicated that the permeability of CV onto the adsorbent was enhanced by the greater contribution of kinetic energy at higher adsorption temperatures.11
| Adsorbents | Temperature (°C) | Langmuir isotherm model | Freundlich isotherm model | ||||
|---|---|---|---|---|---|---|---|
| q max (mg g−1) | K L (L mg−1) | r | 1/n | log![[thin space (1/6-em)]](https://www.rsc.org/images/entities/char_2009.gif) KF KF |
r | ||
| VCP1000 | 7 | 43.9 | 0.17 | 0.996 | 0.31 | 1.08 | 0.961 |
| 25 | 74.8 | 0.60 | 0.959 | 0.36 | 1.39 | 0.993 | |
| 45 | 76.6 | 2.75 | 0.960 | 0.23 | 1.61 | 0.944 | |
| VC1000 | 7 | 44.7 | 0.34 | 0.954 | 0.28 | 1.19 | 0.969 |
| 25 | 97.2 | 3.83 | 0.957 | 0.15 | 1.81 | 0.981 | |
| 45 | 117.6 | 1.62 | 0.983 | 0.28 | 1.73 | 0.940 | |
These observed trends were similar to the adsorption isotherm data presented in Fig. 6.
Furthermore, the occurrence of CV adsorption was readily observed when the 1/n value varied within the range of 0.1 to 0.5.35 In this study, the value of the 1/n range was from 0.15 to 0.36, which indicated that CV was easily adsorbed onto VCP1000 or VC1000. In conclusion, the adsorption of CV onto the prepared adsorbents was controlled by multiple processes that involved both physical and chemical adsorption.37
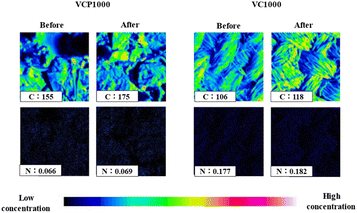
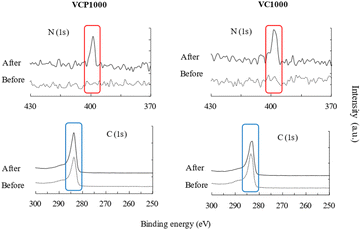
A previous study reported that the hydrogen bonding, electrostatic interaction, and π–π interactions were related to the adsorption mechanism of 4-nitroaniline onto MCM-48,37 which indicates that the relationship between adsorbent surface roughness and contact angle is important to elucidate the adsorption mechanism in detail. In this study, the obtained results suggest that the properties of the VCP1000 and/or VC1000 surface significantly affect the adsorption mechanism of CV from aqueous phases. As a result, we evaluated the binding energy and elemental distribution analysis both before and after the adsorption of CV (Fig. 7–9). The morphology of the VCP1000 and/or VC1000 surface slightly changed before and after adsorption (Fig. 7). Therefore, the CV was presented onto the adsorbent surface following the adsorption process.
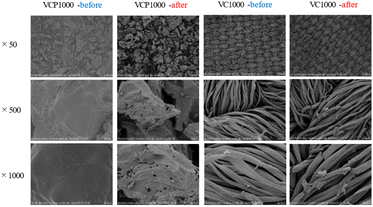 | ||
| Fig. 7 The SEM images of VCP1000 and VC1000 before and after adsorption. Initial concentration, 100 mg L−1; sample volume, 50 mL; adsorbent, 0.02 g; temperature, 25 °C; contact time, 24 h, 100 rpm. | ||
Subsequently, carbon (C) and nitrogen (N) distribution intensities were measured. As shown in Fig. 8, the intensities of C and N, which were component elements of the CV structure, slightly increased after adsorption compared with those before adsorption (the warm and cold colors indicate high and low concentrations of CV, respectively). Additionally, the binding energies of C and N, which were slightly or not detected before adsorption, were clearly detected after the adsorption of CV in this study (Fig. 9). Collectively, the physicochemical characteristics of the adsorbent surface exhibited a notable correlation with CV adsorption.
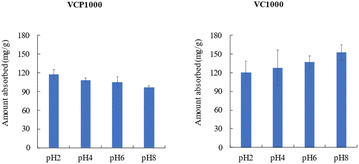
Fig. 10 shows the effect of pH on the adsorption of CV onto VCP1000 or VC1000, the amount of adsorbed CV using VCP1000 slightly decreased or did not change. Meanwhile, a quite opposite trend was observed when using VC1000 under our experimental conditions. As mentioned, CV adsorption is possibly related to the physicochemical characteristics of the adsorbent surface. The interaction of CV with the prepared adsorbents depended on the solution pH. The adsorption capacity of CV changed with the changing surface charges of the prepared adsorbents from positive to negative.1 For VCP1000, the values of pHpzc, basic functional groups, acidic functional groups, and specific surface area were 7.25, 0.30 mmol g−1, 0.30 mmol g−1, and 823 m2 g−1, respectively, as shown in Table 1. According to our theory, alcoholic/phenolic hydroxyl groups (–OH) predominated among the functional groups in the adsorbent surface, with the remaining carbonyl groups (–COO) coming from polyester and cellulose (derived from cotton). pHpzc generally strongly affects the adsorption capacity of VC.11 However, the observed trend in adsorption capacity was not different from those previously reported in other studies.1,7 In other words, the adsorption capacity of CV was not significantly changed between pH 2 and pH 8. Therefore, physical properties, including the specific surface area, significantly affect the adsorption capacity of CV compared with other parameters in this study. However, further study is required to clarify the mechanisms by which VCP1000 adsorbs CV. In the case of VC1000, the pHpzc, basic functional groups, acidic functional groups, and specific surface area were 9.89, 0.82 mmol g−1, 0.17 mmol g−1, and 660 m2 g−1, respectively (Table 1). In particular, the number of basic functional groups was approximately five times greater compared with the number of acidic functional groups. The value of pHpzc was less than 9.89, implying that VC1000 was acidic and easily protonated. Additionally, the occurrence of excessive H+ (H3O+) ions might have slightly caused the repulsion between the positively charged VC1000 and CV in the aqueous phase. Meanwhile, at high alkaline pH, the increase in HO− ions caused deprotonation, which led to a gradually negative charge of VC1000 under our experimental conditions.1,11 Therefore, the amount of CV adsorbed increased with increasing solution pH.
3.4 Comparison of the CV adsorption with those of other reported adsorbents
Table 4 compares the CV adsorption capacity with those of other reported adsorbents.1,38–44 As shown in Table 4, VCP1000 and VC1000 effectively removed CV from aqueous phases (except for mango stone biocomposite, coconut husk and FCMFs). Thus, VCP1000 and/or VC1000 show promising characteristics as adsorbents for CV adsorption from aqueous phases.| Samples | Adsorption capability (mg g−1) | pH | Temperature (°C) | Initial concentration (mg L−1) | Contact time (h) | Adsorbent (g L−1) | References |
|---|---|---|---|---|---|---|---|
| Charred rice husks | 62.85 | — | r.t. | 50 | 24 | 1.0 | Homagai et al., 2022 |
| Nascent rice husk | 24.4781 | — | 25 | 500 | 24 | 16.7 | Quansah et al., 2020 |
| Mango stone biocomposite | 352.79 | 8.0 | 33 | 500 | 1 | 0.5 | Shoukat et al., 2017 |
| Coconut husk | 454.54 | 5.0 | r.t. | 400 | 3 | 1.0 | Sultana et al., 2022 |
| Saw dust | 37.83 | — | 23 | 100 | 5 | 4.0 | Parab et al., 2009 |
| Coniferous pine bark | 32.78 | 8.0 | 30 | 50 | 2 | 2.0 | Ahmad, 2009 |
| FCMFs | 872 | 7.0 | 25 | 350 | 1 | 0.2 | Baghdadi et al., 2016 |
| VCP1000 | 74.8 | ∼5.0 | 25 | 100 | 24 | 0.4 | This study |
| VC1000 | 92.8 | ∼5.0 | 25 | 100 | 24 | 0.4 | This study |
4 Conclusions
In this study, we reported the preparation of new carbonaceous materials from cotton and polyester by calcination at different temperatures. The results showed that the physicochemical characteristics of VCP1000 and/or VC1000 were superior compared with other prepared adsorbents. Changes in CV adsorption were evaluated in detail by investigating parameters including contact time, initial concentration, adsorption temperature, and pH. The obtained data were fitted to pseudo-second-order, Langmuir, and Freundlich models under our experimental conditions. CV was adsorbed onto the VCP1000 and/or VC1000 surface after adsorption to evaluate the adsorption mechanism of CV via elemental distribution and binding energy analyses. Therefore, the physicochemical characteristics of adsorbent surfaces are strongly related to the adsorption capability of CV from aqueous phases. Finally, the prepared adsorbents based on waste cotton and polyester are expected to effectively remove CV from water environments.Author contributions
Fumihiko Ogata: conceptualization, project administration, writing – original draft, and writing – review & editing, Kazuki Sugimura: investigation, methodology, visualization, Noriaki Nagai: investigation and visualization, Chalermpong Saenjum: investigation and visualization, Keiji Nishiwaki: investigation and visualization, Naohito Kawasaki: project administration, supervision, and writing – review & editing.Conflicts of interest
There are no conflicts to declare.Acknowledgements
This work is supported by JSPS KAKENHI (JP22K06674).References
- S. Sultana, K. Islam, M. A. Hasan, H. M. J. Khan, M. A. R. Khan, A. Deb, M. A. Raihan and M. W. Rahman, Adsorption of crystal violet dye by coconut husk powder: isotherm, kinetics and thermodynamics perspectives, Environ. Nanotechnol., Monit. Manage., 2022, 17, 100651 CAS.
- B. Lellis, C. Z. Fávaro-Polonio, J. A. Pamphile and J. C. Polonio, Effects of textile dyes on health and the environment and bioremediation potential of living organisms, Biotechnol. Res. Innov., 2019, 3, 275–290 CrossRef.
- N. S. Ali, I. K. Salih, H. N. Harharah, H. S. Majdi, H. G. Salih, K. R. Kalash, A. Al-Shathr, F. T. Al-Sudani, M. A. Abdulrahman, J. M. Alrubaye, T. M. Albayati, N. M. Saady and S. Zendehboudi, Utilization of loaded cobalt onto MCM-48 mesoporous catalyst as a heterogeneous reaction in a fixed bed membrane reactor to produce isomerization product from n-heptane, Catalysts, 2023, 13, 1138 CrossRef CAS.
- N. S. Ali, H. S. Majdi, T. M. Albayati and D. J. Jasim, Adsorption of anilin from aqueous solutions onto a nanoporous material adsorbent: isotherms, kinetics, and mass transfer mechanisms, Water Pract. Technol., 2023, 18(9), 2136–2150 CrossRef.
- N. S. Ali, K. R. Kalash, A. N. Ahmed and T. M. Albayati, Performance of a solar photocatalysis reactor as pretreatment for wastewater via UV, UV/TiO2, and UV/H2O2 to control membrane fouling, Sci. Rep., 2022, 12, 16782 CrossRef CAS.
- R. H. Khudhur, N. S. Ali, E. H. Khader, N. S. Abbood, I. K. Salih and T. M. Albayati, Adsorption of anionic azo dye from aqueous wastewater using zeolite NaX as an efficient adsorbent, Desalin. Water Treat., 2023, 306, 245–252 CAS.
- L. Sellaoui, G. L. Dotto, E. C. Peres, Y. Benguerba, É. C. Lima, A. B. Lamine and A. Erto, New insights into the adsorption of crystal violet dye on functionalized multi-walled carbon nanotubes: experiments, statistical physics and COSMO–RS models application, J. Mol. Liq., 2017, 248, 890–897 CrossRef CAS.
- A. Tkaczyk, K. Mitrowska and A. Posyniak, Synthetic organic dyes as contaminants of the aquatic environment and their implications for ecosystems: a review, Sci. Total Environ., 2020, 717, 137222 CrossRef CAS.
- R. Ahmad, Studies on adsorption of crystal violet dye from aqueous solution onto coniferous pinus bark powder (CPBP), J. Hazard. Mater., 2009, 171(1–3), 767–773 CrossRef CAS.
- S. Senthilkumaar, P. Kalaamani and C. V. Subburaam, Liquid phase adsorption of crystal violet onto activated carbons derived from male flowers of the coconut tree, J. Hazard. Mater., 2006, 136(3), 800–808 CrossRef CAS PubMed.
- R. Fabryanty, C. Valencia, F. E. Soetaredjo, J. N. Putro, S. P. Santoso, A. Kurniawan, Y. H. Ju and S. Ismadji, Removal of crystal violet dye by adsorption using bentonite – alginate composite, J. Environ. Chem. Eng., 2017, 5, 5677–5687 CrossRef CAS.
- F. Wang, Y. Zhang and Y. Wang, Recycling of waste cotton sheets into three-dimensional biodegradable carries for removal of methylene blue, ACS Omega, 2021, 6, 34314–34326 CrossRef CAS PubMed.
- J. I. Humadi, S. A. Jafa, N. S. Ali, M. A. Ahmed, M. J. Mzeed, R. J. Al-Salhi, N. M. C. Saady, H. S. Majdi, S. Zendehboudi and T. M. Albayat, Recovery of fuel from real waste oily sludge via a new eco-friendly surfactant material used in a digital baffle batch extraction unit, Sci. Rep., 2023, 13, 9931 CrossRef CAS.
- L. Liu, S. Li, J. Zheng, T. Bu, G. He and J. Wu, Safety considerations on food protein-derived bioactive peptides, Trends Food Sci. Technol., 2020, 96, 199–207 CrossRef CAS.
- Q. Liu, Y. Li, H. Chen, J. Lu, G. Yu, M. Möslang and Y. Zhou, Superior adsorption capacity of functionalised straw adsorbent for dyes and heavy-metal ions, J. Hazard. Mater., 2020, 382, 121040 CrossRef CAS.
- T. L. Kua, M. R. R. Kooh, M. K. Dahri, N. A. H. M. Zaidi, Y. Lu and L. B. L. Lim, Aquatic plant, Ipomoea aquatica, as a potential low-cost adsorbent for the effective removal of toxic methyl violet 2B dye, Appl. Water Sci., 2020, 10, 243 CrossRef CAS.
- O. S. Bello, E. O. Alabi, K. A. Adegoke, S. A. Adegboyega, A. A. Inyinbor and A. O. Dada, Rhodamine B dye sequestration using Gmelina aborea leaf powder, Heliyon, 2020, 6, e02872 CrossRef.
- H. A. Kiwaan, F. S. Mohamed, N. A. El-Ghamaz, N. M. Beshry and A. A. El-Bindary, Experimental and electrical studies of Na-X zeolite for the adsorption of different dyes, J. Mol. Liq., 2021, 332, 115877 CrossRef CAS.
- S. Yadav, A. Yadav, N. Bagotia, A. K. Sharma and S. Kumar, Adsorptive potential of modified plant-based adsorbents for sequestration of dyes and heavy metals from wastewater – a review, J. Water Process Eng., 2021, 42, 102148 CrossRef.
- X. Dong, J. Yang, Y. Chen, X.-T. Zhen, Q.-Y. Wang, H. Zheng and J. Cao, Stigma maydis based plant adsorbent assisted miniaturized solid phase extraction of organophosphorus pesticides from crops, Ind. Crop. Prod., 2020, 155, 112832 CrossRef CAS.
- The Fiber Year GmbH, The fiber year 2019 – the survey on textiles & nonwovens, 2019, available at, https://thefiberyear.com/home/, accessed July 15th, 2023 Search PubMed.
- The Ellen MacArthur Foundation, A new textiles economy: redesigning fashion's future, 2017, available at, https://www.ellenmacarthurfoundation.org/publications/a-new-textiles-economy-redesigning-fashions-future, accessed July 15th, 2023 Search PubMed.
- S. Haslinger, M. Hummel, A. Anghelescu-Hakala, M. Määttänen and H. Sixta, Upcycling of cotton polyester blended textile waste to new man-made cellulose fibers, Waste Manage., 2019, 97, 88–96 CrossRef CAS PubMed.
- S. Haslinger, Y. Wang, M. Rissanen, M. B. Lossa, M. Tanttu, E. Ilen, M. Määttänen, A. Harlin, M. Hummel and H. Sixta, Recycling of vat and reactive dyed textile waste to new colored man-made cellulose fibers, Green Chem., 2019, 21, 5598–5610 RSC.
- M. Mäkelä, M. Rissanen and H. Sixta, Machine vision estimates the polyester content in recyclable waste textiles, Resour., Conserv. Recycl., 2020, 161, 105007 CrossRef.
- H. P. Boehm, Chemical identification of surface groups, J. Adv. Catal. Sci. Technol., 1966, 16, 179–274 CAS.
- S. Tamada, K. Iida and T. Maruyama, Improvement of sound absorption characteristics by controlling the airflow resistance of surface layers, The Journal of the INCE of Japan, 2010, 34(4), 317–324 Search PubMed.
- P. C. C. Faria, J. J. M. Orfao and M. F. R. Pereira, Adsorption of anionic and cationic dyes on activated carbons with different surface chemistries, Water Res., 2004, 38, 2043–2052 CrossRef CAS.
- L. Bulgariu, L. B. Escudero, O. S. Bello, M. Iqbal, J. Nisar, K. A. Adegoke, F. Alakhras, M. Kornaros and I. Anastopoulos, The utilization of leaf-based adsorbents for dyes removal: a review, J. Mol. Liq., 2019, 276, 728–747 CrossRef CAS.
- D. Chen, L. Wang, Y. Ma and W. Yang, Super-adsorbent material based on functional polymer particles with a multilevel porous structure, NPG Asia Mater., 2016, 8, e301 CrossRef.
- N. Hassan, A. Shahat, A. El-Didamony, M. G. El-Desoukya and A. A. El-Bindary, Mesoporous iron oxide nano spheres for capturing organic dyes from water sources, J. Mol. Struct., 2020, 1217, 128361 CrossRef CAS.
- A. T. Khadim, T. M. Albayati and N. M. C. Saady, Removal of sulfur compounds from real diesel fuel employing the encapsulated mesoporous material adsorbent Co/MCM-41 in a fixed-bed column, Microporous Mesoporous Mater., 2022, 341, 112020 CrossRef CAS.
- S. Lagergren, About the theory of so-called adsorption of soluble substances, Kongl. Vetensk. Acad. Handl., 1898, 24, 1–39 Search PubMed.
- Y. S. Ho and G. McKay, Pseudo-second order model for sorption processes, Process Biochem., 1997, 34, 451–465 CrossRef.
- N. Tahir, H. N. Bhatti, M. Iqbal and S. Noreen, Biopolymers composites with peanut hull waste biomass and application for crystal violet adsorption, Int. J. Biol. Macromol., 2017, 94, 210–220 CrossRef CAS PubMed.
- I. Abe, K. Hayashi and M. Kitagawa, Studies on the adsorption of surfactants on activated carbons. I. Adsorption of nonionic surfactants, Yukagaku, 1976, 25, 145–150 CAS.
- N. S. Ali, H. N. Harharah, I. K. Salih, N. M. C. Saady, S. Zendehboudi and T. M. Albayati, Applying MCM-48 mesoporous material, equilibrium, isotherm, and mechanism for the effective adsorption of 4-nitroaniline from wastewater, Sci. Rep., 2023, 13, 9837 CrossRef CAS.
- Y. P. Gong, Z. Y. Ni, Z. Z. Xiong, L. H. Cheng and X. H. Xu, Phosphate and ammonium adsorption of the modified biochar based on Phragmites australis after phytoremediation, Environ. Sci. Pollut. Res., 2017, 24, 8236–8335 CrossRef PubMed.
- P. L. Homagai, R. Poudel, S. Poudel and A. Bhattarai, Adsorption and removal of crystal violet dye from aqueous solution by modified rice husk, Heliyon, 2022, 8, e09261 CrossRef CAS PubMed.
- J. O. Quansah, T. Hlaing, F. N. Lyonga, P. P. Kyi, S.-H. Hong, C.-G. Lee and S.-J. Park, Nascent rice husk as an adsorbent for removing cationic dyes from textile wastewater, Appl. Sci., 2020, 10(10), 3437 CrossRef CAS.
- S. Shoukat, H. N. Bhatti, M. Iqbal and S. Noreen, Mango stone biocomposite preparation and application for crystal violet adsorption: a mechanistic study, Microporous Mesoporous Mater., 2017, 239, 180–189 CrossRef CAS.
- H. Parab, M. Sudersanan, N. Shenoy, T. Pathare and B. Vaze, Use of agro–industrial wastes for removal of basic dyes from aqueous solutions, Clean: Soil, Air, Water, 2009, 37(12), 963–969 CAS.
- R. Ahmad, Studies on adsorption of crystal violet dye from aqueous solution onto coniferous pinus bark powder (CPBP), J. Hazard. Mater., 2009, 171(1–3), 767–773 CrossRef CAS.
- M. Baghdadi, A. Jafari and A. Pardakhti, Removal of crystal violet from aqueous solutions using functionalized cellulose microfibers: a benefit use of cellulosic healthcare waste, RSC Adv., 2016, 6, 61423 RSC.
| This journal is © The Royal Society of Chemistry 2024 |

