Non-stoichiometric CuxIn1−xS quantum dots for robust photodegradation of gemifloxacin: influencing parameters, intermediates, and insights into the mechanism†
Received
22nd June 2022
, Accepted 8th September 2022
First published on 21st September 2022
Abstract
Non-stoichiometric quantum dots (QDs) have gathered wide attention in advanced oxidation processes for environmental remediation due to their ability to generate highly reactive oxygen active species. Here, a series of promising non-stoichiometric CuxIn1−xS QDs were fabricated via the reflux method and examined toward the degradation of gemifloxacin (GMF) under visible light. Cu0.75In0.25S QD showed optimum activity toward GMF degradation (95% in 2 h, rate const = 258 × 10−4 min−1) with a TOC (total organic carbon) efficiency of 70% due to the non-stoichiometric arrangement of Cu and In metals, which not only promoted the spatial excitons separation efficiency but also bestowed the reducing power of photo-induced electrons as supported by the required characterization. Further, the compositional ratio and phase pure chalcopyrite CuxIn1−xS QDs indicate the good formation of the composition tunable materials. Additionally, an in-depth study was performed to study the effect of anions and pH on the degradation efficiency. Moreover, the scavenging experiments illustrate that ˙O2− and ˙OH (indirect route) radicals play a dominant role in GMF degradation, whereas the cycling test showed long-term durability of Cu0.75In0.25S QD. Eventually, the degradation route was traced by recognizing the intermediate products via. LC-MS study. This research provides an innovative platform for efficient photocatalytic pollutant degradation by non-stoichiometric CuxIn1−xS QDs in a sustainable environment.
Environmental significance
The occurrence of antibiotics in the environment resulting in the development of antibiotic resistive microbes has gathered increasing attention from the scientific community because of potential adverse ecological and human impacts. Solar-light driven photocatalysts with high efficiency and durability provide environmental benign and sustainable pathway to address the growing concerns of these hazardous and life threatening micropollutants. Herein, a series of promising non-stoichiometric visible light active CuxIn1−xS QDs were fabricated via reflux method and examined towards the degradation of pharmaceutical micro pollutant gemifloxacin (GMF) under LED light. Out of the prepared QDs, Cu0.75In0.25S portrayed the optimum activity towards GMF degradation due to the non-stoichiometric arrangement of Cu and In metals, which not only promoted the spatial excitons separation efficiency but also bestowed the reducing power of photo-induced electrons. The finding is expected to open a new avenue for the fabrication of non-stoichiometric QDs for water treatment in particular and environmental remediation in general.
|
Introduction
The rapid growth of civilization and modernization has led to excessive production and use of pharmaceutics and personal-care products, which adversely affect the water ecosystem and hence have become a global issue requiring urgent attention.1,2 Among the water contaminants, the antibiotic gemifloxacin (GMF) is a major concern for the research community because both the human and animal kingdoms have been largely infected by these chronic and toxic water pollutants.3 Thus, several countries are avoiding the excessive and unnecessary use of antibiotics in veterinary, agricultural, meat, and dairy based foodstuffs.4–6 Further, the presence of these contaminants in surface and groundwater causes the growth of antibiotic-resistive micro-organisms (bacteria, parasites, viruses, and fungi) (ARM) termed superbugs.7 Broadly, GMF is a non-biodegradable, successful flouro-quinoline antibacterial oral drug, which is used worldwide for the treatment of severe bacterial amplification of chronic inflammation of bronchial tubes and mild to modest pneumonia in veterinary and human sectors causing acute environmental and health problems (ARM and genotoxicity) with limited adverse effect as per the report issued by WHO in 2014.7
Several methods such as electro-Fenton, adsorption, ozonization, biological decontamination, and membrane filtration have been developed and tested toward different antibiotic degradation reactions but are found to be ineffective.8 For example, the Fenton process requires excessive addition of H2O2, which limits its practical implementation. Similarly, in the adsorption process, the recovery of the adsorbate and separation of pollutants from adsorbate are some of the associated shortcomings of the process. Furthermore, the membrane filtration process is subjected to fouling, where the pollutant gets attached to the membrane surface reducing its efficiency and increasing energy and cost usages. Beside, in the ionization process, the major drawbacks are lack of an ozone residual time, corrosion of pipes and fixtures, and requiring storage tanks for treatment purposes.8 Therefore, the current scenario crucially demands a cost-effective, eco-friendly, highly efficient treatment for pollutant removal. In this regard, photo-degradation of GMF is a feasible and green technique to circumvent the harmfulness and mineralize the antibiotic by forming bio-degradable products. Meanwhile, our group has extensively studied photocatalytic degradation of various antibiotics over a wide range of materials such as ZFCN@PPY, B/S doped-TiO2, ZnFe2O4@WO3−x/polypyrrole, WO3−x@ZnFe2O4, and Ce2Zr2O7@rGO.10–14
Currently, semiconductor arbitrated photocatalytic ministrations of harmful pollutants have gathered huge research interest owing to their economical and environment-friendly nature. For an efficient photocatalytic reaction, a semiconductor must have the necessary band edge potential and absorb broad light energy to produce the exciton pairs, which are effectively separated. Recently, immense efforts have been made by researchers in designing competent light-sensitive photocatalysts, based upon dimensional-oriented metal chalcogenides owing to their efficacious optical properties.15–20 From this standpoint, quantum dots (QDs) are regarded as effectual photocatalysts due to their extensive absorption from the visible to near IR regions, ultra-small size (less than 10 nm), large surface binding capacity, and quantum confinement effect.21 Additionally, ternary QDs have recently generated significant attention and considered environmentally benign alternatives against conventional binary QDs containing heavier toxic metals such as Hg, Cd, and Pb. In this regard, non-stoichiometric copper indium sulphide QDs, a part of group I–III–VI, are considered as robust photocatalysts showing an optical bowing effect, i.e., the optical properties can be tuned by changing the molar ratio of the respective elements.22 Besides, Hu et al. made an interesting observation in Cu-rich CIS QDs, where the major transitions are from the conduction band to the indium vacancy (VIn) or the indium site substituted by copper (CuIn) and from the sulfur vacancy (VS) to the valence band.23 However, in Cu-deficient CIS QDs, the key transitions are from the sulfur vacancy to the copper vacancy and from the copper site substituted by indium (InCu) to the copper vacancy (VCu). Here, InCu and VS performed as donors, and VIn, VCu and CuIn acts as acceptors, suggesting that defect states in the CIS are mostly dependent on the composition ratio of the constituent elements. Hence, by varying the composition, it is possible to tune their optical properties and photocatalytic activity for different reduction reactions.24 Non-stoichiometric CuxIn1−xS QDs are dazzling semiconductor photocatalysts for pollutant degradation due to their suitable bandgap energy (Eg = 1.6–2.4 eV), which can successfully capture most part of the solar light. The conduction band (CB) potential of CuxIn1−xS makes it more appropriate for the generation of superoxide radical (˙O2−), which acts as a powerful species in the antibiotic degradation process by following a photo-reduction mechanism.25
This study reports exotic CuxIn1−xS photocatalytic systems fabricated successfully by the reflux strategy by varying Cu and In ratios of 0.25![[thin space (1/6-em)]](https://www.rsc.org/images/entities/char_2009.gif) :
:![[thin space (1/6-em)]](https://www.rsc.org/images/entities/char_2009.gif) 0.75, 0.5
0.75, 0.5![[thin space (1/6-em)]](https://www.rsc.org/images/entities/char_2009.gif) :
:![[thin space (1/6-em)]](https://www.rsc.org/images/entities/char_2009.gif) 0.5, and 0.75
0.5, and 0.75![[thin space (1/6-em)]](https://www.rsc.org/images/entities/char_2009.gif) :
:![[thin space (1/6-em)]](https://www.rsc.org/images/entities/char_2009.gif) 0.25, respectively. Here, TGA was used as a capping agent, which controlled the size of the particle and averted the formation of binary QDs. Also, tuning of the bandgap energy was observed, while varying the molar ratio of Cu
0.25, respectively. Here, TGA was used as a capping agent, which controlled the size of the particle and averted the formation of binary QDs. Also, tuning of the bandgap energy was observed, while varying the molar ratio of Cu![[thin space (1/6-em)]](https://www.rsc.org/images/entities/char_2009.gif) :
:![[thin space (1/6-em)]](https://www.rsc.org/images/entities/char_2009.gif) In, resulting in the variation of the optical properties. Further, the non-stoichiometric 0D QDs showed better charge-carrier separation as well as migration, as confirmed by PL, EIS, and Bode phase analysis, which eventually boosted the photocatalytic degradation efficiency of antibiotics via direct superoxide and an indirect hydroxyl radical pathway, as evidenced by the scavenger test, TA, NBT, and EPR analysis. Additionally, the effect of anions and pH variation were well studied. In addition, to the best of our knowledge, CuxIn1−xS QD photocatalysts have not been explored so far for the degradation of GMF, so this work will provide new scope for researchers working in this field.
In, resulting in the variation of the optical properties. Further, the non-stoichiometric 0D QDs showed better charge-carrier separation as well as migration, as confirmed by PL, EIS, and Bode phase analysis, which eventually boosted the photocatalytic degradation efficiency of antibiotics via direct superoxide and an indirect hydroxyl radical pathway, as evidenced by the scavenger test, TA, NBT, and EPR analysis. Additionally, the effect of anions and pH variation were well studied. In addition, to the best of our knowledge, CuxIn1−xS QD photocatalysts have not been explored so far for the degradation of GMF, so this work will provide new scope for researchers working in this field.
Experimental section
Synthesis of CuxIn1−xS QDs
A single pot reflux technique was adopted to synthesize the CuxIn1−xS composite by following our previous literature, where favorable amounts of CuCl2·2H2O, InCl3·4H2O, and Na2S·9H2O were picked as precursors of copper, indium, and sulphur, respectively.26 A total of 1 mmol of Cu and In precursors along with 10 mmol of TGA as the capping ligand were taken into two-necked round bottom (RB) flask and dissolved in the required amount of distilled water. In order to maintain the pH = 8.5 of the mixture solution, 1 M NaOH solution was added and subsequently, an aqueous solution of 0.52 mmol Na2S·9H2O was inserted into the RB. The entire solution was refluxed for 4 h at 100 °C, which was precipitated by adding ethanol, followed by dehydration at 40 °C under vacuum. Typically, a series of CuxIn1−xS QDs were prepared with three different molar ratios of Cu![[thin space (1/6-em)]](https://www.rsc.org/images/entities/char_2009.gif) :
:![[thin space (1/6-em)]](https://www.rsc.org/images/entities/char_2009.gif) In i.e., 0.75
In i.e., 0.75![[thin space (1/6-em)]](https://www.rsc.org/images/entities/char_2009.gif) :
:![[thin space (1/6-em)]](https://www.rsc.org/images/entities/char_2009.gif) 0.25, 0.50
0.25, 0.50![[thin space (1/6-em)]](https://www.rsc.org/images/entities/char_2009.gif) :
:![[thin space (1/6-em)]](https://www.rsc.org/images/entities/char_2009.gif) 0.50, and 0.25
0.50, and 0.25![[thin space (1/6-em)]](https://www.rsc.org/images/entities/char_2009.gif) :
:![[thin space (1/6-em)]](https://www.rsc.org/images/entities/char_2009.gif) 0.75, respectively, as illustrated in Scheme 1. All the above-used chemicals were of analytical grade and high purity (Merck company), so used as such such without any further purification.
0.75, respectively, as illustrated in Scheme 1. All the above-used chemicals were of analytical grade and high purity (Merck company), so used as such such without any further purification.
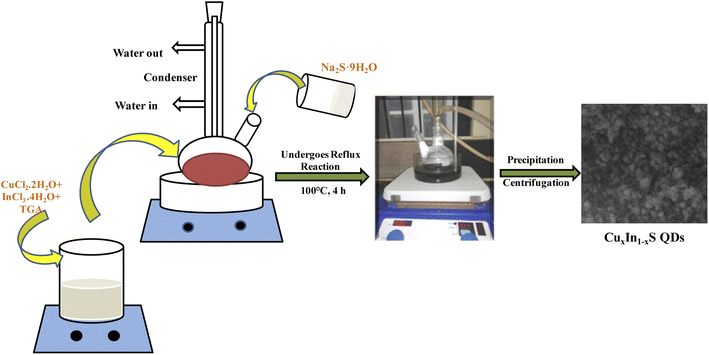 |
| | Scheme 1 Scheme for the synthesis of CuxIn1−xS QDs by varying Cu![[thin space (1/6-em)]](https://www.rsc.org/images/entities/char_2009.gif) : :![[thin space (1/6-em)]](https://www.rsc.org/images/entities/char_2009.gif) In molar ratios via the reflux strategy. In molar ratios via the reflux strategy. | |
Results and discussion
Structure, morphology, and surface composition analysis
The crystallinity and phase purity of the fabricated catalysts were analyzed using PXRD (powder X-ray diffraction), as revealed from the data in Fig. 1(a). It was observed that CuxIn1−xS QDs with varying compositional ratios of Cu and In showed similar XRD patterns with 2θ values at 28.7° (112), 46.95° (220), and 54.9° (312), corresponding to (ICDD card no. 85-1575) the chalcopyrite phase without any impurity peaks, confirming phase purity of the crystals.24 Further, from Fig. 1(b), the fringe pattern of the Cu0.75In0.25S nanocrystal, confirmed the existence of (112) and (220) planes with dspacing values of 0.32 and 0.20 nm, respectively, which showed a good correlation with the XRD data. The angle between the two planes was calculated to be 54°, confirming the chalcopyrite phase in the material, which correlated well with the XRD results. Again, the FESEM image of Cu0.75In0.25S showed particle-like morphology as shown in Fig. 1(c). Additionally, the HRTEM image, as presented in Fig. 1(d), indicated the formation of Cu0.75In0.25S QD with an average particle size of 3.62 nm, as shown in the inset of Fig. 1(d). Furthermore, the energy dispersive X-ray (EDX) image and color mapping picture of Cu0.75In0.25S QD showed the presence of all the constitutional elements such as Cu, In, and S without any impurity element, which was well supported by XPS analysis (Fig. S1(a)–(e)†).
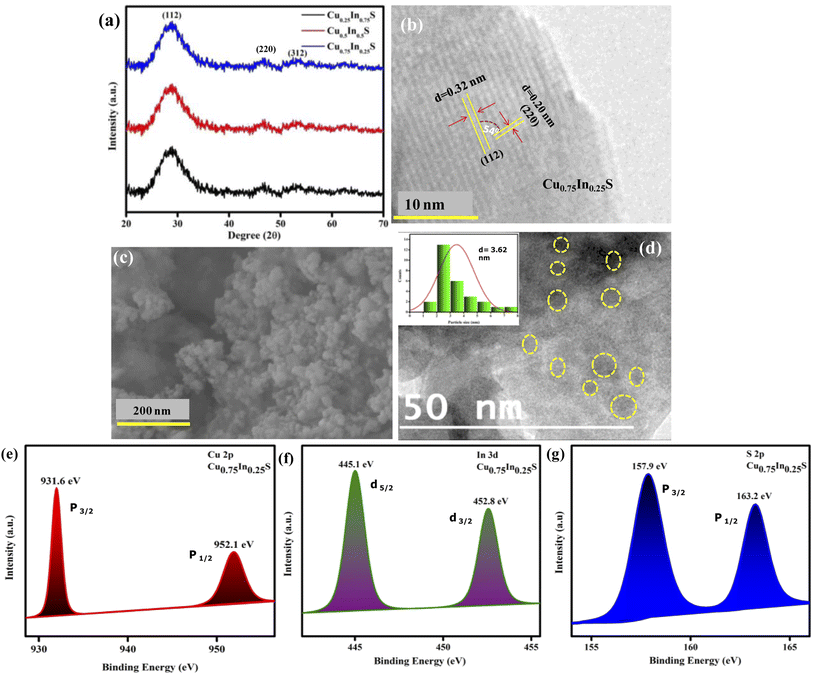 |
| | Fig. 1 Structural and compositional characterization: (a) XRD pattern of CuxIn1−xS QDs with 3 different molar ratios 0.75![[thin space (1/6-em)]](https://www.rsc.org/images/entities/char_2009.gif) : :![[thin space (1/6-em)]](https://www.rsc.org/images/entities/char_2009.gif) 0.25, 0.50 0.25, 0.50![[thin space (1/6-em)]](https://www.rsc.org/images/entities/char_2009.gif) : :![[thin space (1/6-em)]](https://www.rsc.org/images/entities/char_2009.gif) 0.50, and 0.25 0.50, and 0.25![[thin space (1/6-em)]](https://www.rsc.org/images/entities/char_2009.gif) : :![[thin space (1/6-em)]](https://www.rsc.org/images/entities/char_2009.gif) 0.75 of Cu 0.75 of Cu![[thin space (1/6-em)]](https://www.rsc.org/images/entities/char_2009.gif) : :![[thin space (1/6-em)]](https://www.rsc.org/images/entities/char_2009.gif) In, respectively (b) fringe pattern, (c) FESEM and (d) HRTEM images of Cu0.75In0.25S QD; (e) XPS analysis spectra of Cu 2p, (f) In 3d, and (g) S 2p elements in Cu0.75In0.25S QD. In, respectively (b) fringe pattern, (c) FESEM and (d) HRTEM images of Cu0.75In0.25S QD; (e) XPS analysis spectra of Cu 2p, (f) In 3d, and (g) S 2p elements in Cu0.75In0.25S QD. | |
XPS (X-ray photoelectron spectroscopy) is an important tool to inspect the elemental compositions with their ratios and chemical states of the corresponding elements in the Cu0.75In0.25S QD, as observed from the data in Fig. 1. The XPS survey spectrum of Cu0.75In0.25S QD shown in the ESI file (Fig. S2†), revealed the presence of all the constituent elements (Cu, In and S) correlating with the EDX analysis, indicating compositional purity. From Fig. 1(e), it is notable that, the binding energies of 952.1 and 931.6 eV corresponded to two deconvoluted peaks of Cu 2p1/2 and Cu 2p3/2 spin levels, respectively, validating the existence of Cu+ in the Cu0.75In0.25S unit with no impurity peaks. Further, the spin–orbit coupling states, i.e., 3d5/2 and 3d3/2 of In3+ are located at 445.2 and 452.8 eV, respectively, as shown in Fig. 1(f).26,27 Additionally, sulphur was manifested by a doublet peak at binding energies of 157.7 eV and 163.1 eV corresponding to S 2p3/2 and S 2p1/2, respectively, owing to spin–orbit coupling.28 This revealed the binding of S to Cu and In in Cu0.75In0.25S QD, as demonstrated in Fig. 1(g). Besides, the compositional ratio of Cu![[thin space (1/6-em)]](https://www.rsc.org/images/entities/char_2009.gif) :
:![[thin space (1/6-em)]](https://www.rsc.org/images/entities/char_2009.gif) In in Cu0.75In0.25S QD was revealed by XPS analysis and was found to be 0.74
In in Cu0.75In0.25S QD was revealed by XPS analysis and was found to be 0.74![[thin space (1/6-em)]](https://www.rsc.org/images/entities/char_2009.gif) :
:![[thin space (1/6-em)]](https://www.rsc.org/images/entities/char_2009.gif) 0.26, which is quite reliable with the molar ratios of Cu and In precursors taken during synthesis. Therefore, it is noticeable from the above data that copper and indium are very well balanced during the fabrication time and non-stoichiometric Cu0.75In0.25S QD was formed as per the estimation. Similarly, the compositional ratios for other prepared catalysts are tabulated in Table S1.†
0.26, which is quite reliable with the molar ratios of Cu and In precursors taken during synthesis. Therefore, it is noticeable from the above data that copper and indium are very well balanced during the fabrication time and non-stoichiometric Cu0.75In0.25S QD was formed as per the estimation. Similarly, the compositional ratios for other prepared catalysts are tabulated in Table S1.†
Optical absorption and charge separation properties
The optical and charge separation properties were characterized by UV vis-DRS, PL, and EIS analysis. Fig. 2(a) depicts the absorbance of the synthesized materials, which indicates that all copper–indium–sulfide QDs exhibit a wider absorbance in the visible region and extends up to the near IR region due to the inherent property of the QD materials.29 As a result, the materials can utilize almost all portions of solar energy in the visible and as a small fraction of the IR spectrum, leading to a superior optical property. Here, from the figure, it is obvious that the absorbance shown by Cu0.75In0.25S is greater than that by the other materials, showing its better photon absorption capability than Cu0.5In0.5S and Cu0.25In0.75S QDs. Adding more, Fig. 2(b) represents the Tauc plot of the as-prepared materials, which shows bandgap energies (BE) of 1.84, 2.03, and 2.24 eV for Cu0.25In0.75S, Cu0.5In0.5S, and Cu0.75In0.25S QDs, respectively, by using the Kubelka–Munk equation as given below (eqn (1)):12where, h = Planck's constant = 6.626 × 10⁻³⁴ J s, α = absorbance coefficient, v = frequency of photon, A = proportionality constant and the value of n suggests type of electronic transition, i.e., for indirect transition, n = 1/2 and for direct transition, n = 2. Additionally, Fig. 2(c) depicts the Mott–Schottky (MS) plots of as-prepared materials with positive MS slopes indicating n-type nature, and flat band potentials (Fp) at the electrode–electrolyte interface were estimated to be −0.94, −1.04 and −1.10 V vs. Ag/AgCl (pH 6.8) for Cu0.25In0.75S, Cu0.5In0.5S, and Cu0.75In0.25S QDs, respectively.13,26 Further, the higher negative shift in Fp of Cu0.75In0.25S with respect to other samples suggests greater availability of electrons or higher donor density, resulting in improved photocatalytic activity. The increased electron concentration causes the origin of a built-in electric field near the electrode–electrolyte junction leading to effective charge isolation and migration that ultimately boost the degradation rate of GMF over Cu0.75In0.25S.30 In addition, the conduction band (CB) potentials of the above materials were recalculated on the NHE scale and were found to be −0.65, −0.75, and −1.01 V vs. NHE (pH 7) for Cu0.25In0.75S, Cu0.5In0.5S, and Cu0.75In0.25S QD, respectively. Hence, using eqn (2), valence band (VB) potentials of the as-synthesized samples were calculated and the obtained results are listed in Table S2.†
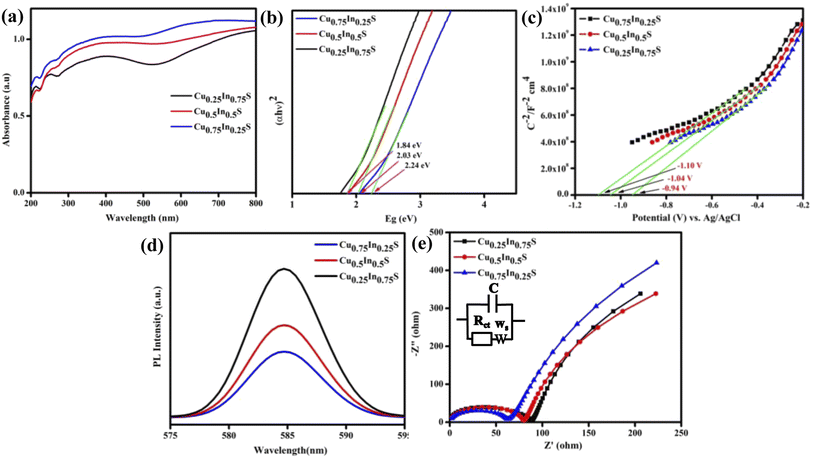 |
| | Fig. 2 Optoelectronic study of Cu0.25In0.75S (black line), Cu0.5In0.5S (red line), and Cu0.75In0.25S (blue line) QDs: (a) UV-Vis DRS spectra, (b) Tauc plot, (c) the M–S plot over a frequency of 1000 Hz in 0.1 M Na2SO4, (d) PL spectra, and (e) the EIS plot. | |
Again Fig. 2(d) shows the PL spectra of the as-synthesized samples, which indicates the charge carrier separation and migration efficiency of the materials. The more intense PL peak suggests the least charge carrier separation, whereas, the less intense peak indicates more exciton separation efficiency. From the figure, it is clear that the Cu0.75In0.25S QD shows greater charge carrier separation efficiency than the other two materials leading to a better photocatalytic activity, which is quite relevant to EIS and TPC analysis. Fig. 2(e) shows the electrochemical impedance spectroscopy (EIS) plot of the synthesized materials in zero applied bias and the fitted circuit diagram is shown in the inset of that figure, where C, Ws, and Rct are double-layer capacitance, Warburg impedance and charge transfer resistance, respectively.31 Herewith, the straight line portion entails the Warburg resistance, whereas the semicircle part is about the Rct value, specifying the conductance efficiency of the photocatalysts. The larger the semicircle radius more will be its interface resistance resulting in lesser conductance with smaller charge carrier separation efficiency and vice versa.32 Here, in the figure, the smallest semicircle radius of Cu0.75In0.25S indicates the smallest Rct value leads to better charge carrier separation among all other samples, which enhances the photocatalytic activity of the material. Furthermore, the lifetime of the injected photo-electrons of the prepared QDs was estimated from the Bode phase plot (Fig. S3(a)†) following eqn (3). Basically, the migration time of photogenerated electrons from the sample to electrolyte was correlated with the shift in the peak location toward the lower frequency zone, indicating accelerated transport of electrons.33
| |  | (3) |
In addition, a lower value of fmax (frequency), as observed for Cu0.75In0.25S QD, corresponds to a greater life time of the injected electrons (41 μs), resulting in a significant increment in the catalytic activity compared to the other two Cu0.25In0.75S, and Cu0.5In0.5S QDs having τn values of 36 and 38 μs, respectively. This result is also relevant to the PL and TPC analysis, where the charge carrier separation follows the order, Cu0.25In0.75S < Cu0.5In0.5S < Cu0.75In0.25S. To double-check the larger exciton life time for Cu0.75In0.25S QD, time-resolved-photoluminescence (TR-PL) analysis was carried out. The TR-PL data showed that all synthesized materials could be well fitted to the tri-exponential function by using eqn (S1) and (S2) from the ESI file.† The more the decay time, the greater the exciton separation, thereby, decreasing the recombination rate. From Fig. S3(b),† it is obvious that Cu0.75In0.25S shows an overhead exciton life-time of 1.43 ns, followed by Cu0.5In0.5S (1.15 ns) and Cu0.25In0.75S (1.03 ns), which is well correlated with the Bode phase data, resulting in superior photocatalytic activity.
Photocurrent response
Furthermore, the linear sweep voltammetry (LSV) analysis, as illustrated in Fig. 3(a), suggests the photocurrent density of the synthesized material. It is noteworthy that, the more the photo-current density more will be its photocatalytic activity. In this context, the current density of the Cu0.75In0.25S QD is more than that of Cu0.25In0.75S and Cu0.5In0.5S materials under visible light irradiation, leading to better photocatalytic activity. Cu0.75In0.25S, Cu0.25In0.75S and Cu0.5In0.5S materials showed anodic currents of 1.48, 1.22, and 1.09 mA cm−2, respectively, which again supports their n-type character. Additionally, transient photo-current (TPC) measurement indicates the charge carrier generation, separation efficiency, and durability of the excitons by showing photocurrent response under ON–OFF light illumination.34 In dark and light, there was a sudden decrease and increase in photo-current density, suggesting a quick light response of the photo-anodes. The more the photocurrent density more will be the exciton generation and separation efficiency, thereby increasing the photodegradation of antibiotics. From Fig. 3(b), it is clear that Cu0.75In0.25S QD shows the highest photo-current density under interrupted light irradiation at −0.3 V (vs. Ag/AgCl) biasing potential, as compared to the other materials, leading to better exciton separation. Moreover, chronoamperometry analysis (CA) was performed to test the photo-stability of the as-synthesized materials. It is noticeable that all the synthesized materials are stable under light illumination for a period of 900 s with a constant photocurrent value. From Fig. 3(c), it was observed that, Cu0.75In0.25S showed a higher current density of 24.5 μA cm−2 at 0.2 V applied voltage under light illumination than Cu0.25In0.75S (15.7 μA cm−2) and Cu0.5In0.5S (18.2 μA cm−2), showed better photo-stability among all materials.
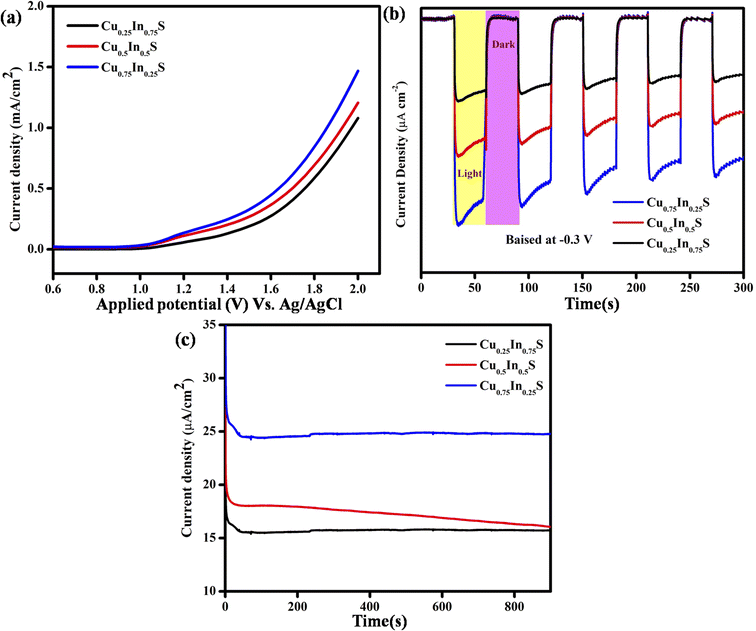 |
| | Fig. 3 Photocurrent study of the synthesized materials with various Cu/In ratios: (a) LSV plot, (b) TPC response at −0.3 V biasing potential, and (c) CA plot at 0.2 V applied potential. | |
Evaluation of photocatalytic performance
Investigation of the photodegradation performance of the designed catalysts over pharmaceutical pollutant gemifloxacin (GMF).
The photodegradation ability of the as-prepared catalysts was examined toward quinoline-type antibiotic GMF (10 ppm) as the model pollutant. The quantitative degradation of GMF over different catalysts was well confirmed from the rapid decrease in its characteristic optical absorption peak intensity observed at about wavelength 270 nm and 343 nm, respectively (Fig. 4(a)). Further, the adsorption of GMF over the synthesized samples was very negligible, hence not an effective value for pollutant removal. As expected the photodegradation efficacy (D%) of GMF by Cu0.75In0.25S, Cu0.5In0.5S, and Cu0.25In0.75S samples were 95%, 86%, and 59%, respectively, in 2 h, as illustrated in Fig. 4(b). Additionally, Fig. 4(c) depicts the kinetic model toward the degradation of GMF over different photocatalytic materials, which fits well with the pseudo-first-order kinetic via the following eqn (4):10,13| |  | (4) |
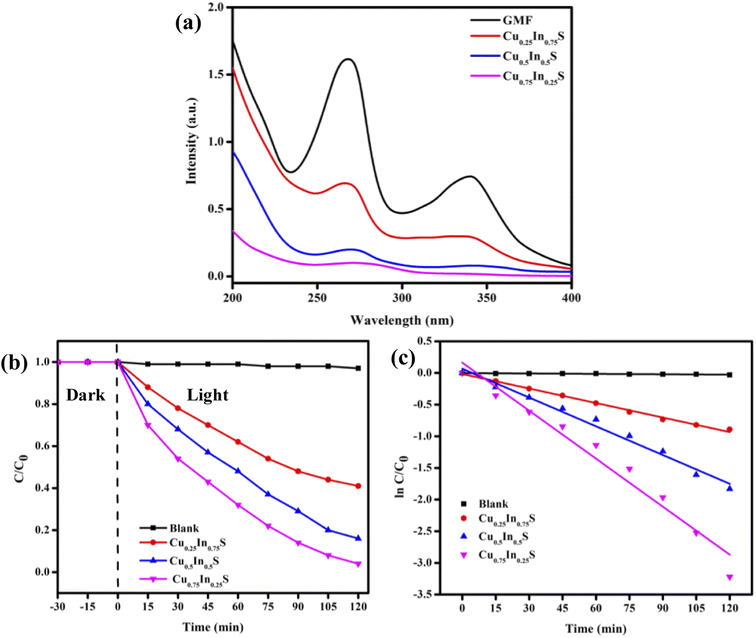 |
| | Fig. 4 GMF (10 ppm) degradation in 2 h over synthesized photocatalysts (a) absorbance plot, (b) effect of catalysts on degradation, and (c) fitted kinetic curve for the pseudo-first-order reaction. | |
Furthermore, the half-life period (t1/2) was calculated employing the below eqn (5):
Here, kapp-is the rate constant (min−1) and R2-co-relation co-efficient factor for GMF degradation and the detailed obtained values are included in Table 1. From the above data it is clear that the Cu0.75In0.25S photocatalyst shows the best activity with the highest rate constant and low t1/2 value; hence, further studies were performed by taking this sample as the primary material. Also, a comparison table (Table. S3†) is given for other catalysts toward GMF degradation, which indicates that our catalyst showed better photocatalytic activity under 20 W LED light irradiation. Additionally, the photostability of Cu0.75In0.25S QD was also studied to evaluate the reusability of the catalyst under the performed degradation condition. In this case, the GMF degradation experiment was performed five successive times with the same catalyst, and the obtained degradation efficiency after each run was recorded, as depicted in Fig. S4(a).† From the plot, a very little drop in efficiency was observed even after 5 consecutive cycles, which implied excellent durability of the as-prepared QD under operational conditions. However, the visualized reduction in the removal rate corresponded to the loss of the catalyst amount during the recovery process. Besides, XRD and optical absorbance of the material, after and before use (shown in Fig. S4(b) and (c)†) indicated no change in characteristics, which again confirmed the extraordinary stability of the catalyst.
Table 1 Detail values of the reduction percentage, R2, kapp and t1/2 for all synthesized samples after GMF degradation
| Photocatalyst |
Degradation efficiency (%) |
(R2) |
(kapp) (10−4 min−1) |
t
1/2 (min) |
| Blank |
3 |
0.93 |
5 |
0.1386 |
| Cu0.25In0.75S |
59 |
0.99 |
76 |
0.0091 |
| Cu0.5In0.5S |
86 |
0.98 |
151 |
0.0045 |
| Cu0.75In0.25S |
95 |
0.96 |
258 |
0.0026 |
Effect of environmental factors on GMF degradation
Effect of pH.
To obtain a detailed insight into the photocatalytic degradation of Gemifloxacin (GMF), some additional investigations were conducted with the best (Cu0.75In0.25S) photocatalyst and the obtained results are shown in Fig. 5. The solution pH plays a pivotal role in the degradation process. In brief, the photo-degradation experiment was carried out in acidic, neutral, and basic environments, as shown in Fig. 5(a). In this work, the photocatalytic decomposition of GMF was studied under different pH values and the obtained results were found to be 64%, 95%, and 72% at pH 3.0, 6.0, and 9.0, respectively. It can be observed that a low removal efficiency was witnessed under strong acidic (pH = 3) and basic (pH = 9) conditions, while the maximum degradation/removal efficiency was achieved at pH 6 after 120 min of 20 W LED irradiation. However, two pKa values were reported for GMF, where it exists in cationic (GMF+) below pKa 5.53 and anionic (GMF−) above pKa 9.23.35 Fundamentally, the catalyst surface is positively charged, if the pH of the solution is lower than that of point of zero charge (PZC) value and negatively charged, if pH is above the PZC value. Similarly, from the pKa value perspective, the pollutant behaves positively charged if the pKa < solution pH and negatively charged at the higher pH value (pKa > solution pH).13 The PZC value of Cu0.75In0.25S was found to be 5.8 (as shown in Fig. S5†), which means that above this value the catalyst is negatively charged and below that value, it is positively charged. As discussed above, GMF has two pKa values, pKa1 = 5.53 and pKa2 = 9.23. The pH study displayed the best activity at pH = 6, where the catalyst surface becomes negatively charged (pH > 5.8) and GMF appears positively charged (pH < pKa1), so both the adsorbent (photocatalyst) and adsorbate (GMF pollutant) are strongly attached. Moreover, at pH 3 and 9; Cu0.75In0.25S acquires positive (pH < 5.8) and negative (pH > 5.8) charges, while GMF carry positive (pH < pKa1) and negative (pH > pKa2), respectively, causing repulsion between the photocatalyst and pollutant and hence reducing the overall degradation activity.
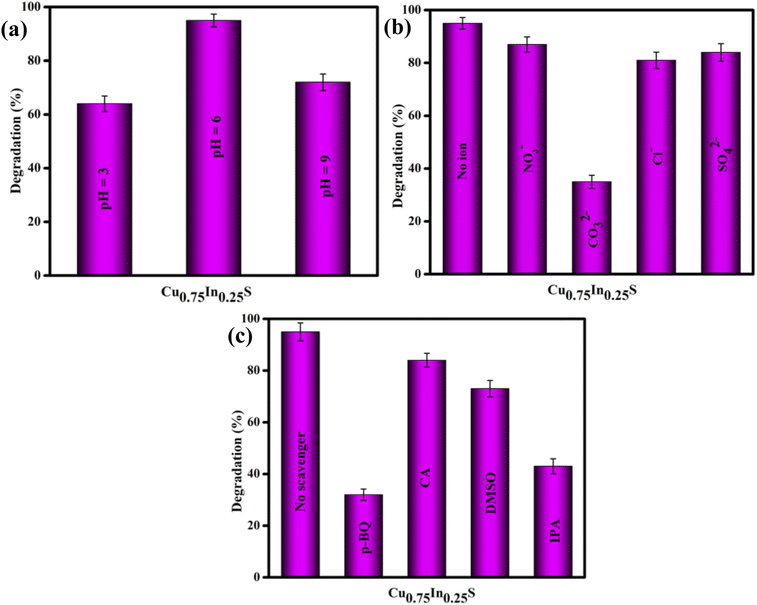 |
| | Fig. 5 Degradation efficiency of GMF over 10 ppm Cu0.75In0.25S photocatalyst on different (a) pH solutions, (b) anions, and (c) scavengers. | |
Effect of anions.
We know that the water ecosystem consists of several inorganic salts and impurities, therefore, it is significantly important to inspect the impacts/influence of several ions, specifically anions on the photocatalytic degradation of the GMF pollutant. For the anion study, 0.05 M of NaCl, NaNO3, Na2SO4, and Na2CO3 were added separately to the aqueous solution of GMF and the degradation experiments were performed following the same procedure under the same reaction conditions, as stated earlier. The results of this investigation are shown in Fig. 5(b). As per the presented results, SO42−, NO3−, and Cl− ions were found to have a minimum influence on GMF degradation, however, the photodegradation process was hampered and restricted significantly after the introduction of CO32− ions. The CO32− ions increase the pH of the reaction medium because of the hydrolyzation and can capture the free radicals or active species (˙OH and ˙O2−), primarily responsible for photocatalytic degradation of GMF.36
Active species trapping (NBT, TA, and ESR) study.
The assessment of trapping experiments was performed to trace the chief active radical/species responsible for the degradation of GMF by the Cu0.75In0.25S photocatalyst. In this direction, citric acid (CA), para-benzoquinone (p-BQ), isopropyl alcohol (IPA), and dimethylsulfoxide (DMSO) were utilized as trapping agents for holes (h+), superoxide radicals (˙O2−), hydroxyl radicals (˙OH), and electrons (e−), respectively. As highlighted in Fig. 5(c), the maximum degradation of GMF was observed in the absence of scavengers.37,38 However, a significant loss in degradation rate, or simply it could be stated that the photocatalytic degradation of GMF was drastically hindered (only 32%) in the presence of p-BQ and IPA (43%). This indicates that superoxide and hydroxyl radicals play a predominant role in GMF degradation. Furthermore, a slight inhibition in photocatalytic degradation was displayed after the addition of CA and DMSO, suggesting that the holes and electrons play some contribution toward GMF degradation.39 However, the valence band position of the catalyst is not suitable to produce hydroxyl radicals, therefore, the hydroxyl radicals are generated through an indirect route, i.e., superoxide radicals transfer to hydrogen peroxide, which then decomposes to form ˙OH radicals.9 The generation of superoxide and hydroxyl species over the catalyst surface was further confirmed from NBT (nitro blue tetrazolium chloride) and TA (terephthalic acid) experiments, following our previously reported articles.40 A peak at 259 nm in UV-Vis spectrum of NBT and PL-emission spectrum at about 423 nm of TA progressively decreased with Cu0.75In0.25S, suggesting that more superoxide and hydroxyl radicals were generated on Cu0.75In0.25S, which ultimately helped in the degradation of pollutants compared to other materials, as shown in the Fig. S6(a) and (b).† Further, to ensure the ˙O2− radicals production ability of the Cu0.75In0.25S system, electron spin resonance (ESR) study was carried out using DMPO as a spin-trap agent at different time intervals, as shown in Fig. S7.† As seen from the figure, four featured signals of DMPO–˙O2− were observed, which clearly indicated the formation of ˙O2− species and the peak intensity gradually increased with an increase in time from 0 to 15 min.
Mineralization/conversion pathways and possible mechanisms of GMF degradation
To determine the intermediate species formed during the photo-mineralization/degradation of GMF, LC-MS analysis was performed and the obtained results are displayed in Scheme 2. Based on the identified compounds, two possible mechanistic pathways are projected toward the degradation of GMF as illustrated below.41,42
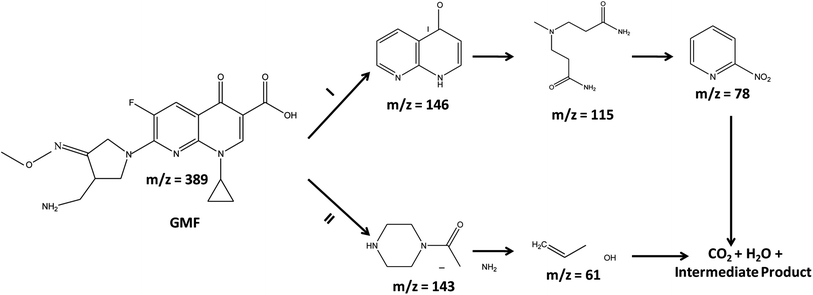 |
| | Scheme 2 Anticipated photodegradation pathways for the removal of gemifloxacin. | |
Pathway-1.
First, GMF is degraded to 2,3-dihydro-1,8-naphthyridin-4-one and then, to 3-[(3-amino-3-oxopropyl)-methylamino] propanamide and 2-nitropyridine. Finally, both the acid and nitro-compound get transferred to H2O, CO2, and intermediate species.
Pathway-2.
GMF decomposes to 2-amino-1-(piperazin-1-yl)ethan-1-one, which is then converted to prop-2-en-1-ol, which is then ultimately transferred to H2O, CO2, and fragmented species.
Generally, organic pollutants on mineralization or degradation are converted into carbon dioxide, water, and some intermediate products. However, nitrogen-containing aliphatic organic pollutants decompose into fragments such as amides and carboxylic acids, which further degrade to form the mineralized products. As is known, this mineralization ability of the material plays a vital role in scrutinizing the catalytic potential of the photocatalyst. In this investigation, the decomposition of antibiotic GMF over non-stoichiometric Cu0.75In0.25S QD was tested via total organic carbon (TOC) analysis. Further, the extent of mineralization in terms of TOC was calculated using the equation mentioned below (6):
| | | % of mineralization = (T0 − Tt) /T0 | (6) |
Here, T0 and Tt stand for the TOC of the model pollutant, i.e., GMF before and after light irradiation, respectively. Fig. S8† depicts the percentage of mineralization at the different time gaps. It was found that the removal efficiency was around 70% at the end of 120 min and the remaining TOC may be attributed to the presence of ring-open intermediates and small molecular products, which were detected and confirmed from the LCMS study.
Hence, from the above-mentioned results, a favorable photodegradation mechanism of GMF over the best photocatalyst Cu0.75In0.25S QD was illustrated in Scheme 3. The CB and VB potentials of Cu0.75In0.25S were found to be −1.01 V and 1.22 V vs. NHE, respectively, from M–S and UV analysis. As light energy falls on the photocatalyst, electron–hole pairs are generated, and these photo-induced electrons get excited to the CB of the semiconductor; simultaneously, holes are formed at the valence band. Moreover, the photo-induced electrons at the CB of Cu0.75In0.25S are competent for forming ˙O2− radicals due to a stronger reduction potential than the O2/˙O2− potential (−0.33 V vs. NHE). Additionally, the VB of Cu0.75In0.25S is 1.22 V vs. NHE, which is not suitable for the H2O/˙OH generation (+1.99 V vs. NHE), yet the degradation rate decreases with IPA as a scavenger, which signifies the important role of hydroxyl radicals. Therefore, ˙OH radicals are produced indirectly from superoxide radicals and the detail ˙OH radical formation and degradation mechanism with superoxide and hydroxyl radicals are formulated below. Hence, the superoxide and hydroxyl formation ability of Cu0.75In0.25S was well confirmed through NBT, TA, and EPR analysis.43,44
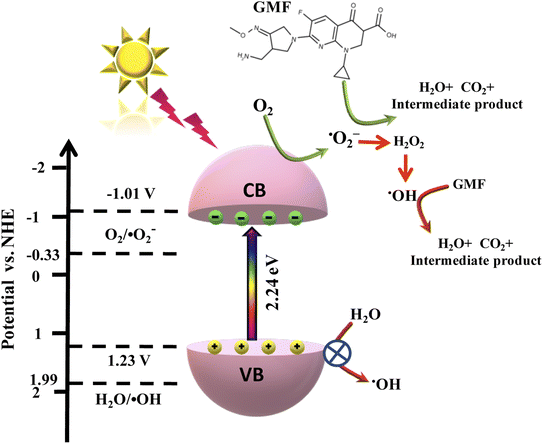 |
| | Scheme 3 Feasible mechanism for the degradation of GMF over Cu0.75In0.25S QDs via ˙O2− and ˙OH radical under 20 W visible-LED lamp. | |
The step-wise degradation mechanism is equated as below (eqn (7)–(14):
| | | Cu0.75In0.25S + hν → [eCB−]Cu0.75In0.25S + [hVB+]Cu0.75In0.25S | (7) |
| | | [eCB−]Cu0.75In0.25S + O2 → ˙O2− | (8) |
| | | ˙O2− + GMF → H2O + CO2 + intermediate product | (9) |
| | | ˙O2− + H+ + e− → HO2˙ | (10) |
| | | HO2˙ + HO2˙ → H2O2 + O2 | (11) |
| | | H2O2 + e− → ˙OH + OH− | (12) |
| | | ˙OH + GMF → H2O + CO2 + intermediate products | (14) |
Conclusion
In summary, a novel composition tunable CuxIn1−xS QD catalyst was designed by a reflux synthetic strategy, and its photocatalytic degradation activity was studied towards GMF under different experimental conditions. The photo-degradation activity of the Cu0.75In0.25S catalyst was remarkably enhanced and it was superior to that of Cu0.25In0.75S and Cu0.5In0.5S QDs because of the improved photon absorption-ability, better anti-recombination, and effective charge carrier diffusion from the bulk to the surface. Also, the catalytic activity under various pH values, scavengers, and the anionic environment was well studied. This study proposed the degradation of GMF in the superoxide generation pathway directly and hydroxyl radical pathway indirectly, which was confirmed by active species trapping experiment, NBT test, TA test, and ESR analysis. Our findings proved that composition tunable ternary CuxIn1−xS QD leads to a high rate of electron migration at the CB potential, offering a new platform for the photocatalytic degradation of quinoline-type antibiotic GMF in a greener and cleaner environment.
Conflicts of interest
The authors declare no competing financial interest.
Acknowledgements
The authors express their profound gratitude toward Siksha ‘O’ Anusandhan Deemed University for giving all necessary facilities and financial support to conduct this immense research work.
References
- Q. Du, P. Wu, Y. Sun, J. Zhang and H. He, Chem. Eng. J., 2020, 390, 124614 CrossRef CAS.
- A. Albini and S. Monti, Chem. Soc. Rev., 2003, 32(4), 238–250 RSC.
- A. Kumar, A. Kumar and V. Krishnan, ACS Catal., 2020, 10, 10253–10315 CrossRef CAS.
- M. Sharma, A. Kumar and V. Krishnan, Nanotechnology, 2022, 33, 275702 CrossRef.
- S. Kumar, A. Dhiman, P. Sudhagar and V. Krishnan, Appl. Surf. Sci., 2018, 447, 802–815 CrossRef CAS.
- S. Dhingra, M. Sharma, V. Krishnan and C. M. Nagaraja, J. Colloid Interface Sci., 2022, 608, 1040–1050 CrossRef CAS PubMed.
- G. Shankaraiah, P. Saritha, D. Bhagawan, V. Himabindu and S. Vidyavathi, S. Afr. J. Chem. Eng., 2017, 24, 8–16 Search PubMed.
- K. R. Davies, Y. Cherif, G. P. Pazhani, S. Anantharaj, H. Azzi, C. Terashima, A. Fujishima and S. Pitchaimuthu, J. Photochem. Photobiol., C, 2021, 48, 100437 CrossRef CAS.
- K. K. Das, S. Patnaik, S. Mansingh, A. Behera, A. Mohanty, C. Acharya and K. M. Parida, J. Colloid Interface Sci., 2020, 561, 551–567 CrossRef CAS.
- S. Mansingh, K. K. Das, A. Behera, S. Subudhi, S. Sultana and K. Parida, Nanoscale Adv., 2020, 2, 2004–2017 RSC.
- K. K. Das, D. P. Sahoo, S. Mansingh and K. Parida, ACS Omega, 2021, 6, 30401–30418 CrossRef.
- D. P. Sahoo, K. K. Das, S. Patnaik and K. Parida, Inorg. Chem. Front., 2020, 7, 3695–3717 RSC.
- S. Mansingh, R. Acharya, S. Martha and K. M. Parida, Phys. Chem. Chem. Phys., 2018, 20, 9872–9885 RSC.
- J. Kolny-Olesiak and H. Weller, ACS Appl. Mater. Interfaces, 2013, 5, 12221–12237 CrossRef CAS.
- Z. Mei, G. Wang, S. Yan and J. Wang, Acta Phys.-Chim. Sin., 2021, 37(6), 2009097 Search PubMed.
- J. Bai, W. Chen, L. Hao, R. Shen, P. Zhang, N. Li and X. Li, Chem. Eng. J., 2022, 447, 137488 CrossRef CAS.
- J. Bai, R. Shen, K. Zhou, Z. Jiang, P. Zhang and X. Li, Chin. J. Catal., 2022, 43(2), 359–369 CrossRef CAS.
- W. Xue, W. Chang, X. Hu, J. Fan and E. Liu, Chin. J. Catal., 2021, 42(1), 152–163 CrossRef CAS.
- Z. Xiong, Y. Hou, R. Yuan, Z. Ding, W. J. Ong and S. Wang, Acta Phys.-Chim. Sin., 2022, 38, 2111021 Search PubMed.
- F. Mei, Z. Li, K. Dai, J. Zhang and C. Liang, Chin. J. Catal., 2020, 41, 41–49 CrossRef CAS.
- D. Prusty, L. Paramanik and K. M. Parida, Energy Fuels, 2021, 35, 4670–4686 CrossRef CAS.
- Z. Long, W. Zhang, J. Tian, G. Chen, Y. Liu and R. Liu, Inorg. Chem. Front., 2021, 8, 880–897 RSC.
- W. Hu, S. Yang and J. Huang, J. Chem. Phys., 2019, 151, 214705 CrossRef PubMed.
- X. B. Fan, S. D. Yu, F. D. Zhang, L. P. Zhang, Y. Tao, C. H. Tung and L. Z. Wu, ChemSusChem, 2017, 10, 4833–4838 CrossRef CAS PubMed.
- C. Xia, J. D. Meeldijk, H. C. Gerritsen and C. M. Donega, Chem. Mater., 2017, 29, 4940–49512017 CrossRef CAS PubMed.
- D. Prusty, S. Mansingh, L. Acharya, L. Paramanik and K. M. Parida, RSC Adv., 2022, 12, 1265–1277 RSC.
- Z. Guan, J. Pan, Q. Li, G. Li and J. Yang, ACS Sustainable Chem. Eng., 2019, 7, 7736–7742 CrossRef CAS.
- Q. Wang, W. Wang, L. Zhong, S. Liu, X. Cao and F. Cui, Appl. Catal., B, 2018, 220, 290–302 CrossRef CAS.
- Y. Chen, S. Li, L. Huang and D. Pan, Inorg. Chem., 2013, 52, 7819–7821 CrossRef CAS.
- A. Ishikawa, T. Takata, J. N. Kondo, M. Hara, V. Kobayashi and K. Domen, J. Am. Chem. Soc., 2002, 124, 13547–13553 CrossRef CAS PubMed.
- Z. Wei, F. Liang, Y. Liu, W. Luo, J. Wanga, W. Yao and Y. Zhu, Appl. Catal., B, 2017, 201, 600–606 CrossRef CAS.
- A. S. Dezfuli, M. R. Ganjali, H. R. Naderi and P. Norouzi, RSC Adv., 2015, 5, 46050–46058 RSC.
- H. Huang, K. Xiao, Y. He, T. Zhang, F. Dong, X. Du and Y. Zhang, Appl. Catal., B, 2016, 199, 75–86 CrossRef CAS.
- L. Shen, W. Wu, R. Liang, R. Lin and L. Wu, Nanoscale, 2013, 5, 9374–9382 RSC.
- F. A. Ibrahim, M. A. Al-Ghobashy, A. El-Rahman, K. Mohamed and I. F. Abo-Elmagd, Environ. Sci. Pollut. Res., 2017, 24, 23880–23892 CrossRef CAS PubMed.
- A. Cai, J. Deng, M. Xu, T. Zhu, S. Zhou, J. Li, G. Wang and X. Li, J. Chem. Eng., 2020, 395, 125090 CrossRef CAS.
- W. K. Jo and S. Tonda, J. Hazard. Mater., 2019, 368, 778–787 CrossRef CAS.
- A. Khataee, P. Gholami, B. Kayan, D. Kalderis, L. Dinpazhoh and S. Akay, Ultrason. Sonochem., 2018, 48, 349–361 CrossRef CAS PubMed.
- Z. Chen, X. Li, Q. Xu, Z. Tao, F. Yao, X. Huang, Y. Wu, D. Wang, P. Jiang and Q. Yang, Chem. Eng. J., 2020, 390, 124454 CrossRef CAS.
- D. Prusty, S. Mansingh and K. M. Parida, Energy Adv., 2022, 1, 422–437 RSC.
- K. Saravanakumar, V. Maheskumar, Y. Yea, Y. Yoon, V. Muthuraj and C. M. Park, Composites, Part B, 2022, 234, 109726 CrossRef CAS.
- P. Gholami, A. Khataee, R. D. C. Soltani, L. Dinpazhoh and A. Bhatnagar, J. Hazard. Mater., 2020, 382, 121070 CrossRef CAS PubMed.
- H. Wang, X. Li, X. Zhao, C. Li, X. Song, P. Zhang and P. Huo, Chin. J. Catal., 2022, 43, 178–214 CrossRef CAS.
- P. G. Kougias and I. Angelidaki, Front. Environ. Sci. Eng., 2018, 12, 14 CrossRef.
Footnote |
| † Electronic supplementary information (ESI) available: Which unfolds chemical information, characterization techniques, the fabrication of working electrodes, CB and VB potentials, a comparison table, EDX patterns, color-mapping image, XPS survey spectra, the Bode phase, TR–PL plots, TR–PL fitting calculations, the reusability plots, XRD, the absorbance plots before and after use, PZC plost, NBT, TA plots, ESR plots and mineralization percentage plots. See https://doi.org/10.1039/d2va00143h |
|
| This journal is © The Royal Society of Chemistry 2022 |
Click here to see how this site uses Cookies. View our privacy policy here.  Open Access Article
 *
*
![[thin space (1/6-em)]](https://www.rsc.org/images/entities/char_2009.gif) :
:![[thin space (1/6-em)]](https://www.rsc.org/images/entities/char_2009.gif) 0.75, 0.5
0.75, 0.5![[thin space (1/6-em)]](https://www.rsc.org/images/entities/char_2009.gif) :
:![[thin space (1/6-em)]](https://www.rsc.org/images/entities/char_2009.gif) 0.5, and 0.75
0.5, and 0.75![[thin space (1/6-em)]](https://www.rsc.org/images/entities/char_2009.gif) :
:![[thin space (1/6-em)]](https://www.rsc.org/images/entities/char_2009.gif) 0.25, respectively. Here, TGA was used as a capping agent, which controlled the size of the particle and averted the formation of binary QDs. Also, tuning of the bandgap energy was observed, while varying the molar ratio of Cu
0.25, respectively. Here, TGA was used as a capping agent, which controlled the size of the particle and averted the formation of binary QDs. Also, tuning of the bandgap energy was observed, while varying the molar ratio of Cu![[thin space (1/6-em)]](https://www.rsc.org/images/entities/char_2009.gif) :
:![[thin space (1/6-em)]](https://www.rsc.org/images/entities/char_2009.gif) In, resulting in the variation of the optical properties. Further, the non-stoichiometric 0D QDs showed better charge-carrier separation as well as migration, as confirmed by PL, EIS, and Bode phase analysis, which eventually boosted the photocatalytic degradation efficiency of antibiotics via direct superoxide and an indirect hydroxyl radical pathway, as evidenced by the scavenger test, TA, NBT, and EPR analysis. Additionally, the effect of anions and pH variation were well studied. In addition, to the best of our knowledge, CuxIn1−xS QD photocatalysts have not been explored so far for the degradation of GMF, so this work will provide new scope for researchers working in this field.
In, resulting in the variation of the optical properties. Further, the non-stoichiometric 0D QDs showed better charge-carrier separation as well as migration, as confirmed by PL, EIS, and Bode phase analysis, which eventually boosted the photocatalytic degradation efficiency of antibiotics via direct superoxide and an indirect hydroxyl radical pathway, as evidenced by the scavenger test, TA, NBT, and EPR analysis. Additionally, the effect of anions and pH variation were well studied. In addition, to the best of our knowledge, CuxIn1−xS QD photocatalysts have not been explored so far for the degradation of GMF, so this work will provide new scope for researchers working in this field.![[thin space (1/6-em)]](https://www.rsc.org/images/entities/char_2009.gif) :
:![[thin space (1/6-em)]](https://www.rsc.org/images/entities/char_2009.gif) In i.e., 0.75
In i.e., 0.75![[thin space (1/6-em)]](https://www.rsc.org/images/entities/char_2009.gif) :
:![[thin space (1/6-em)]](https://www.rsc.org/images/entities/char_2009.gif) 0.25, 0.50
0.25, 0.50![[thin space (1/6-em)]](https://www.rsc.org/images/entities/char_2009.gif) :
:![[thin space (1/6-em)]](https://www.rsc.org/images/entities/char_2009.gif) 0.50, and 0.25
0.50, and 0.25![[thin space (1/6-em)]](https://www.rsc.org/images/entities/char_2009.gif) :
:![[thin space (1/6-em)]](https://www.rsc.org/images/entities/char_2009.gif) 0.75, respectively, as illustrated in Scheme 1. All the above-used chemicals were of analytical grade and high purity (Merck company), so used as such such without any further purification.
0.75, respectively, as illustrated in Scheme 1. All the above-used chemicals were of analytical grade and high purity (Merck company), so used as such such without any further purification.

![[thin space (1/6-em)]](https://www.rsc.org/images/entities/char_2009.gif) :
:![[thin space (1/6-em)]](https://www.rsc.org/images/entities/char_2009.gif) In molar ratios via the reflux strategy.
In molar ratios via the reflux strategy.![[thin space (1/6-em)]](https://www.rsc.org/images/entities/char_2009.gif) :
:![[thin space (1/6-em)]](https://www.rsc.org/images/entities/char_2009.gif) In in Cu0.75In0.25S QD was revealed by XPS analysis and was found to be 0.74
In in Cu0.75In0.25S QD was revealed by XPS analysis and was found to be 0.74![[thin space (1/6-em)]](https://www.rsc.org/images/entities/char_2009.gif) :
:![[thin space (1/6-em)]](https://www.rsc.org/images/entities/char_2009.gif) 0.26, which is quite reliable with the molar ratios of Cu and In precursors taken during synthesis. Therefore, it is noticeable from the above data that copper and indium are very well balanced during the fabrication time and non-stoichiometric Cu0.75In0.25S QD was formed as per the estimation. Similarly, the compositional ratios for other prepared catalysts are tabulated in Table S1.†
0.26, which is quite reliable with the molar ratios of Cu and In precursors taken during synthesis. Therefore, it is noticeable from the above data that copper and indium are very well balanced during the fabrication time and non-stoichiometric Cu0.75In0.25S QD was formed as per the estimation. Similarly, the compositional ratios for other prepared catalysts are tabulated in Table S1.†


