
 Open Access Article
 This Open Access Article is licensed under a
 Creative Commons Attribution 3.0 Unported Licence
Integrated chemical and biochemical technology to produce biogas with a reduced ammonia content from municipal biowaste. Validating lab-scale research in a real operational environment†
Enzo
Montoneri
 *a,
Michalis
Koutinas
b,
Elio
Padoan
c,
Viviana
Negro
d,
Carlo
Licignano
e,
Stefano
Leone
e,
Panagiota
Photiou
b,
Michalis
Kallis
b,
Ioannis
Vyrides
b,
Freddy
Liendo
e,
Michéle
Negre
c,
Simone
Solaro
e,
Massimiliano
Antonini
e,
Davide
Mainero
d,
Anestis
Vlysidis
f,
Viktoras
Konstantinidis
g,
Dimitrios
Ladakis
h,
Sofia
Maina
h and
Apostolis
Koutinas
h
*a,
Michalis
Koutinas
b,
Elio
Padoan
c,
Viviana
Negro
d,
Carlo
Licignano
e,
Stefano
Leone
e,
Panagiota
Photiou
b,
Michalis
Kallis
b,
Ioannis
Vyrides
b,
Freddy
Liendo
e,
Michéle
Negre
c,
Simone
Solaro
e,
Massimiliano
Antonini
e,
Davide
Mainero
d,
Anestis
Vlysidis
f,
Viktoras
Konstantinidis
g,
Dimitrios
Ladakis
h,
Sofia
Maina
h and
Apostolis
Koutinas
h
aUniversità di Catania, Dipartimento di Scienze delle Produzioni Agrarie e Alimentari, Catania 95123, Italy. E-mail: enzo.montoneri@gmail.com
bCyprus University of Technology, Department of Chemical Engineering, Limassol 3036, Cyprus
cUniversitàdegli studi di Torino, Dipartimento di Scienze Agrarie, Forestali e Alimentari, Grugliasco (TO) 10095, Italy
dAcea Pinerolese Industriale S.p.A., Pinerolo (TO) 10064, Italy
eHysytech S.r.l., Torino 10135, Italy
fOrganohumiki Thrakis, Alexandroupoli 68100, Greece
gSewerage Board of Limassol – Amathus, Limassol 3608, Cyprus
hAgricultural University of Athens, Athens 11855, Greece
First published on 6th September 2022
Abstract
The current paper reports the scientific, technical, environmental, economic and social impacts of two integrated chemical and biochemical processes that employed a novel virtuous biowaste cycle under real operational conditions of three industrial sites in Italy, Greece and Cyprus. The work was based on previous laboratory research pertinent to the valorisation of municipal biowastes (MBWs) as a feedstock to obtain value added soluble biobased (SBO) products. The research pointed out that the site-specific nature of MBW was the main criticality, which could potentially hinder the industrialisation of the MBW-SBO paradigm. The present work demonstrates the feasibility of a new scenario for a conventional waste treatment plan collecting and processing MBWs by anaerobic and aerobic fermentation. In essence, the virtuous biowaste cycle is realised by producing SBO from the plant MBW (process 1) and recirculating it to the MBW feed of the anaerobic fermentation reactor to reduce the ammonia content in the digestate (process 2). This mitigates the digestate's environmental impact. Life cycle sustainability assessment demonstrates that the use of SBO produced from local MBW allowed reducing the ammonia content of the digestate generated from the local anaerobic fermentation facilities in the three different countries by 21–68% as well its eutrophication potential. Process 2 allowed at least 86% OPEX cost saving compared to conventional digestate post-treatment technologies for ammonia abatement, while paying off the CAPEX cost in less than one year. Socio-economic analysis evaluated the impacts on workers and local community stakeholders, potentially stemming from the implementation of processes 1 and 2 at European level. The analysis of SBO composition and performances in each operational site investigated showed that improved performance of process 2 might be achieved by isolating the active principles in raw SBO prior to their use in process 2. Chemical and biochemical catalysis by SBO active principles in process 2 support the specific perspective.
Environmental significanceThe present paper reports the results of a LIFE programme funded project concerning two integrated chemical and biochemical processes realizing a novel virtuous biowaste cycle based on the valorisation of municipal biowaste as a feedstock for the production of value added soluble biobased (SBO) products to use in place of synthetic commercial chemicals. It addresses the environmental aspects of municipal biowaste facilities and the critical issues to face for the conversion of biowaste treatment facilities into biorefineries. The paper reports the scientific, technical, environmental, economic and social impacts of the above biowaste cycle confirmed under the real operational conditions of three industrial sites in Italy, Greece and Cyprus. It provides an example of the route to undertake for scaling green chemistry research to the industrial level. The authors are not aware of a similar comprehensive study addressing the environmental impacts of municipal biowastes and their mitigation. |
Introduction
Waste has attracted major concern for two main reasons: (i) the need for disposal and avoiding environmental pollution due to uncontrolled dispersion, fermentation or incineration; (ii) the high organic C and mineral element contents, which could be recovered and converted to valuable products aiming to diminish the depletion and environmental impact of fossil sources. The major shortcomings obstructing the recovery of valuable products from wastes comprise their entropy value and the development of sustainable processes. Municipal biowastes (MBWs) constitute the most exploitable type of waste.1 They are available in every urban settlement worldwide. In developed countries, MBW is available in confined spaces thanks to separate source collection practices. They are considered a negative cost feedstock,2 as collection costs are already paid off by citizens' taxes. In 2004–2016, the University of Torino (UNITO) focused R&D work on the valorisation of MBW as a feedstock for the production of value added products.3 Since then, over 100 papers were published reporting the development of processes of mixtures of different MBWs yielding a range of soluble bioorganic substances (SBO). The aforementioned products have been applied in the agriculture and chemical industry sectors (e.g. as soil fertilisers and plant growth biostimulants, high performance surfactants, and biopolymers for plastics manufacture). These papers pointed out high potential environmental and economic benefits from the market allocation of the SBO. Yet, in spite of these prospects, so far the above R&D results have not been scaled up to the industrial commercial scale.The major barriers for SBO industrialisation are: (i) the products are new without any existing commercial counterpart; (ii) the products were produced and tested at the laboratory/pilot small scale; (iii) the products' industrialisation requires the involvement of different stakeholders. A feasible business model to enable SBO industrialisation should certainly involve MBW collection/treatment companies. Currently, these companies process MBW by conventional fermentation producing biogas and compost. The SBO production from MBW or compost is a chemical process, with which MBW companies are not familiar. These companies could in principle integrate their biochemical processing facilities with the SBO chemical production facilities designed by chemical engineering companies. Even so, MBW companies suffer from a second drawback. They have no knowledge of the chemical market. Before undertaking the large scale production of SBO, MBW companies need to acquire the guarantee of the SBO amounts they can sell. This can only be provided by chemical companies that make up and market finished products in different agricultural and chemical sectors. To undertake the marketing commitment, chemical companies need to have the availability of large quantities of SBO, which were registered and authorized for commercialisation, in order to distribute to their customers' pool, get their feedback and assess the product marketability. The specific situation depicts a vicious circle. Under these circumstances, in spite of the attractive SBO prospects, UNITO reached the conclusion that all above investors were reluctant to undertake the entrepreneurial risk of process and product scale up as well as market allocation.
In 2014 UNITO R&D discovered a new SBO property.4 It was found that adding SBO to the MBW anaerobic fermentation slurry at 0.05–0.20% levels reduced the ammonia content in the final anaerobic digestate. The specific finding prospected new environmental and economic benefits by SBO. For the Italian ACEA Pinerolese plant,5 a typical factory collecting and treating MBW by controlled fermentation, the reduction of ammonia in the anaerobic digestate by adding SBO in the MBW slurry feed to the fermentation bioreactor implied significant cost reduction,4 as compared to the conventional secondary treatments of the digestate effluent in order to meet the environmental legislation requirements. The new finding constituted a strong argument supporting investment for the scale up of the SBO chemical production facility. It depicted a sustainable scenario, where the MBW treatment plant realized a virtuous biowaste cycle encompassing the production of SBO from the plant MBW compost and its recirculation to the MBW feed of the anaerobic fermentation reactor. In this scenario, the benefits derived from the reduced ammonia content in the plant's anaerobic digestate justified the investment required in the chemical facility producing SBO for the factory's own use, regardless of the SBO allocation in the external chemical market. Building on the results obtained at the lab scale,4 the work reported in the present paper was undertaken to realise in the real operational environment of the ACEA plant the virtuous MBW cycle and assess the replicability of the SBO's effects in three different countries.
The integrated chemical–biochemical process
Fig. 1 shows the process scheme, which has been studied in the present work. In the conventional Acea process (no SBO production), the collected food wastes are processed by anaerobic fermentation to produce biogas and digestate. The biogas is treated to separate methane from carbon dioxide. The purified methane is used to generate thermal and electrical energy. The recovered energy is used partly for the plant needs, and the rest is sold to the local community and business district. The digestate is treated in a belt filter press to separate the liquid from the solid humid fraction. The liquid digestate is recycled to the anaerobic digester. The solid digestate is mixed with the green wastes collected from the local municipality to make the CVD compost. | ||
| Fig. 1 Scheme of integrated chemical and biochemical processes. Legends: compost of food wastes' digestate and green waste mixture (CVD); soluble biobased product (SBO). | ||
Acea currently processes 60 kt per year of food wastes collected from the local municipality, which produce 6.7 Mm3 per year biogas and 6 kt per year digestate. The latter mixed with 7.2 kt per year green wastes yields 6 kt per year. CVD compost. The plant produces biogas also from the separate sewage sludge waste water treatment and landfill sections, which are visible in the plant aerial view of Fig. 2. Currently the plant is upgrading the biogas from food waste digestion and sewage sludge to biomethane and inlet into the grid. The site is independent from the electrical grid producing its need through CHP fed by biogas from landfill, and the total energy produced and consumed on site is about 12 MW h electric and 17 MW h thermal.
 | ||
| Fig. 2 Hydrolysis reactor (A) and aerial view of the ACEA plant (B). | ||
With specific reference to the scheme in Fig. 1, representing the ACEA conventional fermentation process integrated with chemical hydrolysis for the production of SBO, the calculated mass and energy input/output are reported in the E-LCA sub-section of the Results and discussion section below.
The assessment of the Fig. 1 scheme under the real operational conditions of ACEA was conceived as a major step carried out within the framework of a long term vision aiming to build a biorefinery fed with municipal biowaste (MBW).3 SBO plays a pivotal role in this vision.6 These are new soluble biopolymers, research products, not yet commercial, which are produced by low temperature hydrolysis of anaerobic digestate and composts of MBW. They are mixtures of molecules with molecular weights ranging from 5 to over 750 kDa, are constituted by aliphatic and aromatic carbon types substituted by acidic and basic functional groups that are in turn bonded to mineral elements of the 1st through the 4th group, and memories of the organo-mineral lignocellulosic structure present in the pristine MBW. As such, the SBO products hold a range of properties that make them multipurpose products for use in several sectors7 of agricultural and the chemical industry. The envisioned municipal biowaste biorefinery is expected to produce biofuel from the anaerobic fermentation of MBW,8 as well as biobased SBO, by chemical hydrolysis of the MBW anaerobic digestate and compost, as a replacement of the commercial products derived from fossil feedstock. This is the first time to the authors' knowledge that the specific biorefinery has been constructed worldwide constituting a brand new industrial manufacturing activity.
Scaling up to the industrial level the production of SBO from the MBW biological feedstock requires particular different effort compared to the production of synthetic chemicals from pristine materials with well-known defined composition. The MBW chemical composition is site-specific, depending on the local climate conditions and social consumption habits. This in turn may affect the chemical composition of SBO and its properties, while hampering the release of a product with guaranteed reproducible specifications and properties by industrial manufacturers. Thus, the present work focused on the validation in a real operational environment of the two novel processes for the production and use of SBO: (1) the hydrolysis of MBW compost to produce SBO; (2) the SBO assisted anaerobic fermentation of MBW to produce biogas and digestate with a reduced ammonia content. It also addressed the important issues for the industrialisation of the above processes, i.e. the replicability of the SBO chemical composition and performance as affected by the composition of MBW being site specific. The paper contains the on field experimental results collected in three different countries and the results of the E-LCA/LCC/S-LCA studies based on the experimental data. It discusses the prospects for the industrialisation and commercialisation of SBO stemming from the results of the present work.
Results and discussion
Hydrolysis of MBW (process 1)
Fig. 2A shows the reactor installed at the Italian ACEA plant (Fig. 2B), which represents the typical real and most feasible operational environment for scaling up and integrating the chemical hydrolysis SBO production process with the plant fermentation facilities and for the in house use of SBO.4 The factory provides services for the local population of 800![[thin space (1/6-em)]](https://www.rsc.org/images/entities/char_2009.gif) 000 inhabitants including separate source collection and treatment of solid biodegradable wastes and sewage waste water. It features four sections. The anaerobic fermentation section includes two bioreactors of 2560 m3 each, where the collected urban food wastes are processed to produce biogas and the anaerobic digestate. In the second section, the plant anaerobic digestate is mixed with private gardening residues and public park trimmings and allowed fermenting under aerobic conditions to yield compost. Biogas is produced also in the other two waste water treatments and MBW landfill sections. All plant biogas is collected and processed to separate methane from carbon dioxide. Bio-methane is further used to produce thermal and electric power, which is partially employed to cover the plant's energy needs, while the remaining quantity is sold to the nearby residential and industrial districts. By these features, the plant provides the MBW negative cost feedstock, the thermal/electric power, the recovered clean waste water and the land space needed for the production of SBO at the industrial commercial level. The ACEA factory is the typical example of a biowaste treatment plant that could be turned into a biorefinery producing biofuel and biobased value added products via the integration of conventional biochemical facilities with a chemical facility producing SBO.
000 inhabitants including separate source collection and treatment of solid biodegradable wastes and sewage waste water. It features four sections. The anaerobic fermentation section includes two bioreactors of 2560 m3 each, where the collected urban food wastes are processed to produce biogas and the anaerobic digestate. In the second section, the plant anaerobic digestate is mixed with private gardening residues and public park trimmings and allowed fermenting under aerobic conditions to yield compost. Biogas is produced also in the other two waste water treatments and MBW landfill sections. All plant biogas is collected and processed to separate methane from carbon dioxide. Bio-methane is further used to produce thermal and electric power, which is partially employed to cover the plant's energy needs, while the remaining quantity is sold to the nearby residential and industrial districts. By these features, the plant provides the MBW negative cost feedstock, the thermal/electric power, the recovered clean waste water and the land space needed for the production of SBO at the industrial commercial level. The ACEA factory is the typical example of a biowaste treatment plant that could be turned into a biorefinery producing biofuel and biobased value added products via the integration of conventional biochemical facilities with a chemical facility producing SBO.
The reactor in Fig. 2A is the key element for the production of SBO. It comprises (i) a reaction vessel on the right and (ii) a tangential separator on the left of the picture. Water, compost and alkali are fed into the reaction vessel. At the end of the reaction, the reaction mixture is sent to the tangential separator. At the specific unit the mixture proceeds via a narrow tortuous path prior to entry into the expansion chamber where, due to the difference in densities, the suspended unreacted solid compost is separated into the solid phase. The latter is collected in a vessel under the conical separator and the liquid phase is split in two flows. One stream is recirculated to the reaction vessel and the other is collected in an outside vessel. This feature allows reducing the number of equipment components. It performs simultaneously the reaction and the products' separation with one equipment, without the need for a separate conventional commercial solid separation system. The reactor, installed and operated in the ACEA plant at pH 13, 90 °C and 20 minutes' residence time, has been proven to yield 90% SBO yield. The capacity of the reaction vessel is 700 L. The relatively small reactor size enables 5 kt per year SBO production capacity if operated in continuous mode all year around. As shown here after, the compact size, configuration, experimental operational conditions and performance of the reactor in Fig. 2A allowed reliable validation of the hydrolysis as well as producing sufficient quantities of SBO to prove the SBO assisted anaerobic fermentation under real operational conditions.
The composts were obtained in each country from the biowastes collected in each season of the year comprising the 12 weeks' fermentation period, aiming to account for the effects of the site specific nature of the collected biowaste on the composition and performance of the SBO obtained. Based on previous work,6 assessing the chemical nature of composts and SBO is rather difficult due to their complex heterogeneous composition. These materials contain organic matter bonded to mineral elements. The organic matter is a mixture of molecules that differ in molecular weight and carbon moieties comprising aliphatic and aromatic C substituted by different acidic and basic functional groups. An analytical protocol was developed to deal with the complex composition of MBW in previous lab-research work.3,6 The protocol included the determination of volatile substances, elemental C and N, C types and functional groups by solid state 13C NMR spectroscopy and potentiometric titration, as well as the assessment of the molecular weight distribution by SEC-MALS. The protocol allowed getting more insight into the chemical nature of SBO, by identifying and measuring the content of aliphatic and aromatic C and of several functional groups containing methoxy (OMe), carboxylic acid (COOH), amide (CON), ammine (NR), alkoxy (RO), phenol (PhOH), phenoxy (PhOY, Y = R, Ph) and anomeric (OCO) C atoms. Detailed data obtained by the above mentioned analytical protocol for several MBW fermentation products and the resulting SBO, including the compost and SBO types prepared and used in the present work, are reported by Rosso et al.6 The work also showed that for screening purposes in the case of a large number of samples, the C/N ratio is a simple useful index, which correlates with the C types and functional groups of the organic matter and so reflects the chemical nature of both compost and SBO. Regarding the composts and SBO obtained in the present work, the C/N ratio of the SBO and pristine composts was determined and used to assess the relationship between compost and SBO variability. The specific relationship was deemed satisfactory, constituting simple C and N microanalysis as a cheaper less time consuming tool to control the pristine compost and the SBO product of the hydrolysis process to use for predicting the performance of the SBO assisted anaerobic fermentation process during real industrial operation.
ESI Table S1† reports the origin and season of the produced compost and the C/N ratio for both the compost and the derived SBO. The experimental data confirm that the compost C/N ratio varies depending on the composition of the starting biowaste and of the compost type, and on their production country and season. Table 1 reports the average C/N values calculated over the different production seasons, for each compost type (CV and CVD) and producer (OT, SBLA and ACEA).
| Producer and compost typea | C/N w/w ratiosb | Standard deviation |
|---|---|---|
| a OT, SBLA, and ACEA are the firms producing the composts at the industrial sites located in Greece, Cyprus and Italy, respectively. CV and CVD are the composts obtained from green residues only and from mixtures of green resides and anaerobic digestate, respectively. b Values followed by different letters are significantly different at the p < 0.01 level. | ||
| OT CV | 20.1a | 1.4 |
| OT CVD | 13.1b | 1.2 |
| SBLA CV | 18.9ab | 7.6 |
| SBLA CVD | 11.8b | 2.2 |
| ACEA CV | 15.7ab | 1.8 |
| ACEA CVD | 10.9b | 1.0 |
ESI Table S1† shows that the OT CV and CVD composts were not significantly affected by the season. Table 1 shows that the OT CV compost is significantly different from the OT CVD compost, given that the average C/N value for CV is 20.1 ± 1.4 as opposed to 13.1 ± 1.2 for CVD. The difference is clearly related to the higher N content of the CVD due to the higher protein content contributed by the pristine food waste feedstock applied for the CVD compost production. ESI Table S1† shows that the CV and CVD composts manufactured in SBLA are more affected by the production season. This effect may be due to the fact that the pristine biowastes collected in the different seasons by SBLA for CV and CVD production were not as homogeneous as the feedstocks applied by OT, which were provided by the municipalities of Alexandropoulis and Athens. The high standard deviation of the average C/N values in Table 1 reflects the heterogeneity of the biowastes collected by SBLA. This fact does not allow assessing a significant difference between the SBLA CV and CVD composts, although the 18.9 average C/N value for CV is 60% higher than the 11.8 C/N value calculated for CVD. ESI Table S1† data of the ACEA composts show the seasonal effect on both CV and CVD composts, which was higher regarding the former compost. The standard deviation of the average C/N values in Table 1 is much lower as compared to those of SBLA composts. Similarly, although in the case of ACEA the C/N ratio of CV is 15.7, which appears to be 44% higher as compared to the corresponding value of CV (10.9), and the statistical analysis did not confirm the significant differences between the two CV and CVD composts because of the relatively high standard deviations.
For the scope of the present work, it was necessary to establish how the site-season specific biowaste variability affected the nature of the SBO obtained by the hydrolysis process 1 and how the variability of SBO affected the SBO assisted fermentation process 2. Fig. 3 shows the plot of ESI Table S1†C/N values for pristine compost and the derived SBO. In the plot the CV/OT and CVD/SBLA listed in rows 2, 3 and 16 of ESI Table S1† are omitted, since they show large deviations from the trend represented. The 20 experimental points in the plot fit a linear relationship according to the equation
| Y = a + b·X | (1) |
 | ||
| Fig. 3 Plot of SBO C/N vs. SBO Compost data in ESI Table S1.† | ||
Deeper understanding of the parameters to measure and use for assessing the variability of biowaste feedstock for the production of value added products is certainly matter of further dedicated scientific work. For the scope of the present work, the next step was to assess how the SBO variability affected the replicability of the SBO assisted fermentation process 2 in the three industrial sites in Italy, Greece and Cyprus.
SBO assisted anaerobic fermentation of MBW (process 2) at each industrial site
SBO assisted fermentation trials were carried out in the industrial sites of ACEA, SBLA and OT, aiming to validate and replicate process 2 in a real operational environment where the composts were produced from local biowastes. The SBO used in these trials had C/N values ranging from 8.9 to 19, comprising the highest values for the SBO obtained from CV compost and lower values for the SBO obtained from CVD compost. These allowed accounting for most of the range of the values in Fig. 3 and therefore assessing the effect of the SBO variability on the performance of process 2.The anaerobic fermentation trials were carried out using two reactors running in parallel, control A and test B reactors containing the same slurry feed without and with added SBO, respectively. ACEA is a long-term consolidated industrial biogas production plant, equipped with two bioreactors of 2560 m3 volume each, well visible in green in the anaerobic digestion zone in Fig. 2B. The company processes the biodegradable MBW constituted by food waste recovered from town bins. The material is mechanically treated to separate bones, stones, heavy objects and residual plastic materials from the bioorganic fraction. The latter is taken up with a hot process to yield a solid suspension heated to 65 °C, which constitutes the slurry feed of the bioreactors. The fermentation process is run in continuous mode at 55 °C, pH 8–9, total solids and volatile solids (VS) in feed slurry of approximately 10% and 9%, respectively, and 15 days' hydraulic retention time. The biogas product is conveyed to a storage tank. The digestate is dewatered with a belt filter press to separate the liquid digestate and the humid solid digestate.
The validation of the SBO assisted fermentation (process 2) in ACEA was performed feeding bioreactor A with the control slurry feed (no added SBO) and reactor B with the same control slurry feed supplemented with SBO. OT and SBLA conducted biogas production from MBW just to assess the replicability of process 2. OT and SBLA anaerobic fermentation facilities constituted prototypes, which were constructed aimed at mimicking the ACEA fermentation facility on a smaller scale. Control (A) and test (B) reactors had 400 and 480 L slurry volume capacity in the SBLA and OT cases, respectively, and were operated under the same experimental conditions as the ACEA bioreactors.
The reactors were operated using the inoculum available at each site. The ACEA's inoculum was the liquid fraction of the anaerobic digestate, which was continuously recirculated to be mixed with the biowaste inlet feed supplied to the bioreactors. The inoculum of OT was the sludge sampled from a nearby anaerobic digestion plant. The SBLA′ inoculum was the primary sludge produced from the wastewater treatment plant of the company. This was collected from the bottom of the primary sedimentation basin, following the screening and the gritting chamber, and consisted of high levels of total suspended solids and organics. Once inoculated, the prototype bioreactors of SBLA and OT were operated continuously for a long period using the collected local food biowaste aiming to adapt the microorganisms to the new environment. The systems ran for several weeks to allow the establishment of steady state operation prior to conducting the SBO assisted fermentation trials.
The feeding mode of SBO in reactor B of ACEA was different from that used in OT and SBLA, due to technical constraints arising from the different sizes of the reactors. SBO was spiked in B reactors of OT and SBLA to establish a content of 0.05–0.2% SBO at the start of the experiment. The concentration of SBO was maintained for the entire duration of the trial via continuous feeding of the biowaste slurry containing the required SBO concentration. Thus, the same amount of SBO exiting the reactor was introduced as fresh material in the system via the feed. In the case of ACEA, the slurry flow through each A and B reactor was 1.83 m3 per day. The inlet of reactor B included preparation of 10% SBO solution in water, which was added to the reactor B slurry feed at a rate of 1 m3 per day for the first 28 days and of 2 m3 per day for the subsequent 58 days. The specific operational mode allowed synchronising the operations of the reactor producing SBO with the anaerobic fermentation reactors, while gradually increasing every day the concentration of SBO in reactor B and measuring the SBO effect as a function of its concentration in the fermentation slurry during the entire trial duration. ESI Fig. S1† shows an example of the calculated profile of SBO concentration increase in reactor B via feeding 0.1 ton per day SBO dry matter up to day 28, and then 0.2 ton per day from day 29 to day 86.
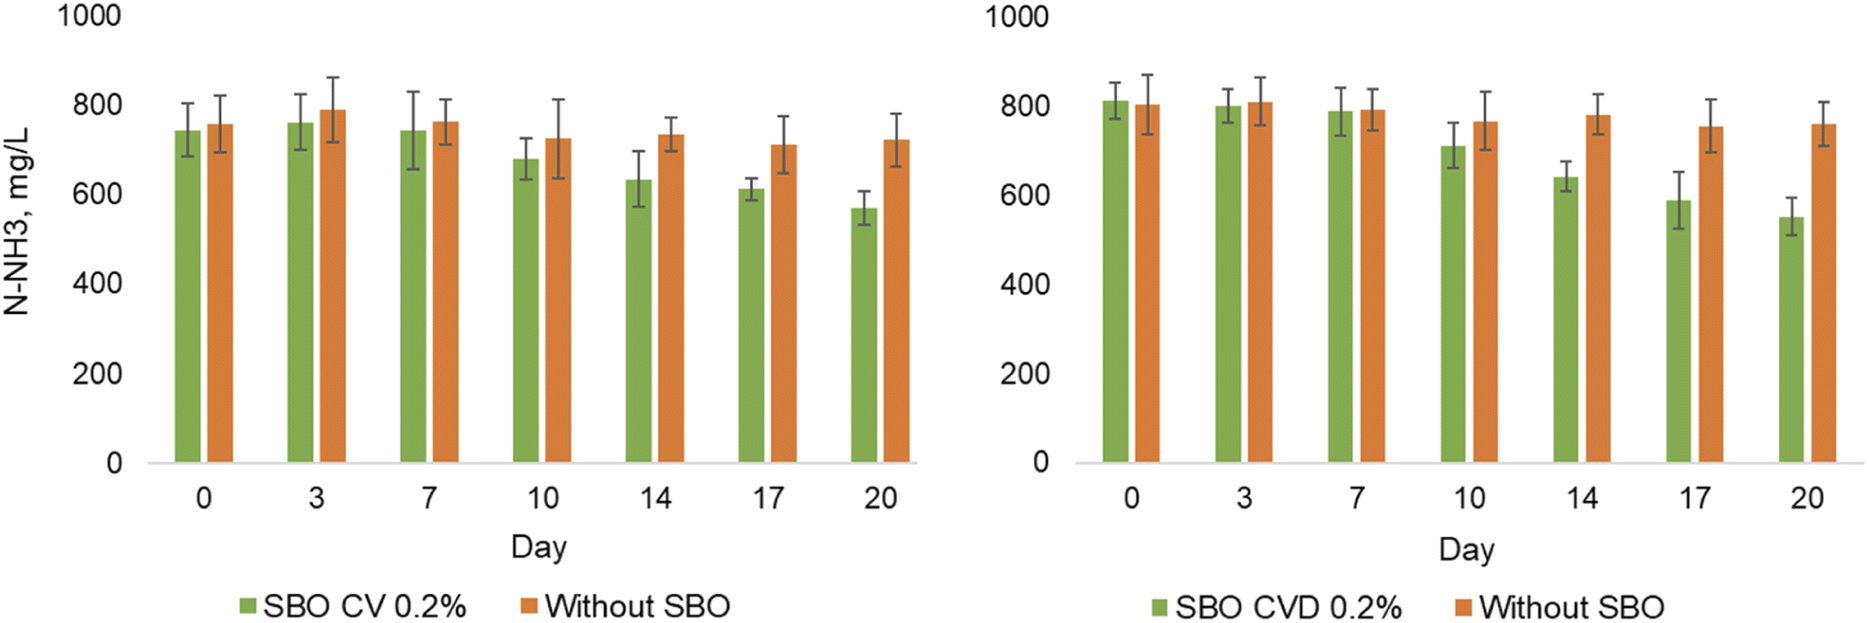
Fig. 4 reports the ammonia content of the daily slurry feed to both A and B reactors, as well as the ammonia content of the liquid and solid digestate phases separated by the filter press, which were obtained, respectively, from the A and B reactors. Analyses were performed in triplicate. The ammonia values on days 1–22 are average values calculated from the analytical results of 6 samples taken over the first 22 days of the fermentation trial. The other values are the experimental values obtained from each sample taken from day 24 through day 73. The results show that, compared to the slurry feed, all outlet streams have a significant higher ammonia content. The average ammonia content calculated over the 15 slurry feed samples is 345 ± 70 mg L−1. The average ammonia contents in the outlet streams are higher than in the feed slurry, respectively, by 763 ± 221 mg L−1 for the liquid stream of the A reactor, by 442 ± 128 mg L−1 for the liquid stream of the B reactor, by 918 ± 266 mg L−1 for the solid stream of the A reactor and by 862 ± 250 mg L−1 for the solid stream of the B reactor. The higher average ammonia content in the outlet streams, compared to the feed slurry, confirms the expected production of ammonia due to the proteolysis of the feed proteins.4,12 The expected SBO effect to reduce the digestate ammonia content is evident upon comparing the data for the B and A reactor liquid streams. The relatively high standard deviation values of the average values arise from the variability inherent to the investigated materials involved in the fermentation process, the filter press efficiency of separating liquid–solid mixtures, and the sampling difficulties inherent to the physical heterogeneity of the fermentation slurries. In the present case, the high standard deviation values make rather difficult to evidence statistically significant differences by comparing A and B average values. Analysing the values obtained in each sample yields more useful reliable information in relation to the appearance of the SBO effects as a function of its concentration in the feed slurry. Fig. 4 reports the results of days 1–22 as averages of the 6 samples taken during this period, since the single values for each sample did not prove any definite significant difference between A and B reactors. In contrast, the results obtained from the single samples taken from day 24 through day 73 exhibited statistically significant differences at the p < 0.01 level.
 | ||
| Fig. 4 Ammonia content in the liquid and solid digestates of ACEA reactors A and B in the absence and presence of CVD SBO. Slurry feed: solid suspension containing the MBW organic fraction fed to the bioreactors. Liquid and solid digestates: products obtained by the belt filter press of raw digestate obtained from the A control reactor (no added SBO) and from the B test reactor (added SBO). | ||
The data in Fig. 4 show that the SBO effect of reducing the ammonia content in the liquid phase of reactor B, as compared to that in the liquid phase of reactor A, started to appear statistically significant on day 24, when the SBO concentration reached 0.04% (ESI Fig. S1).† The same occurs for the solid phases starting from day 29, when the SBO concentration reached 0.052%. Since then, the SBO effect was maintained until the end of the fermentation trial. It reached its maximum level on Day 57, when the calculated SBO concentration in the B reactor was 0.1%. At this time, it may be calculated from the data in Fig. 4 that, compared to the A reactor, the ammonia content is 46 and 23% lower in the liquid and solid phases of reactor B, respectively. On day 57, the SBO daily addition was stopped. Both the A and B reactors continued to be fed with the plant fresh slurry without the addition of SBO in the B reactor. In this fashion, the SBO concentration in the B reactor was washed out gradually every day. During this phase, A and B reactors were sampled on days 70 and 73. The SBO concentration in the B reactor on these dates was calculated to be about 0.032 and 0.025%, respectively. The ammonia content in the B reactor liquid phase was 32.5% significantly less than that in the A reactor, whereas no difference of the ammonia content was proven for the ammonia content in the solid phases of the A and B reactors. The reported data definitely assess that the SBO effect occurs for the soluble ammonia in the fermentation slurry at SBO concentration between 0.025 and 0.10%. The same effect occurs for the insoluble ammonia/ammonium contained in the solid digestate phase, but at a lower level and in a narrower SBO concentration range.
Similar results were obtained with SBO obtained from the CV compost. The C/N ratio of the SBO was 12.7 ± 2.3, which was in agreement with the experimental data for the pristine CV compost (ESI Table S1† and Table 1) and eqn (1). The SBO containing solution was added to reactor B at a rate of 2 m3 per day since the beginning of the trial. The ammonia content in reactor B was lower than that in reactor A, upon establishment of 0.04% SBO concentration in B. On day 33 the SBO concentration in B reached 0.17% and the ammonia content in B, relative to that in A, was 28% and 11% lower in the liquid and solid digestate phases, respectively. The SBO addition was then stopped. Both reactor A and B continued to be fed with the control slurry, in order to wash out the SBO from B. After 23 days from the start of the SBO washing out stage, the ammonia content in B liquid and solid phases was still 9% less than that in A.
Significant differences were not observed relevant to biogas production and composition between reactors A and B in all trials conducted. Both CVD- and CV-derived SBO reduced the ammonia content in the digestate of ACEA, where the former was more effective. The specific effect could be related to the higher content of organic nitrogen in CVD, presumably being in the form of proteinaceous matter inherited from the pristine food biowaste. Total N, ammonia N and nitrate N analyses performed on the samples of the fermentation trials showed that in the A reactor 60–70% of the total N was in the form of ammonia N, 0.02–0.15% in the form of nitrate N, and 40–30% in the form of organic N. Upon reduction of the ammonia content due to the SBO addition, the organic N % increased. Table 2 shows typical examples of the liquid digestate in reactor B on days 81 and 86 containing nearly 0.1% CVD -derived SBO, which exhibited the highest ammonia reduction. The decrease of ammonia corresponded to the increase of organic N. As a countercheck, Table 2 reports also the results of the total volatile solid content as a measurement of the total organic matter, which confirm the increase of organic N aligned with the increase of total organic matter. These facts induce us to believe that the SBO inhibits the biochemical proteolysis reaction leading to ammonia formation from protein matter contained in the fermentation biowaste feed.
| Day/reactorb | NH3–N | NO3–N | Total N | Organic-N | VS |
|---|---|---|---|---|---|
| a Ammonia (NH3), nitrate (NO3), total and organic N, and volatile solid (VS) concentration. b Day from fermentation start (see Fig. 4), A and B control and test reactors without and with added SBO, respectively. | |||||
| 81/A | 988 | 0.4 | 1600 | 612 | 3700 |
| 81/B | 622 | 1.7 | 1400 | 778 | 6700 |
| 86/A | 1103 | 2.3 | 1500 | 397 | 5600 |
| 86/B | 499 | 1.1 | 1100 | 601 | 7800 |
The results obtained under the real operational conditions of the 2560 m3 continuous bioreactors of ACEA in 2021 are in line with those obtained in the preliminary laboratory work carried out with 6.5 L batch reactors in 2014 using SBO obtained from CVD4 and CV6 composts produced in 2010. Since then, further laboratory work12 has been carried out to understand the mode of action of SBO in the MBW anaerobic fermentation. It was evidenced that the ammonia reduction in the anaerobic digestate is due to the concurrence of biochemical and chemical reactions catalysed by SBO. The higher SBO effect observed in the liquid digestate phase, as compared to the solid digestate, may be connected to the SBO faster kinetics of the SBO homogeneous chemical catalysis in the liquid phase, compared to the heterogeneous catalysis in the solid phase. Still, the assessment of the mechanism of the SBO assisted process 2 remains a matter of further research. For all practical purposes, the fermentation trials carried out in the ACEA plant real operational environment and conditions add relevant useful information. They confirm that SBO obtained from different composts manufactured over the past 10 years maintains the property of reducing the ammonia content in the MBW anaerobic digestate.
| Trial no. | Nt (B) | N–NH3 (B) | Nt (A) | N–NH3 (A) | ||
|---|---|---|---|---|---|---|
| a Values followed by different letters are significantly different at the p < 0.05–0.01 level, as a result of the statistical comparisons of Nt (B) with Nt (A), and NH3 (B) with NH3 (A). b Feed for B and A in each trial is the same. c For each trial Δ(B–A) indicates the difference between the value in the feed and the average value in the fermentation calculated over the trial duration. | ||||||
| 1 | Feed B | 1376 ± 216 | 365 ± 53 | Feed A | 1376 ± 216 | 365 ± 53 |
| CVD SBO 0.05 B | 1445 ± 47 | 616 ± 24 | CVD SBO 0.05 A | 1489 ± 74 | 625 ± 17 | |
| Δ(B–A)c | 69.4 | 251 | 113 | 260 | ||
| 2 | Feed B | 1304 ± 156 | 205 ± 37 | Feed A | 1304 ± 156 | 205 ± 37 |
| CV SBO 0.05 B | 1178 ± 178 | 495 ± 78 | CV SBO 0.05 B | 1212 ± 116 | 504 ± 70 | |
| Δ (B–A)c | −126 | 290 | −91.9 | 299 | ||
| 3 | Feed B | 1511 ± 183 | 382 ± 48 | Feed A | 1511 ± 183 | 382 ± 48 |
| CV SBO 0.2 B | 1569 ± 118 | 679 ± 75a | CV SBO 0.2 B | 1612 ± 61 | 743 ± 28b | |
| Δ(B–A)c | 57.9 | 297 | 101 | 361 | ||
| 4 | Feed B | 1489 ± 257 | 403 ± 74 | Feed A | 1489 ± 257 | 403 ± 74 |
| CVD SBO 0.2 B | 1682 ± 122 | 700 ± 107a | CVD SBO 0.2 B | 1763 ± 45 | 782 ± 22b | |
| Δ(B–A)c | 193 | 297 | 274 | 379 | ||
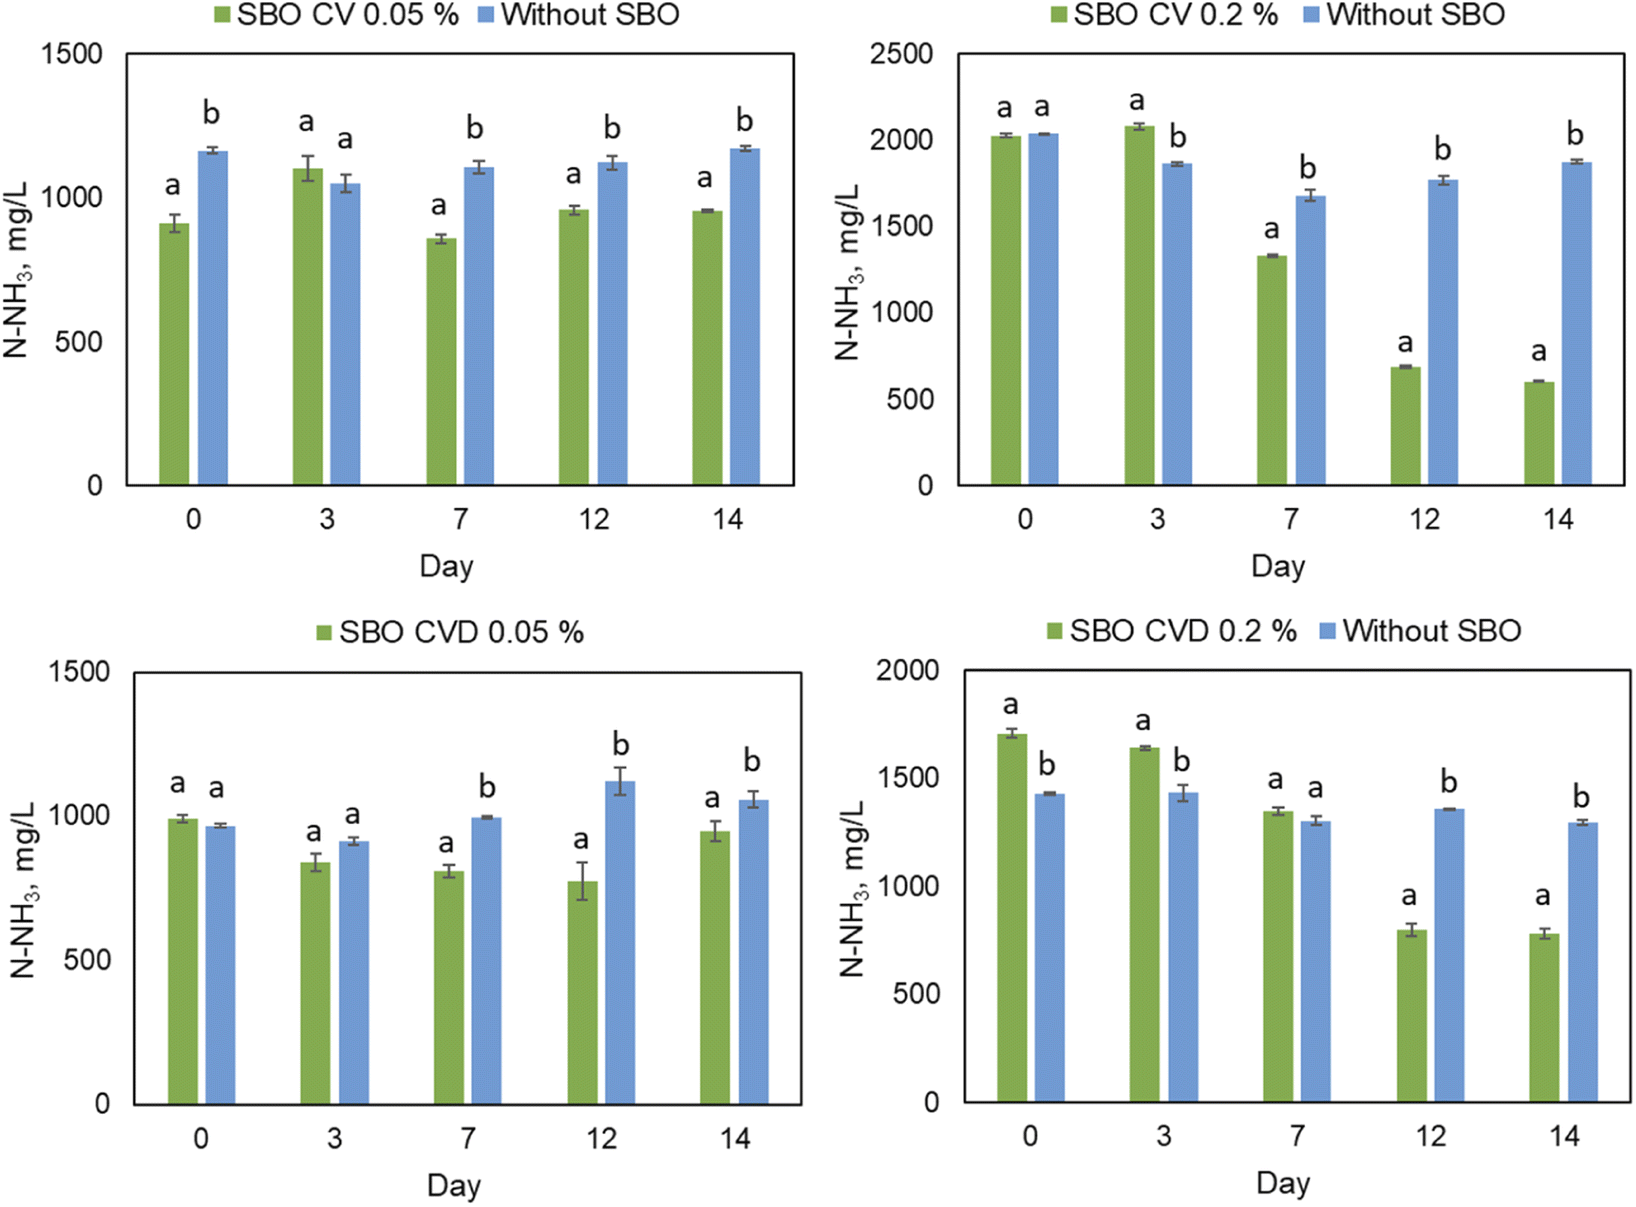
Fig. 5 shows the measured ammonia content (mg L−1) in the daily samples taken from the A and B fermentation slurries in the presence and absence of 0.2% CV or CVD SBO during the trials. Nt values (Table 3) in reactors A and B do not show significant differences, as compared to each other as well as against the content of the feed. In contrast, N–NH3 values do show significant differences. The average N–NH3 content in the slurry feed, calculated from the values measured for the 4 slurry feed samples in trials 1 through 4 (Table 3), is 339 ± 90 mg L−1. In each of the 4 trials the average N–NH3 value in reactors A and B is significantly higher than that in the slurry feed. This is consistent with the production of ammonia during anaerobic fermentation, The Δ(B–A) values in Table 3 show that reactors B and A produced 251–379 mg L−1 ammonia in excess of the amount present in the starting slurry feed. The ammonia mean content, calculated for each fermentation slurry over the trial duration, is 679 ± 75 and 743 ± 28 in the presence and absence of 0.2% CV SBO, respectively, and 700 ± 107 and 782 ± 22 in the presence and absence of 0.2% CVD SBO, respectively. The ammonia average values in the presence of 0.2% SBO (reactor B), as compared to the values in the absence of SBO (reactor A), are lower at p < 0.05 and/or p < 0.01 significance levels. The average ammonia reductions in reactor B are 8.7 and 10.5% in the presence of CV and CVD SBO as opposed to reactor A, respectively. The high significance of the effect of SBO is better appreciated from the data of Fig. 5. Both in the presence of 0.2% CV and CVD SBO, the ammonia reduction in reactor B, as compared to reactor A, appears statistically significant on day 14 and reaches on day 20 the maximum levels of 21 and 27% in the presence of CV and CVD SBO, respectively. According to previous laboratory work,12 the SBO may interact with the microflora present in the fermentation slurry and induce changes in the population of active microorganisms. The delay of 14 days for the effect of SBO to become statistically significant (Fig. 5) is likely due to the period required for the acclimation of the selected bacterial population in reactor B.
 | ||
| Fig. 5 Ammonia concentration in the presence and absence of 0.2% CV or CVD SBO during the trials of OT. | ||
The Nt and N–NH3 values in the slurries of the OT fermentation trials are consistent with those reported above for the ACEA trials. However, the OT fermentation trials evidenced SBO effects also in the gas phase of the fermentation trials. Fig. 6 reports the production rate measured for biogas produced in reactors A and B during the fermentation trials of OT. Fig. 7 reports the average values of the biogas production rate and composition over the whole duration of the experiment. The results show that the average biogas production rates in the fermentation in the presence of CV and CVD SBO (reactor B) are, respectively, 19% and 8% higher relative to the rates in the control fermentation (reactor A). The compositions of the biogas produced in reactor B, as compared to reactor A, are not significantly different, with one exception. The average N2 content in the biogas produced in the fermentation in the presence of CV and CVD SBO (reactor B), respectively, appears 46% and 31% significantly higher, as compared to the N2 content in the biogas produced in the control fermentation in the absence of CV and CVD SBO (reactor A). The higher biogas production rate coupled to the lower ammonia content in the fermentation in the presence of CV and CVD SBO is consistent with the known negative effect of ammonia inhibiting biogas production.13–15 The higher N2 in the produced biogas coupled to the lower ammonia content in the fermentation slurry containing CV and CVD SBO is in line with the results of previous laboratory work12 proving that SBO catalyses the chemical oxidation of ammonia in the fermentation slurry to N2.
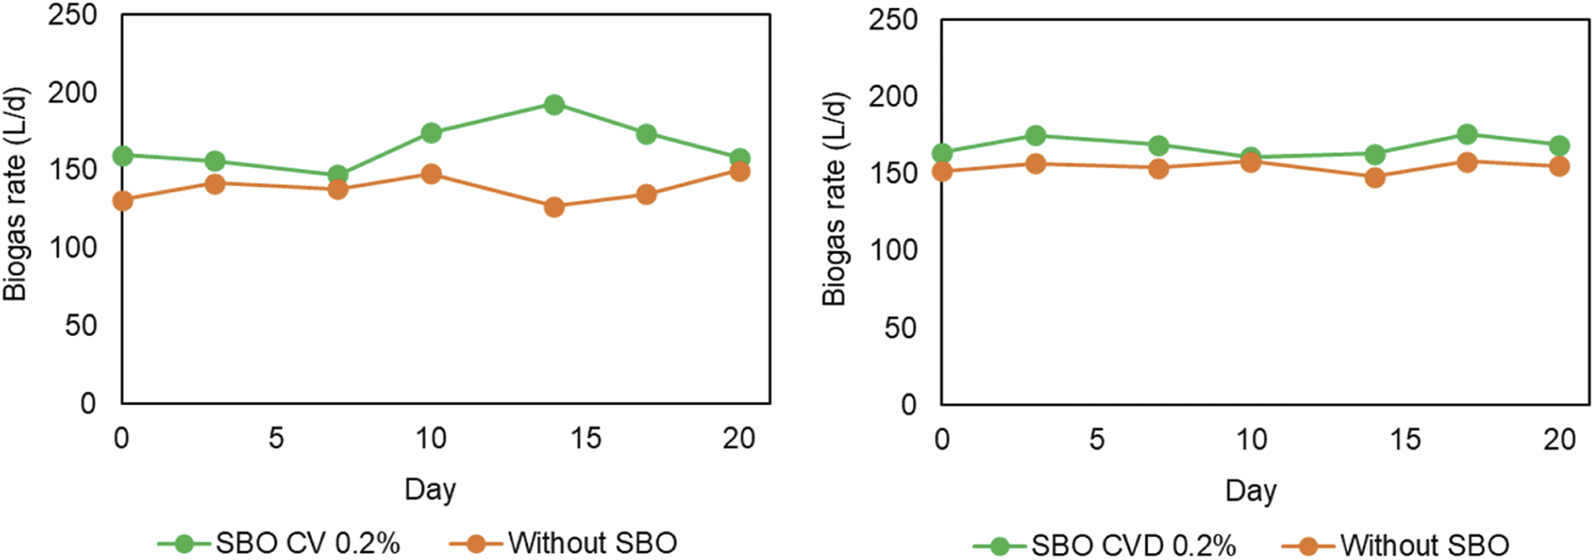 | ||
| Fig. 6 Biogas production rate over time in reactors A and B of OT in the presence and absence of CV SBO and CVD SBO, respectively. | ||
 | ||
| Fig. 7 Calculated average production rate and composition of biogas over the whole duration of trials conducted in OT. | ||
The Nt averages (mg L−1) in the A and B reactors of SBLA did not show significant differences. They were 1823 ± 662 for reactor A and 1844 ± 602 for reactor B. The N–NH3 averages showed significant differences. The average N–NH3 content in the slurry feed, calculated from the values measured for the 4 slurry feed samples, was 728 ± 243 mg L−1. Reactors B and A produced 259–523 mg L−1 and 418–778 mg L−1, respectively, in excess of the amount present in the starting slurry feed. By comparison, the ammonia production in the ACEA fermentation trials was 97–573 mg L−1 and in the OT trials 251–379 mg L−1 in excess of the amount present in the starting slurry feed. Fig. 8 reports the measured ammonia content in the B and A reactors of SBLA over the duration of the fermentation trials carried out in the presence of CV and CVD SBO at 0.05 and 0.2% concentrations. The data show that in all trials the SBO effect of lowering the ammonia content appears statistically significant starting from day 7. The magnitude of the effect appears to depend on the type and concentration of the SBO. The ammonia % reductions in reactor B, as compared to reactor A, over the time frame from day 7 to 14 are 15–22% and 21–68% in the presence of 0.05% and 0.2% CV SBO, respectively, and 10–31% and 40–41% in the presence of 0.05% and 0.2% CVD SBO, respectively. The higher SBO concentration seems to yield a larger effect. As in the trend observed for the OT trials (Fig. 5), the delay of 7 days for the SBO effect to become statistically significant in SBLA (Fig. 8) further supports the establishment and acclimation of the selected bacterial population in the B reactor.
 | ||
| Fig. 8 Ammonia content over time in reactors B and A of SBLA in the presence and absence of CV SBO and of CVD SBO, respectively. | ||
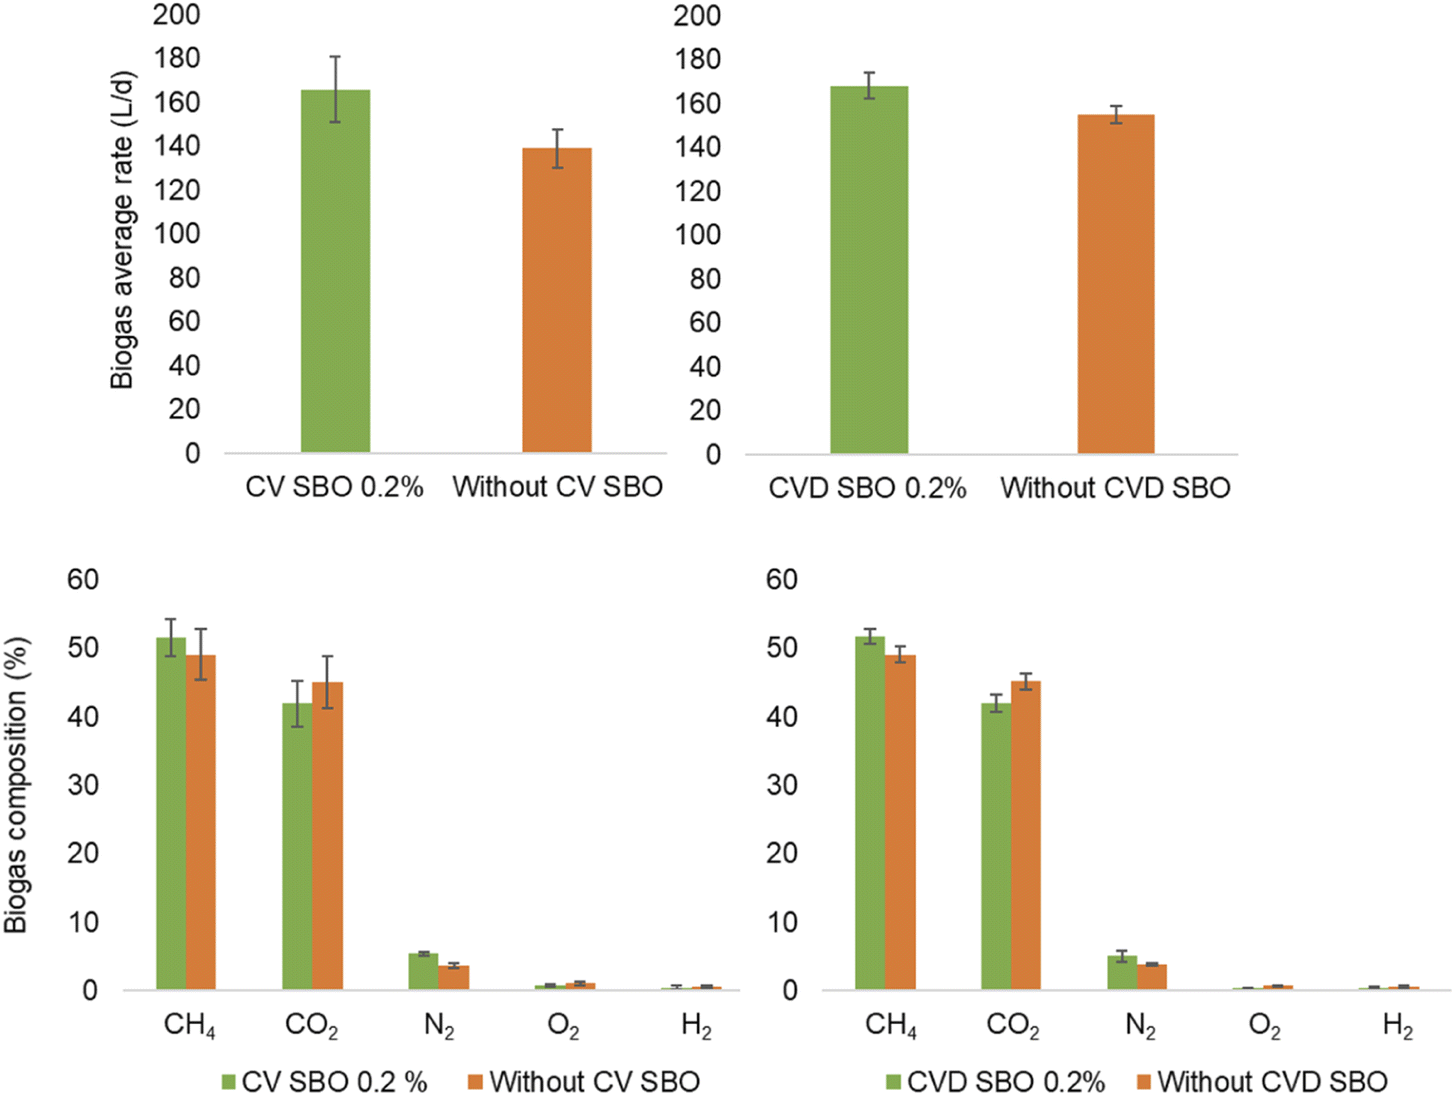
Consistent with the results reported in Fig. 6 and 7 for OT, the SBO affected also the biogas production rate and composition in the trials of SBLA. The results of the statistical analysis of the biogas data reported in Table 4 show a significant 5% higher CH4 content in the biogas produced by the fermentation in the presence of 0.2% CV and CVD SBO (reactor B), as compared to the control fermentation (reactor A), and a 9% higher rate of biogas production in the presence of 0.2% CV SBO (reactor B), as compared to the control fermentation (reactor A). The rate of biogas production in the trials of SBLA is more than double as compared to the rate of biogas production in the trials of OT.
| Trial no. | Test and Control | Biogas components % | Biogas production rate L per day | ||
|---|---|---|---|---|---|
| N2 | CH4 | CO2 | |||
| a For each trial, values for the control fermentation are right below the values for the test slurry. Within the same column, values followed by different letters indicate significant differences for the test and corresponding control fermentation at p < 0.05. | |||||
| 1 | 0.05% CV SBO | 12.41 ± 0.64 | 49.84 ± 1.03 | 37.53 ± 1.23 | 381.9 ± 66.5 |
| Control | 14.92 ± 1.77 | 48.54 ± 0.74 | 36.03 ± 1.88 | 381.8 ± 71.3 | |
| 2 | 0.2% CV SBO | 9.07 ± 0.66 | 51.02 ± 0.40a | 39.88 ± 0.52 | 445.4 ± 18.9a |
| Control | 9.99 ± 0.62 | 48.46 ± 0.91b | 41.48 ± 1.22 | 408.3 ± 13.0b | |
| 3 | 0.05% CVD SBO | 10.45 ± 1.35 | 49.92 ± 0.75 | 39.13 ± 1.56 | 391.2 ± 33.9 |
| Control | 14.61 ± 0.92 | 48.65 ± 0.94 | 36.29 ± 1.31 | 375.9 ± 33.1 | |
| 4 | 0.2% CVD SBO | 7.58 ± 2.25 | 51.38 ± 1.07a | 40.01 ± 2.29 | 434.4 ± 16.6 |
| Control | 9.48 ± 3.51 | 48.82 ± 1.16b | 41.61 ± 3.28 | 391.5 ± 39.1 | |
Comparison of the performance of process 2 in the different industrial sites and lessons learned
The results obtained confirmed the successful replication of the effect of SBO in the trials performed in ACEA, SBLA and OT, although the environmental context and the composition of biowaste and SBO were different in the three operational sites selected. The trials conducted in ACEA investigated the continuous increase of SBO's concentration between 0 and 0.17% and allowed determining the concentrations at which the SBO started to appear and to increase. The experiments of OT and SBLA enabled assessing the acclimation effect of SBO at a constant product concentration. Table 5 summarises the highest statistically significant effects obtained at each industrial site.| Case | Operational site and set up | SBOb w/V % | SBO type/CN | NH3 % reduction | Biogas production relative rate increase % | CH4 and/or N2 increase % |
|---|---|---|---|---|---|---|
| a No data given when % changes were not significant. b SBO concentration in reactor B fermentation slurry. | ||||||
| 1 | ACEA full-scale reactor (2560 m3) | 0.10 | CVD/10 | 55 | ||
| 2 | ACEA full-scale reactor (2560 m3) | 0.17 | CV/12.7 | 28 | ||
| 3 | OT pilot-reactor (480 L) | 0.05 | CVD/8.9 | |||
| 4 | OT pilot-reactor (480 L) | 0.20 | CVD/8.9 | 27 | 8 | CH4 5.5, N2 31 |
| 5 | OT pilot-reactor (480 L) | 0.05 | CV/19.3 | |||
| 6 | OT pilot-reactor (480 L) | 0.2 | CV/19.3 | 21 | 19 | N2 46 |
| 7 | SBLA pilot-reactor (400 L) | 0.05 | CVD/11.8 | 31 | ||
| 8 | SBLA pilot-reactor (400 L) | 0.2 | CVD/11.8 | 41 | 5 | CH4 9 |
| 9 | SBLA pilot-reactor (400 L) | 0.05 | CV/18.8 | 22 | ||
| 10 | SBLA pilot-reactor (400 L) | 0.2 | CV/18.8 | 68 | 5 | |
The feedstock was deemed the most critical issue in the current work, since the site specific variability of municipal biowaste could potentially jeopardize the manufacture of biobased products, which typically require constant reproducible composition and performance specs, and therefore, their sustainable production and marketability. Fig. 3 confirms that the biowaste collected in the multi-site case study involving the Italian ACEA, Greek OT and Cypriot SBLA plants included significantly different composition and thus, produced different composts and SBO via process 1. The C/N levels of SBO obtained, ranging between 7 and 19, demonstrate that the specific products included a rather widely varying composition. Previous work6 has established that SBO obtained by a wide variety of municipal biowaste composts contains a range of organic moieties constituted by aliphatic as well as aromatic carbon and functional groups with different acid strengths. C/N in the specific SBO was correlated with the chemical composition of each product by the following equation.
| C/N = –1.81 + 2.60 Z | (2) |
| SBO | Proximate C types and functional groups | ||||||
|---|---|---|---|---|---|---|---|
| Aliphatic | Saccharide | Lignin aromatic | Carboxylate | Peptide | Ammine | Ketone | |
| CV SBO | 37 | 18 | 20 | 12 | 2 | 6 | 5 |
| CVD SBO | 41 | 18 | 18 | 10 | 6 | 4 | 3 |
The C types and functional groups listed in Table 6 represent the memory of the proximate organic moieties present in the pristine biowastes, from which the SBO was obtained. According to eqn (2), for the SBO obtained in the present work with 7–19 C/N, Z ranges from 3.4 to 8.0. This indicates that amine, amide and carboxylate C account from 29 to 12% of total C. Notwithstanding this compositional variability, except for the OT CV and CVD SBO employed at 0.05% concentration, all other SBO products listed in Table 5 have been proven capable of reducing ammonia at significant levels ranging from 21 to 67%.
The analysis of process 2 performance at each industrial site allows a number of useful comments. In the ACEA trials, the liquid and solid digestate phases could be separated, thanks to the on-site available facilities and routine operation, and different levels of ammonia reductions were measured in the separated phases. For example, upon occurrence of the most prominent effect of SBO, the ammonia reduction levels were 46 and 23% in the liquid and solid phases of reactor B, respectively. According to previous laboratory trials,12 both chemical and biochemical catalysis are likely to occur in the fermentation slurry in the presence of the added SBO. Specifically, chemical catalysis by SBO occurs due to its content of Fe ions bonded to the complexing acid and basic functional groups listed in Table 6. The key claim to explain the SBO catalytic effect is that the complexed Fe ions are kept in solution at alkaline pH and, in this fashion, can induce the chemical oxidation of ammonia to N2. This mechanism may not be as kinetically favoured in the solid digestate phase. On the other hand, in the ACEA trials the ammonia reduction effect is maintained even after washing out the SBO. This fact may induce thinking that the SBO products during their presence in the fermentation slurry interact, by virtue of their carboxylic and proteic moieties, with the microorganisms present in the fermentation slurry and induce a selection in the bacterial population by inactivating some and empowering others. This event requires a longer time than the chemical catalysis, in order for the selected active microorganism population to acclimatise. The bacterial acclimatisation seems also well in line with the results obtained in the OT and SBLA trials. The SBO effect in these trials became statistically significant after nine days of fermentation at constant SBO concentration and increased until the end of fermentation when the maximum ammonia reduction value reported in Table 5 was measured.
Microbiological analysis of the bacterial and archaeal population in SBO-assisted fermentation and corresponding controls were performed in the trials of SBLA. The composition of the microbial communities formed at phylum and genus levels was determined at the beginning of each experiment (control, 0.2% CV SBO and 0.2% CVD SBO) and at the end of fermentation (control, control (CV), 0.2% CV SBO and 0.2% CVD SBO) (Fig. 9A). Firmicutes and Bacteroidetes comprised the dominant phyla at the onset of the trials, while Synergistetes also included a significant content. Members of the aforementioned phyla were abundant at the beginning of both control and SBO assisted fermentation (0.2% CV and CVD SBO trials). The microbial community composition at the phylum level was relatively similar in all trials performed and significant changes were not observed over time.
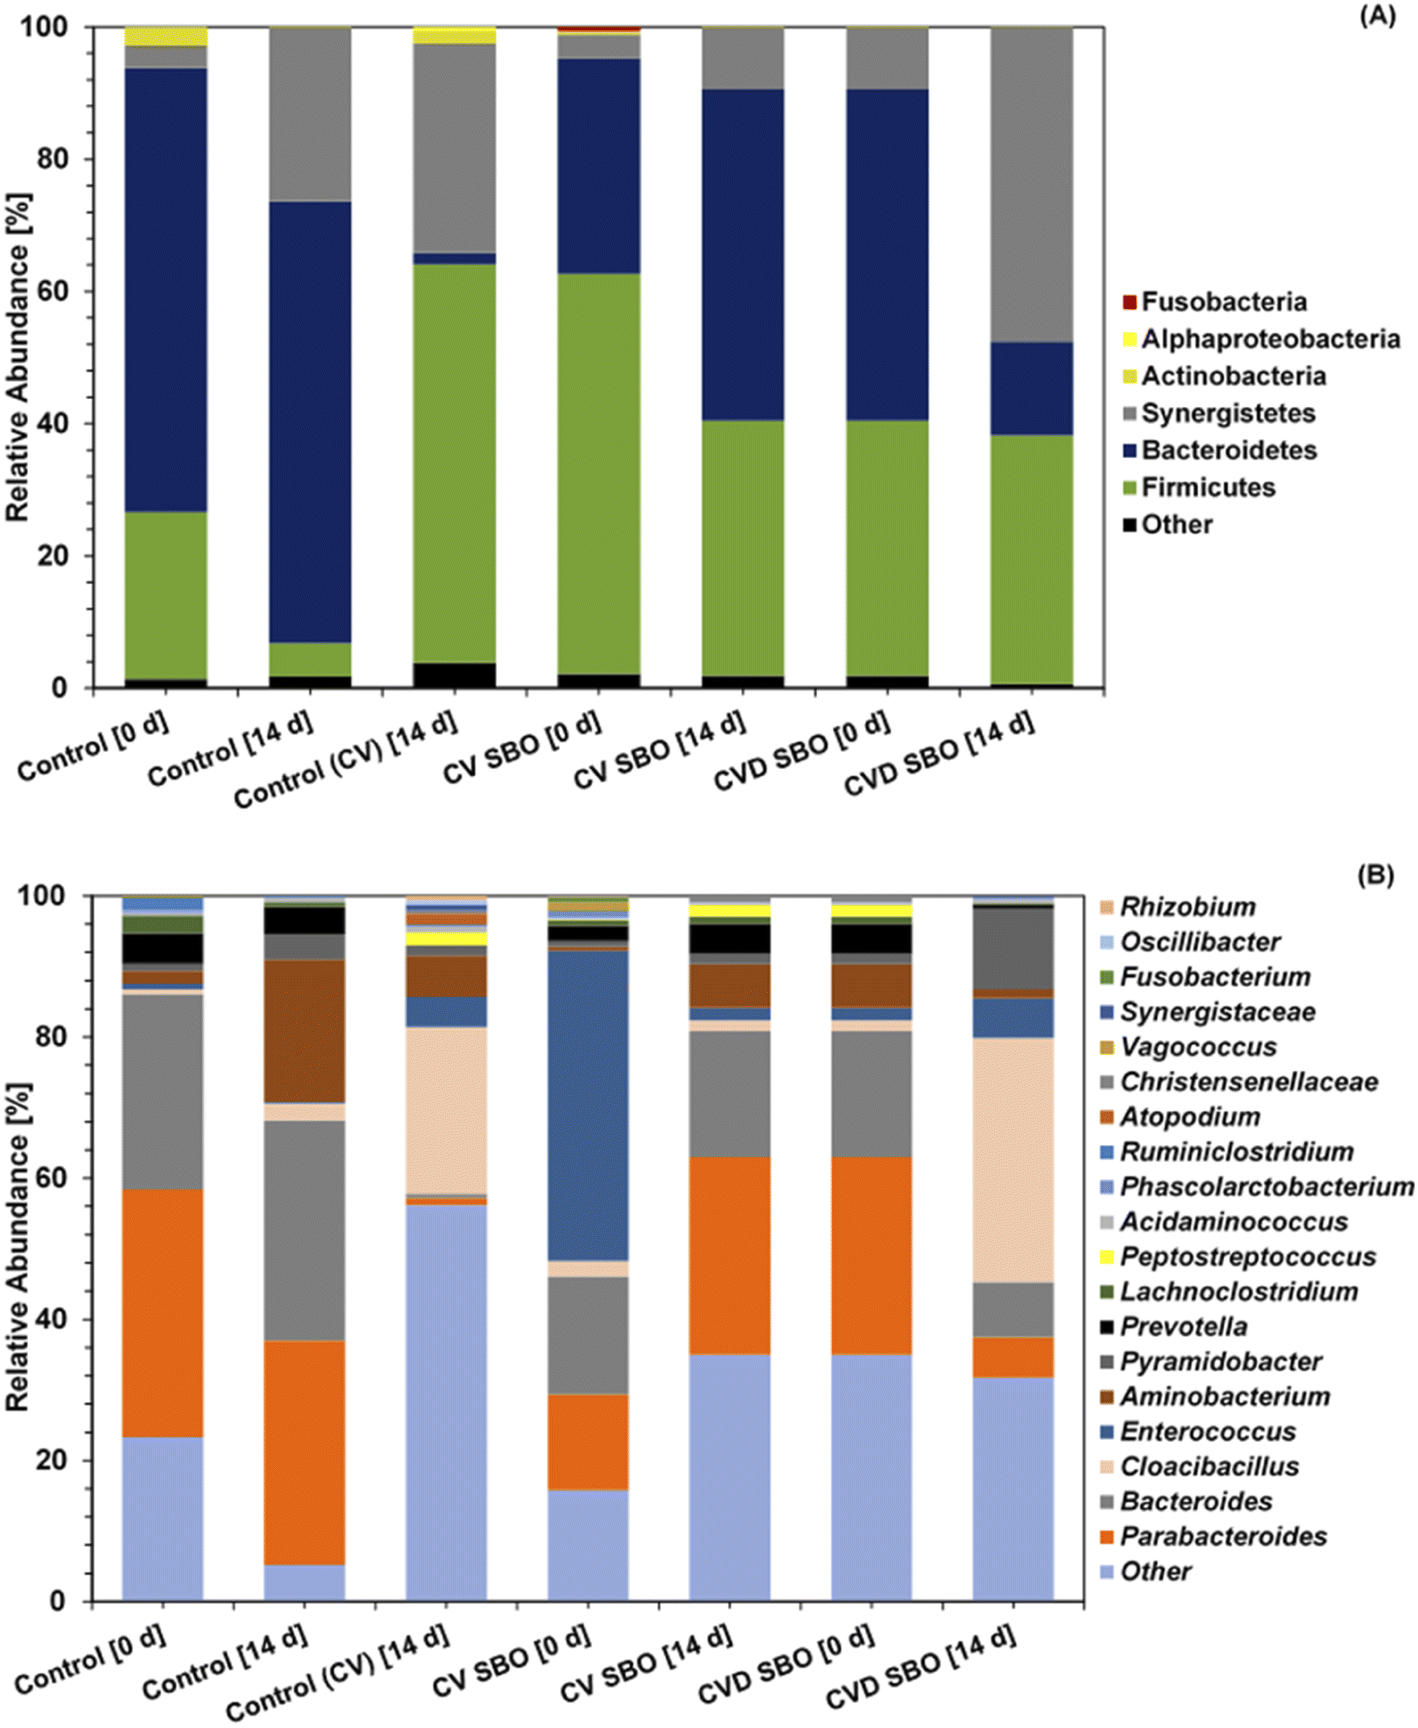 | ||
| Fig. 9 Phylum (A) and genera (B) level relative abundance of bacterial communities present in the experiments. Control [14 days] and Control (CV) [14 day] correspond to reactor A sampled at the time that reactor B was fed with 0.2% CVD SBO and 0.2% CV SBO, respectively. The rest of the samples (CV SBO [0 day], CV SBO [14 days], CVD SBO [0 day], and CVD SBO [14 days]) were withdrawn from reactor B containing 0.2% CV SBO and 0.2% CVD SBO on 0 and 14 days, respectively. Phylum level classification accounting for ≤1% in at least one sample is presented as other. Genus level denoted as other corresponds to the genera not detected through the microbial community analysis. | ||
The presence of Firmicutes and Bacteroidetes in all reactors could be highly related to the composition of the feedstock used, given that the specific bacteria commonly exist in AD systems fed with food waste. Bacteroides and Firmicutes phyla comprise important proteolytic bacteria, which produce protease enzymes capable of breaking down peptide bonds in protein macromolecules. Proteolytic bacteria ranged between 61.7–77.0% and 61.7–80.2% in the presence of 0.2% CV and CVD SBO, respectively. Small differences were observed in the contents of these phyla as compared to the corresponding controls, which could occur due to the competitive relationships between proteolytic microbes and bacteria that assimilate easily biodegradable carbohydrates.
Comparing the content of the most relevant bacteria at the genera level in all reactors, as opposed to the corresponding control, significant changes were observed over 14 days of fermentation (Fig. 9B). The microbial composition formed using 0.2% CV SBO showed that Enterococcus was the dominant genus (43.9%) at the beginning of fermentation, while on day 14 that was reduced to 1.7%. Similar results were obtained for the 0.2% CVD SBO slurry, where the content of the most abundant genera (Parabacteroides, 28%) was reduced to 5.8% at the end of the experiment.
The relative abundance of archaeal communities was also determined (Fig. 10). Although both archaea and bacteria constitute prokaryotic cells, they include different metabolic properties and they are commonly studied separately in AD. Archaea comprise the most important methanogenic microbes of the process and thus, the abundance of the specific microorganisms was additionally studied in the analysis of microbial dynamics. Similar results were obtained regarding the relative abundance of archaea formed at the beginning and end of the experiments as compared to each control, indicating no meaningful changes in the dominant genus Methanobrevibacter (>86.7%). The specific genus maintained the leading role in methane production in all reactors, followed in the order of lower abundance by Methanosphaera (0.9–6%), Methanosaeta (0.8–4.5%), Methanospirillium (0.3–1.5%), Methanosarcina (0.2–1.2%) and other minor ones.
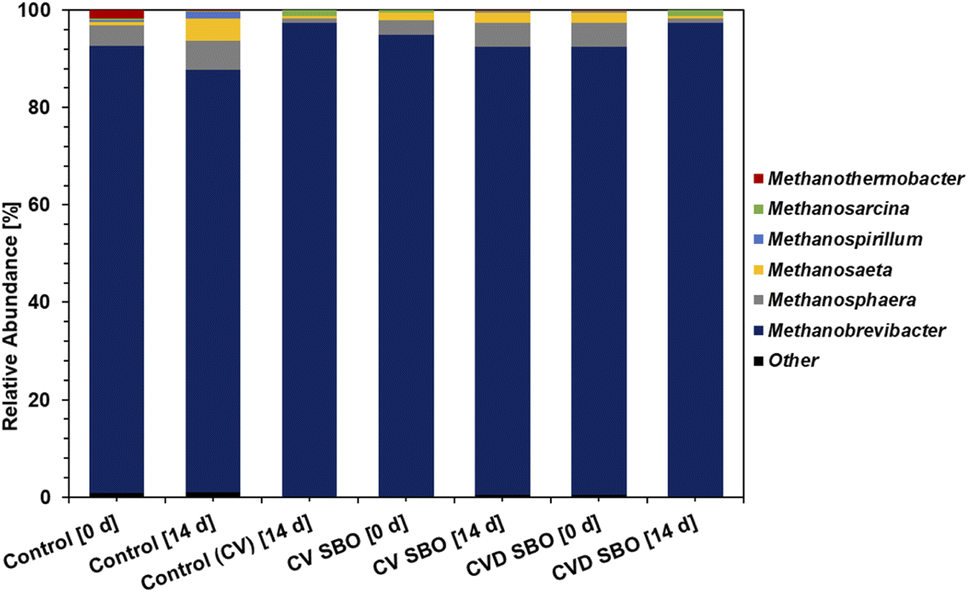 | ||
| Fig. 10 Archaeal abundance for the samples of Fig. 9. | ||
The changes monitored in the microbial population could potentially explain the different levels of high ammonia reduction achieved using 0.2% CV and CVD SBO. Thus, the substantial reduction of Enterococcus in the case of 0.2% CV SBO could be associated with the higher ammonia reduction that occurred as compared to the application of 0.2% CVD SBO, where the major genus on day 14 comprised Cloacibacillus. Enterococcus, metabolizing a diversity of fermentable substrates, is capable for extracellular electron transfer to Fe(III), while holding electrochemical activity.16 Thus, Enterococcus present in the 0.2% CV SBO slurry on day 0 could have contributed to the metabolism of fermentable substrates coupled with electron transfer to Methanosarcina (Fig. 10). CV SBO contains iron bonded to the organic matter holding the capacity to promote chemical oxidation processes involving electron transfer between the Fe2+/Fe3+ couple.17 Biochemical and chemical catalysis might operate synergically and explain the higher ammonia reduction achieved using 0.2% CV SBO. However, the statistical analysis of apparent changes in the cellular population did not prove that measured differences in microbial dynamics during fermentation were significant. Moreover, it should be considered that SBO contains acidic and complexing functional groups of different strengths and protein-like moieties (Table 6), which could interact with microbial cells during fermentation. Thus, although the change in the microbial population was not confirmed statistically significant, the interplay of the aforementioned chemical components with the cells entailed could potentially modulate microbial activity. The specific effect could not be determined via the next generation sequencing (NGS) method applied to analyze the composition of the microbial community. However, the interaction of the different chemical groups of SBO with cells could either reduce or promote the activity of certain microorganisms selectively leading to the macroscopic effect monitored upon SBO addition.
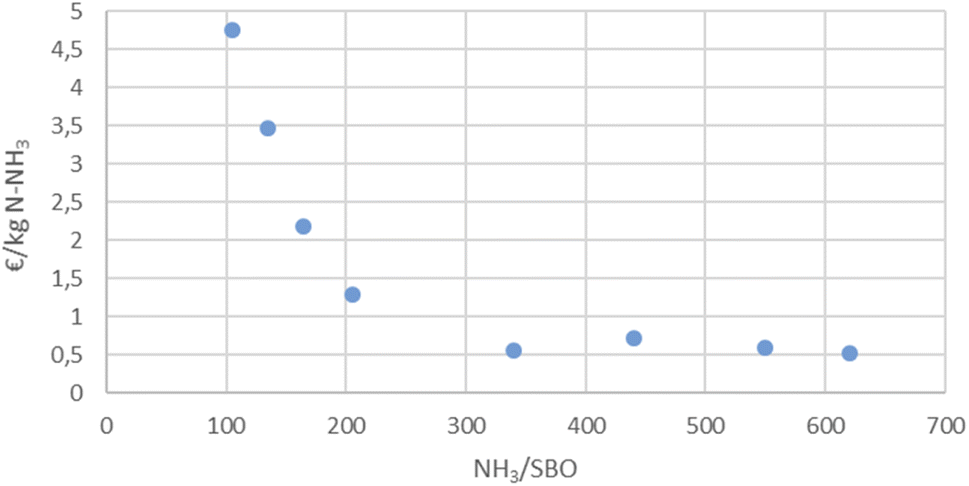
The analytical limitations of the microbial analysis and the complexity of the microbial population do not allow assessing the biochemical mechanism for the observed effects. Yet, from the practical operational point of view, the data obtained in the present work allow collecting important useful information. The different performances of process 2 reported in Table 5 appear to depend on the type and concentration of the SBO, as well as on the type of inoculum used in the different trial sites. Generally, for each SBO type a higher concentration yields higher ammonia reduction. This is true also for the effects on the biogas production and/or composition. It is remarkable that, in spite of the differences of the materials used at each site, the effects of SBO were confirmed statistically significant at each trial site. Fig. 11 shows the plot of the % ammonia reduction against the 100/Z parameter calculated by using eqn (2) from the SBO C/N values in Table 5. The 100/Z parameter gives the ammine, amide and carboxylate functional groups C % of the total carbon contained in each SBO. The data for the OT 0.05% CVD SBO and the SBLA 0.2% CVD SBO trials in Table 5 are omitted from the plot. The trend shown by eight out of the ten experimental data couples in Table 5 suggests that the relative ammine, amide and carboxylate functional groups C % of SBO is certainly a main parameter ruling process 2 performance. This induces thinking that the molecules bearing these functional groups could potentially constitute the active principles. The isolation of the active principles and their use may guarantee the reproducibility of the product performance level as a function of its concentration, regardless of its sourcing site. It is certainly a further step to consider toward the real industrialisation of processes 1 and 2.
 | ||
| Fig. 11 Plot of values for ammonia % reduction presented in Table 5vs. 100/Z = ammine, amide, and carboxylic C %, relative to the total C content in SBO. | ||
Environmental life cycle assessment (E-LCA)
The environmental performance of processes 1 and 2 was assessed through life cycle assessment (E-LCA). The study followed the typical scheme according to the ISO 14040 series (ESI Fig. S2).† It considered the entire life cycle of products and processes developed in the present work. The assessment comprised all stages from biowaste generation and collection, anaerobic digestate and compost manufacture, and SBO production (process 1), use (process 2) and disposal (Fig. 1).The study addressed the following issues:
(i) the environmental impact factors of the new processes considering direct and indirect activities,
(ii) identification of the hot spots that contribute to increasing the environmental impact of the novel products,
(iii) comparison of the environmental impact of the new products with the ones to be replaced and
(iv) specific process amendments on the hot spots to optimize the environmental impact reduction without decreasing the products' yield of the new processes.
The methodology for the sustainability assessment included the following most significant points.
(a) The functional units are referred to the production of 1 kg of biogas, produced from the anaerobic digestion process.
(b) The selected environmental impact categories for the developed processes are the abiotic depletion potential in MJ (energy coming from fossil sources), the global warming potential (GWP 100 years) including biogenic carbon in kg-CO2 equivalents, the acidification potential in kg SO2-equivalents and the eutrophication potential in kg-P-equivalents.
(c) The representative system boundaries (Fig. 1) for a “gate-to-gate” approach include (α) pre-treatment of municipal solid waste and separation of the organic fraction of municipal solid waste, (β) feeding of the organic fraction of municipal solid waste to the anaerobic digesters and production of biogas and digestate, (χ) processing of the digestate, (δ) production of compost from green wastes (i.e. CV compost) or from digestate-green waste mixture (i.e. CVD compost), (ε) production of SBO through the hydrolysis of CV and/or CVD and (ϕ) addition of the SBO to the anaerobic digestion.
First, the Life Cycle Inventory (LCI) was carried out (Fig. 12). This includes the energy and material flows for the anaerobic digestion, compost and hydrolysis processes depicted in the Fig. 1 scheme. The input/output mass and energy data were collected from the three ACEA, SBLA and OT operational sites, where the composts, the SBO and the biogas were produced (see the hydrolysis process 1 and the SBO assisted process 2 sections, respectively). The calculated mass and energy input/output in Fig. 12 are referred to the unitary production of biogas, compost and SBO, respectively. Over the entire duration of the SBO assisted fermentation trials, total biogas production at the three industrial sites was about 892 N m3 at the ACEA site, 12 kN m3 at the OT site and 23 kN m3 at the SBLA site. These figures reflect the different sizes of the anaerobic digesters used in the three countries (Italy, Greece and Cyprus), where the three industrial sites are located, respectively. Calculations were made for SBO inputs in the digester corresponding to 0.1 and 0.2 w/v % concentrations in the feed slurry (Table 5) for the ACEA and for the OT and SBLA fermentation, respectively. In the ACEA fermentation, the calculated SBO concentration in the feed slurry accounted also for the liquid digestate recycled to the bioreactors (see the Fig. 1 scheme).
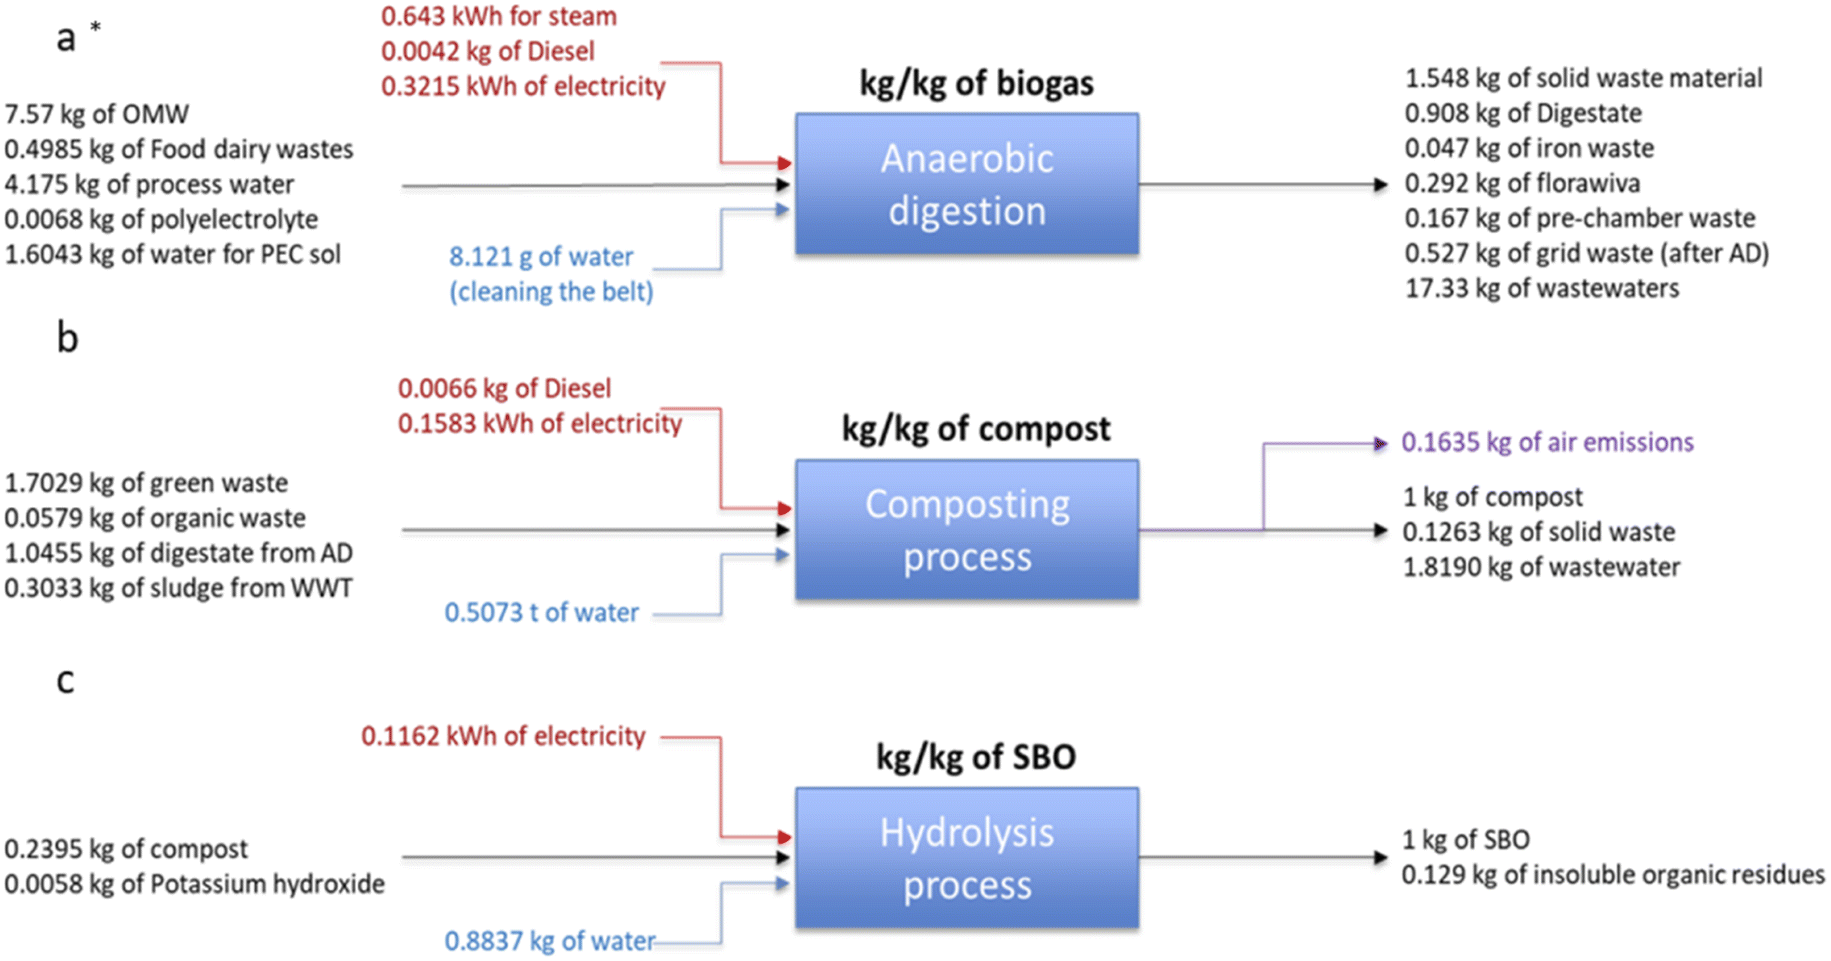 | ||
| Fig. 12 Mass and energy input/output for the anaerobic digestion process in kg kg−1 of biogas (a), composting process in kg kg−1 of compost (b) and hydrolysis process in kg kg−1 of SBO (c). Legends: organic fraction of municipal solid waste (OMW); anaerobic digestion (AN); sludge waste water treatment section (WWT); soluble biobased product (SBO); insoluble organic residue accounted as unreacted compost. | ||
The impact assessment was performed by using LCA software Gabi 6 from Think Step. This can successfully model a new product or service under the concept of LCA. It also contains an easily accessible and continuously updated data library, which describes in detail the energy and the environmental impact of many materials or processes such as organic or inorganic chemicals, energy (electricity and steam), waste treatment processes and many more. The Gabi 6 software allowed generating the flow diagram for the composting process, the hydrolysis process 1 and the anaerobic fermentation process 2, when implementing the compiled LCI.
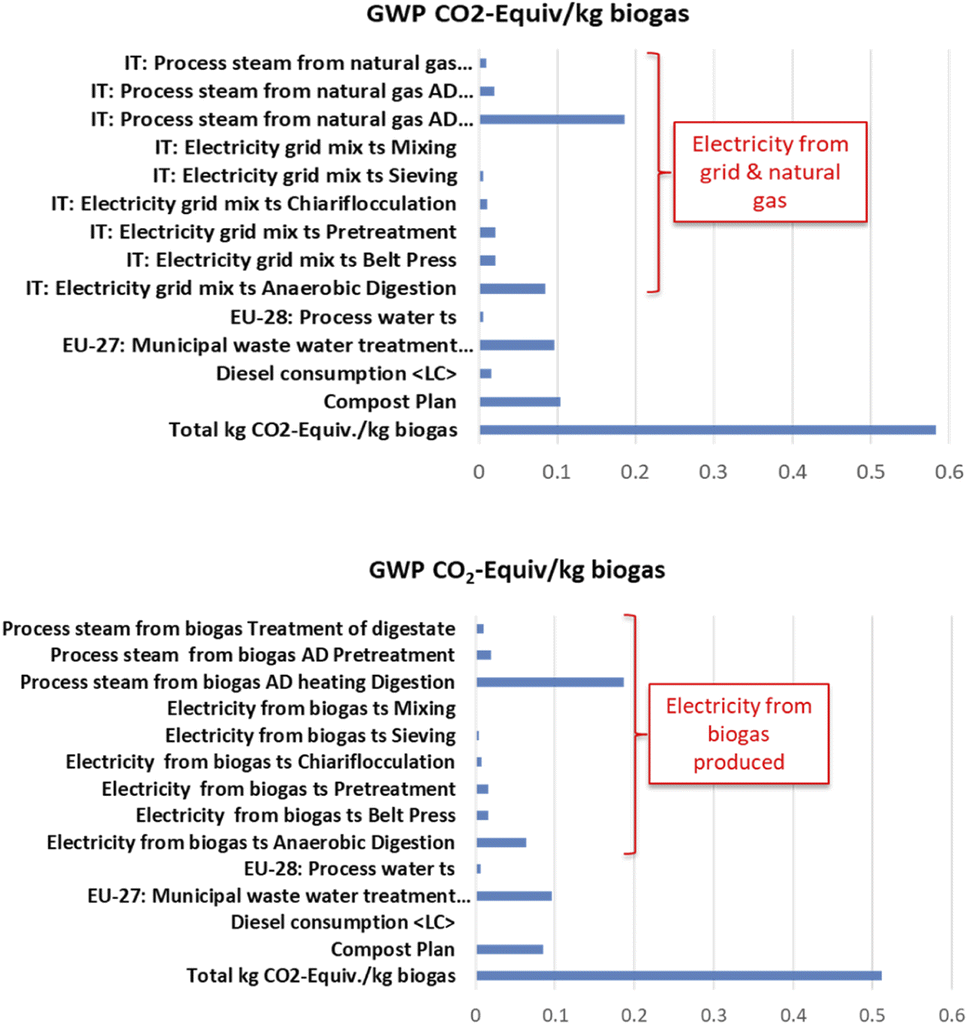 | ||
| Fig. 13 Contribution of the global warming potential (GWP) of anaerobic digestion (AD) and compost plan. | ||
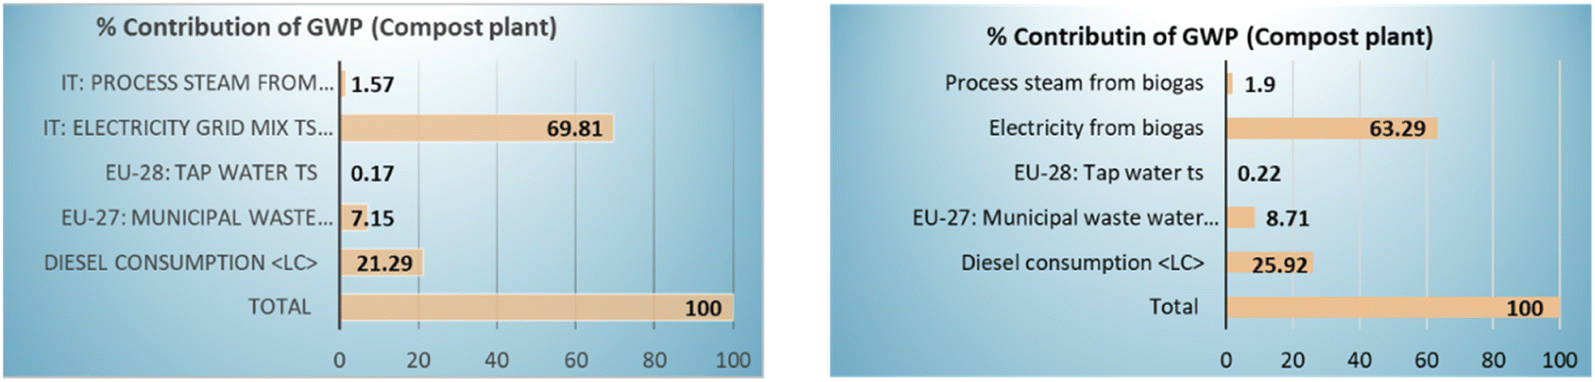 | ||
| Fig. 14 Contribution of the global warming potential (% GWP) of ‘hot spots’ in the compost plant. | ||
The total GWP in Fig. 13 was estimated taking into consideration two different aspects for the electricity. In the first, electricity was generated from grid and natural resources. In the second, electricity was generated from the biogas produced in AD. The results represent the net values of the environmental indicators for biogas production in the cases of SBO addition and in the case without SBO addition in the digester. The estimation of the environmental performance of the process is based on the ACEA, SBLA and OT experimental data. The results indicate that the amount of the produced biogas is almost the same for all the cases. It may be observed that the main hotspot is related to the energy needed for the steam generation for the AD process. When electricity is generated from grid and natural resources, the total GWP is equal to 0.58 kg CO2-eq. per kg of biogas produced. When electricity is generated from the biogas produced in AD, the total GWP is equal to 0.51 kg CO2-eq. per kg of biogas produced. When electricity generated from biogas replaces the same amount of electricity produced from the grid, the GWP decreases by 12.07%. The second highest contributor is the municipal wastewater treatment which is the same in both cases (0.10 CO2-eq. per kg of biogas). Additionally, the compost plant contributes 0.1 and 0.09 CO2-eq. per kg of biogas in the first case and in the second respectively. All the hot spots of the compost process separately are presented in Fig. 14. The higher contributor appears the electricity requirement. When electricity is generated from biogas, a decrease of 10% is achieved in the GWP of the compost process.
The environmental LCA indicators of abiotic depletion potential and acidification potential were estimated taking into account the biogas produced in the anaerobic digestion (AD) process. In all sites (ACEA/OT/SBLA) abiotic depletion and acidification potential were the same. They were assessed to be 0.83 MJ kg−1 biogas and 2.17 g SO2-eq. kg−1 biogas, respectively.
The impact category of eutrophication potential has different values between the cases. The results show (Fig. 15) that the addition of 0.1% CVD SBO (Table 5, case 1) in the ACEA industrial plant leads to 55% reduction of the eutrophication potential. In the SBLA and OT prototype plants, the addition of 0.2% CV SBO (Table 5, case 10 and case 6, respectively) results in the reduction of the eutrophication potential by 67% and 24%, respectively.
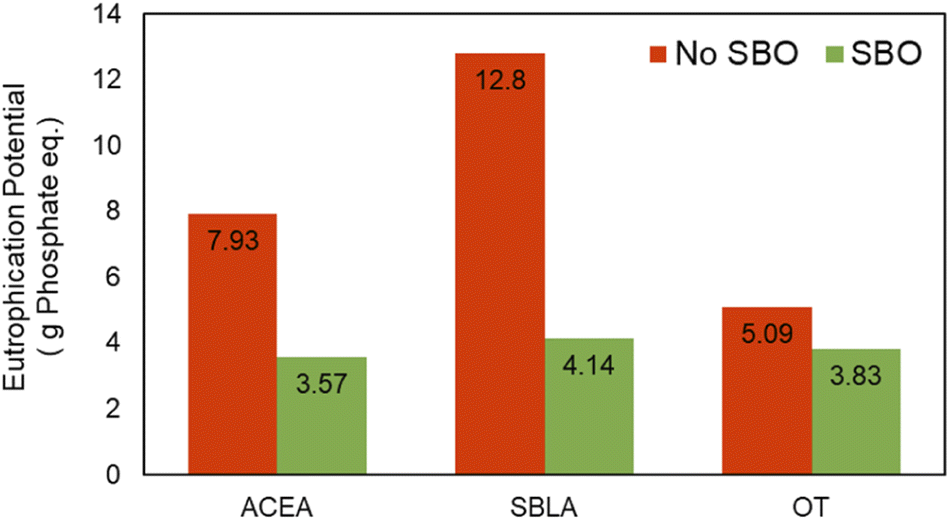 | ||
Fig. 15 Eutrophication potential (g phosphate eq. kg−1 biogas) for anaerobic digestion (AD) and compost processes without the addition of SBO ( ) and with SBO addition ( ) and with SBO addition ( ). Legend: soluble biobased product (SBO). ). Legend: soluble biobased product (SBO). | ||
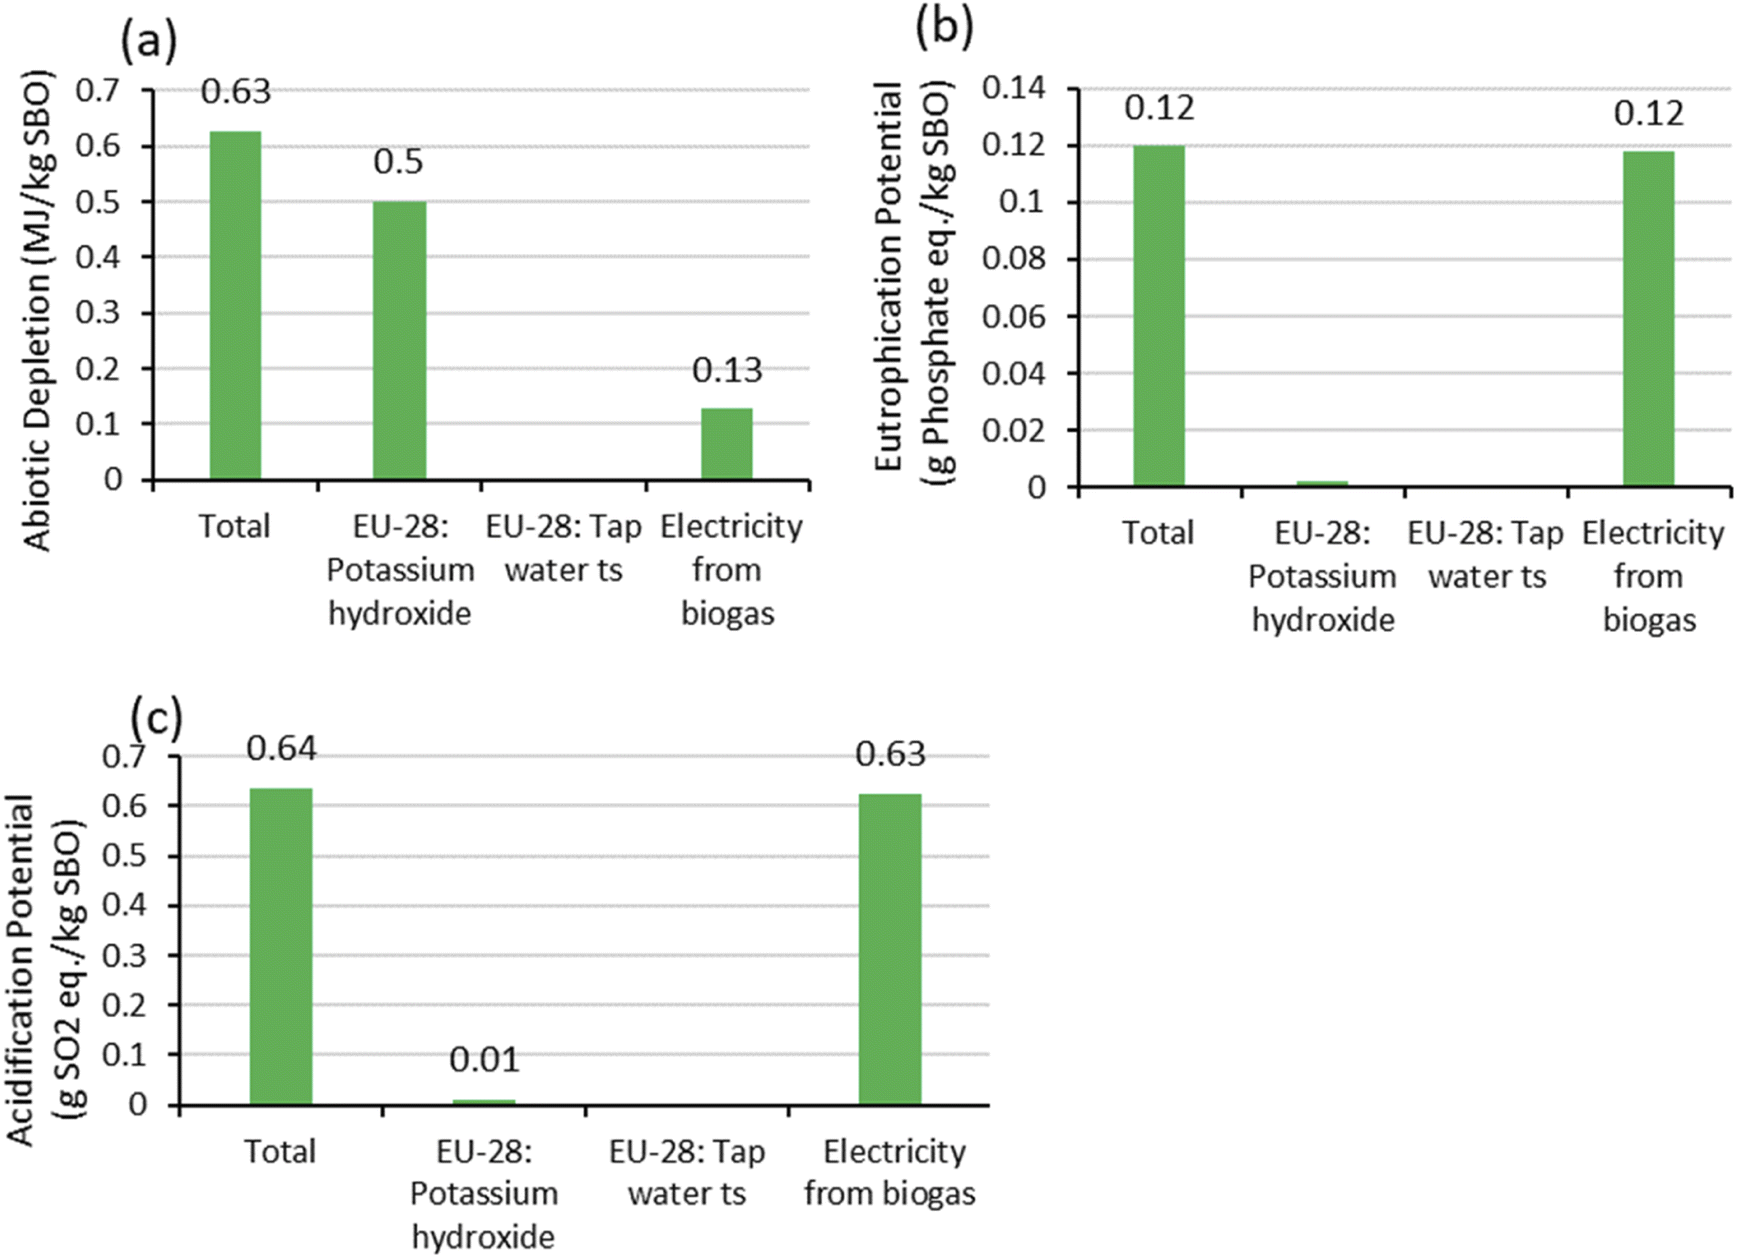 | ||
| Fig. 16 Environmental indicators for the hydrolysis process. (a) Abiotic depletion. (b) Eutrophication potential. (c) Acidification potential. Legend: soluble biobased product (SBO). | ||
Concluding remarks for E-LCA results
According to the results obtained for process 2, the environmental impact categories of the GWP, abiotic depletion of fossil and acidification potential have the same values (GWP = 0.51 kg CO2-eq. per kg of biogas produced, abiotic depletion = 0.83 MJ kg−1 biogas, and acidification potential = 2.17 g SO2-eq. kg−1 biogas) for the process in the presence and in the absence of added SBO. This was expected, due to the low amount of SBO added in the anaerobic fermentation slurry. The major effect of process 2 is the decrease of eutrophication potential. This was replicated, although at different levels, for the three fermentation plants. It amounted to 55%, 68%, and 24% for the ACEA case 1, SBLA case 10, and OT case 6 (listed in Table 5), respectively. It is clearly related to the reduction of ammonia in the anaerobic digestate. This was the main objective of the work reported here. Lower ammonia in the anaerobic digestate reduces the environmental impact of the digestate for use as a fertilizer. Process 2 accomplishes the reduction of ammonia without decreasing the biogas yield or causing a secondary environmental problem stemming from process 1. Clearance from these effects has been proven in the three ACEA, SBLA and OT industrial sites. On the other hand, the results obtained in these different operational environments allow identifying modes to improve and optimize the SBO assisted fermentation process for further reduction of the ammonia content in the digestate and of the eutrophication potential. The main one is related to the SBO concentration in the slurry and the isolation and use of the active principles in the molecular pool of the crude SBO. The results obtained at the SBLA site, coupled to the those previously published for the process carried out at the laboratory level,4,12 prospect that operating at or above 0.2% concentration of SBO in the slurry and maintaining the SBO concentration in continuous operation mode may allow achieving even 100% reduction of ammonia in the digestate, and thus further reduction of the digestate anaerobic potential negative environmental impact, compared to that assessed in the present work.Assessment of the socio-economic impact (S-LCA) on local economy and population
The S-LCA analysis in the present work was undertaken to complement the E-LCA and LCC analyses, respectively reported in the sections above and here in after below. It is meant here to constitute a basis to build a more comprehensive prospective approach, which linked the three types of impacts stemming from the SBO production and consumption when the authors' envisioned real industrialisation took place. Based on the experimental technical data available from the three ACEA, SBLA and OT case studies, several impact indicators and human categories were considered for the evaluation of the social effects of the possible implementation of processes 1 and/or 2 in the European context. The indicators relate to workers and local community stakeholders, as primary target actors directly affected from the negative and/or positive impact of the new processes 1 and 2. The details of the S-LCA study are reported in the ESI file.† The results indicate a low-medium risk for the measured indicators.Life cycle costing (LCC) analysis of the integrated processes 1 and 2
Process 1 is largely the major source of the cost of the new plant integrating biochemical and chemical treatment of MBW. Due to the low amounts of SBO needed in the SBO assisted fermentation process 2, the added cost of the envisioned plant, relative to the cost of the current conventional MBW treatment plant exemplified by the ACEA plant, depends on the SBO production cost. For the SBO production cost analysis, the ACEA plant (Fig. 2B) was taken as a typical case study of the most advanced MBW treatment plants operating in Europe. The analysis refers to the reactor in Fig. 2A operating under the following conditions: water/MBW w/w 4, pH 13, 90 °C, 20 minutes' residence time, and SBO yield 90% w/w relative to MBW feed. The cost analysis reported in the present work includes the Capital Expenditure (CAPEX) and Operational Expenditure (OPEX) of the hydrolysis unit.The investment CAPEX cost includes direct (DC) and indirect (IC) costs. DC costs concern the main equipment, the procurement of raw materials and the equipment installed in the plant. IC costs arise from process control and management, for example, personnel costs for supervisory, engineering and construction activities. In the evaluation of the CAPEX costs, all the main equipment of the plant (ESI Fig. S3)† is considered as direct costs. The reactor, pump, heat exchangers, and hydro-cyclone are among the main equipment. The cost of the equipment is related to the actual cost of the materials employed for the MBW plant. Other direct costs are related to the design and skid construction personnel, skid, valves, piping, instrumentation, electrical cabinet, and insulation. Indirect costs are constituted by engineering and supervision, and construction costs.
The OPEX estimation foresees all the necessary costs of resources employed for the plant operation. They are subdivided in three main cost sources, i.e. reagents, energy and manpower (Table 7). Electrical consumption was assumed to be 80% of the installed power. Electricity, natural gas (NG) and water costs were extracted from the Eurostats website, considering the prices for Italy. The compost prices were provided by ACEA from their statistics from the last year. NaOH prices were taken from different world databases. These give prices through year 2021, which range from 230 to 470 €/t over North America, India and Europe,18 and in China.19 For the SBO production cost, 390 €/t, falling approximately in the middle of this range, was taken. Personnel costs were considered equal to those of the average wage of a senior engineer and plant worker in Italy.
| Cost items | Consumption (kg per h) | Cost (€/t) | Consumption (t per year) | Cost (€ per year) |
|---|---|---|---|---|
| Reagents | ||||
| Compost | 420 | 9 | 887.04 | 7983.4 |
| Water | 1680 | 1.5 | 3548.2 | 5322.2 |
| NaOH | 75 | 390 | 158.4 | 61776 |
| Total reagents | 75082 |
|||
|
||||
| Energy | Consumption (kW) | Cost (€ per kW) | Consumption (kW per year) | Cost (€ per year) |
| Electrical | 13.5 | 0.15 | 32736 |
4910.4 |
| Thermal NG | 147 | 0.04 | 309429 |
12377 |
| Total energy | 17287 |
|||
| Man power | ||||
| Engineer | 52000 |
|||
| Worker | 38000 |
|||
Total 286 k€ CAPEX and 93 k€ year OPEX costs for the items listed in ESI Fig. S3† and Table 7, respectively, were calculated for the production of 4170 per t per year of 10% SBO solution. Over 5 years' operation, considering a working time of 8 h per day during 264 days per year, average man power 3.4 k€ per month cost (Table 7), total 20.8 kt SBO production and CAPEX amortization, the unitary weight SBO production cost is 36.1 €/t for SBO in 10% solution form.
The cost of the SBO solution has important effects on the overall LCC of the virtuous biowaste cycle encompassing processes 1 and 2. Indeed, the high content of ammonia in the digestate entails post-treatment costs, which range from 1.4 to 11.4 € per kg ammonia N.13 A main objective of the present work was to assess the economic sustainability of the SBO assisted anaerobic fermentation (process 2), compared to the current conventional technologies adopted for the digestate post-treatment. Based on the calculated 36.1 €/t SBO cost and on the ammonia abatement rates given in Table 5, the total cost for the abatement of ammonia in the ACEA, OT and SBLA cases was determined (Fig. 17). The details of these calculations are reported in ESI Table S4.†Fig. 17 reports the ammonia abatement cost, calculated as € per ammonia N kg abated, vs. the ratio of the % NH3 abatement to the % SBO added in the fermentation slurry reported in Table 5. The lowest costs were calculated for the following trials: 0.73 € per kg for the SBLA 0.05% CV SBO trial, 0.6 € per kg for the ACEA 0.1% CVD SBO trial, 0.56 € per kg for the SBLA 0.2% CV SBO trial, and 0.52 € per kg for the SBLA 0.05% CVD SBO trial. Costs above 1 € per kg were 1.29 € per kg for SBLA 0.2% CVD, 2.18 € per kg for ACEA 0.17% CV, 3.47 € per kg for OT 0.2% CVD, and 4.75 € per kg for OT 0.2% CV SBO trials. The data show that the cost of process 2 is strongly dependent of the SBO efficiency as measured from the NH3/SBO parameter. According to the data in Fig. 11, the SBO efficiency is most likely dependent on the content of the active principles in the raw SBO.
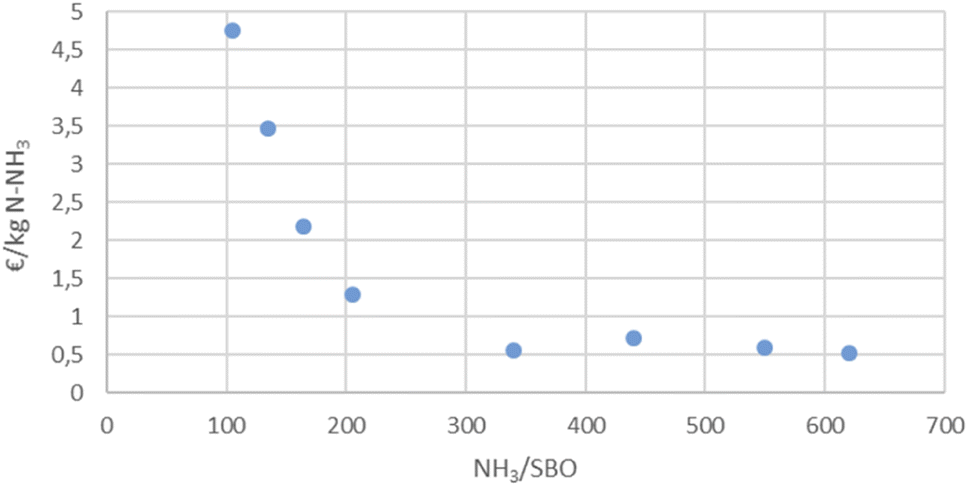 | ||
| Fig. 17 Ammonia abatement cost (€ per kg ammonia N) for process 2 vs. % NH3 abatement/% SBO added in the fermentation slurry reported in Table 5. | ||
The collected data offer scope for worthwhile further research aimed to isolate the active principle responsible for the SBO properties. The results demonstrate that significant cost savings may result from the SBO assisted fermentation process 2, compared to the current conventional digestate post-treatments. Ammonia may be removed from anaerobic digestates by several biochemical and chemical secondary treatments, whose OPEX cost is reported13 from 1.41 to 11.4 € per kg ammonia. For the ACEA plant producing 154 t per year ammonia, 55% abatement by the added 0.1% CVD SBO (Table 5) corresponds to 84.7 t year abated ammonia and implies a total cost of 51 k€ per year. At the present time, the plant adopts a secondary process involving nitrification and denitrification by aerobic bacteria, excess air and added organic C.20 In this fashion, the digestate ammonia is oxidised to N2. For this secondary treatment ACEA pays 4.2 € per kg, which sums up to 356 k€ per year for the abatement of 84.7 t per year abated ammonia. The savings of 305 € per year by process 2, compared to the current ACEA conventional post-treatments, would allow paying off for the SBO production CAPEX cost in less than one year. Moreover, previous work demonstrated12 that the reactions leading to the oxidation of ammonia to N2 take place in the same reactor where the SBO assisted fermentation occurs. Therefore, process 2 does not require additional CAPEX cost for the abatement of ammonia, unlike the conventional secondary post-treatment of the digestate.
The above cost analysis does not account for remarkable reductions of the SBO production cost, which may be expected from the possible process improvements. For example, for process 1, energy may be supplied by the ACEA on-site available electrical and thermal power produced from the plant biogas. Clean water for use in process 1 may be obtained from the plant urban waste water treatment (Fig. 2B). The process compost feed is produced by the plant in the ACEA current business operation. Under these circumstances, all these factors become negative costs. Also, the consumption of the alkali reagents and water may be reduced in a continuous process including ultrafiltration of the crude hydrolysate through 0.2–5 kDa cut off membranes.3 This will allow separating the membrane retentate containing the SBO and the permeate containing the excess unreacted alkali to be continuously recycled to the hydrolysis reactor. Recent laboratory work21 has demonstrated that, by ultrafiltration through membranes with different cut offs, the 5 kDa SBO retentate may be further fractionated in molecular cuts with a narrower molecular weight dispersion over the 5–750 kDa range. This is a promising technology to isolate and/or concentrate active principles for specific uses, which may also empower the efficiency of process 2.
Conclusions
Readers of Green Chemistry are well aware that scaling up green chemistry research from the laboratory to the industrial level requires a long time, many human resources involving multidisciplinary participants from universities and industry, and a great amount of funds to address and solve scientific, technical, environmental, economic and social issues and criticalities. The present paper provides an example of this route. The processes' validation reported here builds on results obtained in previous research carried out and funded over the past eighteen years within five Italian and two European projects, pursuing the long term vision of turning waste treatment plants into biorefineries.The experimental data collected in the present work and their E-LCA/LCC/S-LCA study indicate that the industrialisation of processes 1 and 2 is feasible and replicable in different operational environments. Key elements of the present study is the MBW derived SBO and the demonstration that its production and performance have been successfully replicated in the different operational environments of Italy, Greece and Cyprus. This has happened, in spite of the MBW site-specific variability. The key features of the present work are the MBW feedstock, the solvent and the energy required for process 1. They are negative cost items. They are necessarily produced to meet the pressing social need of coping with the increasing amount of MBW, independently from the production of SBO. The following main outcomes have been obtained in the three different industrial operational sites.
The LCA analysis assessed for process 1 the global warming potential at 0.05 kg CO2-eq. per kg SBO, the abiotic depletion at 0.12 g P-eq. per kg SBO, the eutrophication potential at 0.63 MJ per kg SBO and the acidification potential at 0.64 g SO2-eq. per kg SBO. On the other hand, the use of SBO in process 2 was demonstrated to reduce ammonia in the anaerobic digestate and its eutrophication potential by 28–68% in the three operational sites in Italy, Greece and Cyprus. From the economic point of view, the integration of process 1 and process 2 seems very promising, as the CAPEX and OPEX costs are low. For the ACEA case study, the benefit/cost ratio analysis indicated that the production and use of SBO in process 2, compared to the current ACEA conventional post-treatments of the anaerobic digestate, could entail savings of 305 € per year, which allow paying off the SBO production CAPEX cost in less than one year. The S-LCA analysis demonstrated relatively low social risk for the measured indicators, against the perspective of at least two new job positions for each of the three ACEA, OT, and SBLA cases.
From the scientific point of view, the results propose substances with protein-like moieties, contained in the crude SBO product, as active principles responsible for the reduced ammonia content in the SBO assisted fermentation process 2. Consequently, the isolation of the active principles from the crude SBO and their use in process 2 are further R&D steps, as they are expected to empower the SBO effects and provide further support to the processes and product industrialisation.
The authors are not aware of a similar study in green chemistry research addressing and assessing the replicability of a biobased product derived from municipal biowaste collected in different countries and applied in the different environments of the different countries. The results of the present work prospect that the demonstrated virtuous biowaste cycle integrating processes 1 and 2 can be applied and replicated in other countries with the same environmental, economic and social benefits. This is a remarkable result, considering that the site specific variability of biowastes is a critical issue for process/product industrialisation. Turning readily available complex municipal biowastes into sustainable green feedstock for manufacturing value added renewable speciality chemicals would be a real breakthrough achievement for the rising modern biobased chemical industry.
Methods
Preparation of SBO
MBW composts were manufactured from urban biowastes collected in Italy by the ACEA Pinerolese Industriale SpA (ACEA) company located in Pinerolo (TO), Italy, by the Organohumiki Thrakis (OT) company located in Alexandroupoli (GR) and by the Sewerage Board of Limassol-Amathus (SBLA) company located in Limassol (CY). ESI Table S1† reports the composition of the MBW collected and used to make the different composts (CV and CVD) in Italy, Greece and Cyprus taken as case studies. The biowastes collected in Italy were those of the routine operation of the ACEA plant, for which service the local municipality pays a tipping fee to ACEA. The biowastes processed by OT were the own collected olive mill wastes and the other wastes listed in ESI Table S1,† which were provided by the municipalities of Alexandroupolis and Chalandri Athens. SBLA collected food wastes from local restaurants and the green wastes from local farms, public parks and private gardens. The composts were obtained by fermenting biowastes under aerobic conditions for 12 weeks to yield the stable mature composts. The SBO was obtained by hydrolysis from the above compost with the prototype reactor (Fig. 2A) operated in the ACEA plant (Fig. 2B) under the following conditions: water/compost w/w 4, pH 13, 90 °C, and 20 minutes' residence time. The SBO was obtained as 10% solution and used as such in the anaerobic fermentation trials.Anaerobic fermentation trials
The anaerobic fermentation trials were carried out using two reactors running in parallel, i.e. the control A and test B reactors containing the same slurry feed without and with added SBO, respectively. The ACEA anaerobic bioreactors had 2560 m3 volume each. They were run in continuous mode at 55 °C, pH 8–9, total solids in feed slurry of about 10%, total volatile solids (VS) in feed slurry of 9%, and 15 days' hydraulic retention time. The OT and SBLA reactors had 470 and 400 L volume, respectively, and were operated under the same experimental conditions as the ACEA bioreactors.Compost, SBO and fermentation slurry analyses
Total N, ammonia N, nitrate N in the fermentation slurry, elemental C and N, and dry matter contents in compost and SBO were determined by a standard known procedure, whose details have been previously reported.3,4,12,13DNA extraction and NGS
16S rRNA sequencing was performed to determine the composition of the microbial community at the beginning of the process and upon fermentation completion. Samples of 0.3 g each were withdrawn from the inocula applied at the beginning of fermentation (CVD Control, 0.2% CV SBO and 0.2% CVD SBO) as well as the final communities formed following 14 days of cultivation (CVD Control, CV Control, 0.2% CV SBO and 0.2% CVD SBO). Total genomic DNA was extracted using a FastDNA spin kit for soil (MP Biomedicals, USA) and the genome was sequenced with DNASense ApS (Aalborg, Denmark). The V1–V3 region was targeted for bacteria analysis employing the primer set [27F] AGAGTTTGATCCTGGCTCAG and [534R] ATTACCGCGGCTGCTGG, while the forward and reverse tailed primers ([Arch-340F] CCCTAHGGGGYGCASCA and [Arch-915R] GWGCYCCCCCGYCAATTC) were used for archaea 16S rRNA gene region V3-5 sequencing. PCR amplification was conducted, as previously reported.12 The samples were paired-end sequenced (2 × 300 bp) on a MiSeq (Illumina, USA) using a MiSeq Reagent kit v3 (Illumina, USA) following the standard guidelines for preparing and loading samples on the MiSeq. Clean reads were assigned to operational taxonomic units at 97% sequence similarity and were classified with the SILVA database using a confidence threshold of 80%.Author contributions
E. Montoneri conceived the initial concept, built the starting TRL, acted as the technical manager of both the LIFECAB and LIFEEBP (see the Acknowledgements section) and wrote the present article. S. Solaro was the LIFECAB project coordinator. M. Negre, M. Koutinas, A. Koutinas, D. Mainero, A. Vlysidis and V. Konstantinidis were the leading scientists of the Hysytec, Università degli studi di Torino, Cyprus University of Technology, Agricultural University of Athens, ACEA Pinerolese Industriale, Organohumiki Thrakis and Sewerage Board of Limassol LIFECAB beneficiaries, respectively. D. Ladakis carried on the E-LCA/S-LCA. F. Liendo contributed to the cost analysis of the LIFECAB project. All other authors contributed to the execution of the SBO production and SBO assisted fermentation trials.Conflicts of interest
The authors declare no competing interests.Abbreviation
| ACEA | ACEA S.p.A. Municipal Biowaste Treatment Company in Italy |
| CAPEX | Capital Expenditure |
| CV | compost of green wastes |
| CVD | compost of food wastes' digestate and green waste mixture |
| E-LCA/LCC/S-LCA | Environmental life cycle assessment/Life cycle costing/Social life cycle assessment |
| kt per year | Thousands of tons per year |
| MBW | Municipal Biowaste |
| Mm3 per year | Million cubic meters per year |
| OT | Organohumiki Thrakis Biowaste Treatment Company in Greece |
| R&D | Research and Development |
| OPEX | Operating Expense |
| SBO | Soluble biobased products obtained by chemical hydrolysis of compost, i.e. the CV and CVD compost yielding the CV SBO and the CVD SBO, respectively |
| SBLA | Sewerage Board of Limassol Waste Water Treatment Company in Cyprs |
| UNITO | University of Torino |
Acknowledgements
This work was carried out within the LIFECAB LIFE16 ENV/IT/000179 project and sets the baseline for the LIFEEBP LIFE19 ENV/IT/000004 project, both funded under the LIFE 2016 and 2029 programmes, respectively. The authors acknowledge the cooperation in LIFECAB of POOLITI for the communication/diffusion of the project results, and of Doctor Luca Barozzini from POOL.ITI S.r.l and Mrs Sorani Montenegro from Hysytec S.r.l. for the administrative aspects of the project, and of the ACEA laborers for helping to run Process 1 and 2 facilities.References
- Ellen Macarthur Foundation, Cities in the Circular Economy: an Initial Exploration, https://www.ellenmacarthurfoundation.org/assets/downloads/publications/Cities-in-the-CE_An-Initial-Exploration.pdf, (accessed December 12, 2021).
- G. A. Sheldon-Coulson, Production of Levulinic Acid in Urban Biorefineries, Thesis (S.M. In technology and policy)https://www.semanticscholar.org/paper/Production-of-levulinic-acid-in-urban-biorefineries-Sheldon-Coulson/116f70becc058aef0af6beb323dfa5c56c422ea3, Massachusetts Institute of Technology, Engineering Systems Division, Technology and Policy Program, 2011, (accessed December 12, 2021 Search PubMed.
- E. Montoneri, Municipal waste treatment, technological scale up and commercial exploitation: the case of bio-waste lignin to soluble lignin-like polymers, in Food Waste Reduction and Valorisation, Morone P., Papendiek F., and Tartiu V. E., eds., Springer, 2017, Chapter 6, DOI:10.1007/978-3-319-50088-1.
- M. Francavilla, L. Beneduce, G. Gatta, E. Montoneri, M. Monteleone and D. Mainero, Biochemical and Chemical Technology for a Virtuous Bio-Waste Cycle to Produce Biogas without Ammonia and Speciality Bio-Based Chemicals with Reduced Entrepreneurial Risk, J. Chem. Technol. Biotechnol., 2016, 91, 2679–2687 CrossRef CAS.
- ACEA PINEROLESE INDUSTRIALE SPA Company Profile | PINEROLO, TORINO, Italy | Competitors, Financials & Contacts – Dun & Bradstreet. https://www.dnb.com/, (accessed December 12, 2021).
- D. Rosso, J. Fan, E. Montoneri, M. Negre, J. Clark and D. Mainero, Conventional and Microwave Assisted Hydrolysis of Urban Biowastes to Added Value Lignin-Like Products, Green Chem., 2015, 17, 3424–3435 RSC.
- M. Negre, E. Montoneri, M. Antonini, G. Grillo, S. a. Tabasso, P. Quagliotto, S. Berto, R. Mendichi, G. Cravotto and A. Baglieri, Product Yield, Quality and Energy in the Hydrolysis of Urban Bio-Waste Compost from Laboratory-Scale Runs, J. Cleaner Prod., 2018, 170, 1484–1492 CrossRef CAS.
- S. Tabasso, M. Ginepro, L. Tomasso, R. Nisticò and M. Francavilla, Integrated Biochemical and Chemical Processing of Municipal Bio-Waste to Obtain Bio Based Products for Multiple Uses. The Case of Soil Remediation, J. Cleaner Prod., 2020, 245, 119191 CrossRef CAS.
- European Environment Agency, Diverting waste from landfill, EEA Report No 7/2009 Diverting waste from landfill - Effectiveness of waste-management policies in the European Union — European Environment Agency (europa.eu), (accessed December 12, 2021) Search PubMed.
- Eurostat statistics, Municipal waste statistics – Statistics Explained (europa.eu), (accessed December 12, 2021).
- EEA, Diversion of Waste from Landfill in Europe, Diversion of waste from landfill in Europe (europa.eu), (accessed December 12, 2021).
- P. Photiou, M. Kallis, C. G. Samanides, I. Vyrides, E. Padoan, E. Montoneri and M. Koutinas, Integrated Chemical Biochemical Technology to Reduce Ammonia Emission from Fermented Municipal Biowaste, ACS Sustainable Chem. Eng., 2021, 9, 8402–8413 CrossRef CAS.
- M. Francavilla, L. Beneduce, G. Gatta, E. Montoneri, M. Monteleone and D. Mainero, Waste cleaning waste: ammonia abatement in biowaste anaerobic digestion by soluble substances isolated from biowaste compost, Biochem. Eng. J., 2016, 116, 75–84 CrossRef CAS.
- W. Fuchs, X. Wang, W. Gabauer, M. Ortner and Z. Li, Tackling ammonia inhibition for efficient biogas production from chicken manure: Status and technical trends in Europe and China, Renewable Sustainable Energy Rev., 2018, 97, 186–199, DOI:10.1016/j.rser.2018.08.038 , (accessed.
- T. Al Seadi, D. Rutz, H. Prassl, M. Köttner, T. Finsterwalder, S. Volk and R. Janssen R, Biogas Handbook, 2008, http://lemvigbiogas.com/, (accessed January 22, 2022) Search PubMed.
- G. T. Kim, M. S. Hyun, I. S. Chang, H. J. Kim, H. S. Park, B. H. Kim, S. D. Kim, J. W. T. Wimpenny and A. J. Weightman, J. Appl. Microbiol., 2005, 99, 978–987 CrossRef CAS PubMed.
- J. Gomis, A. Bianco Prevot, E. Montoneri, M. C. González, A. M. Amat, D. O. Mártire, A. Arques and L. Carlos, Waste sourced biobased substances for solar-driven wastewater remediation: Photodegradation of emerging pollutants, Chem. Eng. J., 2014, 235, 236–243 CrossRef CAS.
- Chemanalyst, Caustic soda price trends and forecast 2021, https://www.chemanalyst.com/Pricing-data/caustic-soda-3, (accessed February 23, 2022).
- Echemi.com, Market price & insight, https://www.echemi.com/productsInformation/pd20150901041-caustic-soda-pearls.html, (accessed February 23, 2022).
- D. Vineyard, A. Hicks, K. G. Karthikey and P. Bara, Economic analysis of electrodialysis, denitrification, and anammox for nitrogen removal in municipal wastewater treatment, J. Cleaner Prod., 2020, 121145 CrossRef CAS.
- E. Montoneri, G. Fabbri, P. Quagliotto, A. Baglieri, E. Padoan, V. Boero and M. Negre, High molecular weight biosurfactants from mild chemical reactions of fermented municipal biowastes, ChemistrySelect, 2020, 5, 2564–2576 CrossRef CAS.
- J. B. Guin Ee, R. Heijungs, G. Huppes, A. Zamagni, P. Masoni, R. Buonamici, T. Ekvall and T. Rydberg, Life cycle assessment: past, present, and future, Environ. Sci. Technol., 2011, 45, 90–96, DOI:10.1021/es101316v.
Footnote |
| † Electronic supplementary information (ESI) available. See https://doi.org/10.1039/d2va00068g |
| This journal is © The Royal Society of Chemistry 2022 |