Nitrogen/fluorine-codoped rutile titania as a stable oxygen-evolution photocatalyst for solar-driven Z-scheme water splitting†
Akinobu
Miyoshi
 a,
Junie Jhon M.
Vequizo
 b,
Shunta
Nishioka
 ac,
Yuma
Kato
d,
Muneaki
Yamamoto
e,
Shunsuke
Yamashita
 f,
Toshiyuki
Yokoi
 g,
Akihide
Iwase
 hi,
Shunsuke
Nozawa
j,
Akira
Yamakata
 b,
Tomoko
Yoshida
d,
Koji
Kimoto
 f,
Akihiko
Kudo
hi and
Kazuhiko
Maeda
 *a
*a
aDepartment of Chemistry, School of Science, Tokyo Institute of Technology, 2-12-1-NE-2 Ookayama, Meguro-ku, Tokyo 152-8550, Japan. E-mail: maedak@chem.titech.ac.jp
bGraduate School of Engineering, Toyota Technological Institute, 2-12-1 Hisakata, Tempaku, Nagoya 468-8511, Japan
cJapan Society for the Promotion of Science, Kojimachi Business Centre Building, 5-3-1, Kojimachi, Chiyoda-ku, Tokyo 102-0083, Japan
dAdvanced Research Institute for Natural Science and Technology, Osaka City University, 3-3-138 Sugimoto Sumiyoshi-ku, Osaka, 558-8585, Japan
eInstitute of Materials and Systems for Sustainability, Nagoya University, Furo-cho, Chikusa-ku, Nagoya 464-8603, Japan
fElectron Microscopy Group, Research Center for Advanced Measurement and Characterization, National Institute for Materials Science, 1-1 Namiki, Tsukuba 305-0044, Japan
gNanospace Catalysis Unit, Institute of Innovative Research, Tokyo Institute of Technology, 4259 Nagatsuta, Midori-ku, Yokohama 226-8503, Japan
hDepartment of Applied Chemistry, Faculty of Science, Tokyo University of Science, 1-3 Kagurazaka, Shinjuku-ku, Tokyo 162-8601, Japan
iPhotocatalysis International Research Centre, Research Institute for Science and Technology, Tokyo University of Science, 2641 Noda-shi, Yamazaki, Chiba 278-8510, Japan
jInstitute of Materials Structure Science, High Energy Accelerator Research Organization, 1-1 Oho, Tsukuba, Ibaraki 305-0801, Japan
First published on 18th May 2018
Abstract
Nitrogen/fluorine-codoped rutile TiO2 (R-TiO2:N,F) was newly synthesized, and its photocatalytic activity for water oxidation was evaluated. R-TiO2:N,F could be prepared by nitridation of the rutile TiO2 (R-TiO2) and (NH4)2TiF6 mixture at 773 K. The prepared samples produced O2 from aqueous AgNO3 solution under visible light irradiation, while R-TiO2 nitrided at the same temperature without any fluorine source showed negligible activity. The highest activity was obtained with the sample prepared at the (NH4)2TiF6/R-TiO2 ratio of 15/85, exhibiting water oxidation activity even in the presence of a reversible electron acceptor such as IO3− or Fe3+ with the aid of a RuO2 cocatalyst. Stoichiometric water splitting into H2 and O2 was achieved using a mixture of Ru/SrTiO3:Rh and RuO2/TiO2:N,F in the presence of [Co(bpy)3]3+/2+ (bpy = 2,2′-bipyridine) as a shuttle redox mediator without noticeable degradation of activity under visible light and even under AM1.5G simulated sunlight. Transient absorption spectroscopy revealed that appropriate nitrogen/fluorine codoping reduces the density of mid-gap states working as deep traps of photogenerated electrons, and increases the number of free electrons compared to only nitrogen-doped R-TiO2. Experimental results highlighted that the photocatalytic activity of R-TiO2:N,F could be enhanced by improving visible-light absorption capability through N/F codoping while suppressing the density of deep trap sites.
Introduction
Exploring a new material that exhibits useful functionality is an important mission in materials chemistry. Of particular interest is the use of p-block elements, which are earth-abundant and light, for synthesizing such a functional material. Mixed anion compounds that contain more than two different anions have recently attracted attention as a new class of materials that exhibit interesting properties including superconductivity, dielectric properties, and catalytic and photocatalytic activity.1Photocatalytic reactions such as water splitting and CO2 fixation on illuminated semiconductors have attracted considerable attention from the viewpoint of solar-to-fuel energy conversion.2–13 For efficient utilization of solar energy, a visible-light-responsive photocatalyst is necessary since visible light constitutes half of the solar spectrum. In this regard, the visible-light absorption capability of narrow-gap mixed anion compounds, which is in general difficult to attain by oxide materials, well fits the bill.1 For example, oxynitrides have energy levels derived from the N 2p state above the O 2p state, causing oxynitrides to have narrower band gaps than corresponding metal oxides.4,9 Because certain (oxy)nitrides exhibit high photocatalytic activity for water oxidation under visible light,4 they are potential candidates not only for water splitting but also for CO2 fixation.12,13
However, synthesis of a mixed anion compound that shows high photocatalytic activity is not always easy. One of the reasons for this is the charge compensation issue when substituting an anion for another that has a different charge (e.g., O2−/N3− exchange). For example, nitrogen-doped TiO2 has been intensively studied as a visible-light-responsive photocatalyst since the report by Asahi et al.14 Although various synthetic routes to nitrogen-doped TiO2 are available,14–24 the low concentration of nitrogen introduced into the TiO2 lattice limits the visible light absorption capability, resulting in lower photocatalytic activity. More importantly, such “aliovalent” substitution in a metal oxide causes the generation of oxygen vacancies, which contribute to lower photocatalytic activity.24 Another difficulty in synthesizing a mixed anion compound arises from the metastability relative to the corresponding oxide materials.1 While synthesis of a new mixed anion compound is very exciting and important, there remains a challenge.
Codoping of two different anions is a potential means of addressing the charge imbalance issue in a doped metal oxide. Domen et al. reported that nitrogen/fluorine codoping into anatase TiO2 resulted in more pronounced visible light absorption and higher photocatalytic activity for water oxidation, compared to nitrogen only doped analogues.16–18 According to that report, this is primarily attributed to an increase in the nitrogen content because of fluorine compensating the charge imbalance caused by nitrogen. Since then, several groups have reported N/F-codoped TiO2 not only for water reduction/oxidation but also for environmental purification.19–21
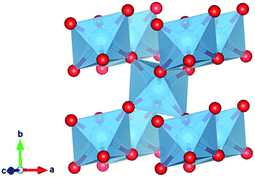
In this work, we focused on N/F-codoped rutile TiO2 (R-TiO2:N,F). Rutile TiO2 (Fig. 1), a well-known wide-gap semiconductor applicable to several types of photocatalytic reactions,25–30 has been reported to possess unique photocatalytic properties for oxygen evolution, which can be beneficial for Z-scheme water splitting.25,27,31–34 Therefore, R-TiO2:N,F is of interest as a potential photocatalyst for water oxidation under visible light. While N/F-codoped anatase TiO2 has been reported already as mentioned above,16–21 however, no report is available for the rutile form. This might be at least in part due to the nature of the anatase-to-rutile phase transition, which typically occurs at high temperatures.35,36 High temperature ammonolysis, which is essential for the introduction of nitrogen into metal oxides,1 may cause the generation of other thermally stable phases such as TiN,37 making it difficult to obtain a single-phase rutile structure.
For the development of a highly efficient semiconductor photocatalyst, it is undoubtedly important to understand photogenerated charge carrier dynamics in a semiconductor. Transient absorption spectroscopy (TAS) is a powerful technique that can visualize the dynamics of electrons and holes generated in an illuminated semiconductor.24,38–47 In fact, the carrier dynamics of binary mixed anion semiconductors such as oxynitrides have been investigated by means of TAS, with several examples available already.24,43–45 For ternary anion systems such as N/F-codoped oxides, however, such a spectroscopic study had not been done, and there is little information on photogenerated charge carrier dynamics in ternary mixed anion systems. The lack of such spectroscopic information makes it difficult to establish a rational strategy for developing a highly active ternary mixed anion photocatalyst.
Here we report a simple synthetic route to synthesize R-TiO2:N,F, which is active for photocatalytic water oxidation under visible light even in a non-sacrificial manner with a reversible electron acceptor to achieve Z-scheme water splitting. Photocatalytic activities of the synthesized materials are discussed, on the basis of the results of physicochemical analyses and transient absorption spectroscopy measurements, in order to show a rational guideline to synthesize an active R-TiO2:N,F photocatalyst.
Experimental
Materials and reagents
Rutile TiO2 (R-TiO2; 99.0%, Wako Pure Chemicals), (NH4)2TiF6 (95.0%, Wako Pure Chemicals), Sr(OH)2·8H2O (96.0%, Kanto Chemical), anatase TiO2 (JRC-TIO-10), Rh(NO3)3 (80.0% as metallic Rh, Kanto Chemical), RuCl3·nH2O (Ru 41.35 wt%; Furuya Metal), AgNO3 (99.8%; Wako Pure Chemicals), La2O3 (99.9%; TCI), NaIO3 (99.5%; Kanto Chemical), FeCl3·6H2O (99.0%, Kanto Chemical), CoSO4·7H2O (99.9%; Kanto Chemical), 2,2′-bipyridine (99.0%; Kanto Chemical), methanol (99.8%; Kanto Chemical), acetone (99.5%; Kanto Chemical), I2 (99.8%; Wako Pure Chemicals) and Na2SO4 (99.9%; Wako Pure Chemicals) were used as received.Synthesis of R-TiO2:N,F
R-TiO2:N,F was prepared by nitridation of the R-TiO2 and (NH4)2TiF6 mixture. R-TiO2 and (NH4)2TiF6 were mixed in an agate mortar and a pestle with various molar ratios using an appropriate amount of methanol. The precursor was loaded on a Ni plate and set at the centre of an alumina tube reactor to prevent contamination.16 After purging air with nitrogen gas, the reactor was heated at 773 K (ramp: 10 K min−1) for 1 h under a dry NH3 flow (flow rate: 50 mL min−1). For convenience, the molar concentration of (NH4)2TiF6 in the mixture is represented as C in the unit of mol%. C = 0 (873 K) samples were synthesized by nitriding R-TiO2 in the same manner at 873 K without adding (NH4)2TiF6.Synthesis of Rh-doped SrTiO3
SrTiO3:Rh was obtained by a hydrothermal synthesis according to a previously reported method.24 In a typical synthesis, 22 mmol of Sr(OH)2·8H2O, 19.6 mmol of TiO2 (JRC-TIO-10), and 0.5 mmol of Rh(NO3)3 were mixed in 50 mL of water. The mixture was placed in a Teflon-lined stainless-steel autoclave and heated at 433 K for 42 h. The obtained precipitate was washed with hot water and water was dried at 343 K in an oven. The hydrothermal product (0.95 g) was mixed with an additional amount of Sr(OH)2·8H2O (95 mg) and heated at 1273 K for 10 h in air. The resulting product was washed with water and dried at 343 K.Modification of R-TiO2:N,F with a RuO2 cocatalyst
R-TiO2:N,F was modified with a RuO2 cocatalyst, which works as both reduction and oxidation sites,48 by a previously reported method.49 R-TiO2:N,F was dispersed in RuCl3 aqueous solution containing 0.5 wt% of Ru as to R-TiO2:N,F for 3 h. The material was collected by filtration and dried at 343 K overnight. The amount of the deposited Ru was 0.3 wt%, which was determined by inductively coupled optical emission spectroscopy (5100 VDV ICP-OES, Agilent Technologies) performed at the Okayama Materials Analysis Division, Technical Department, Tokyo Institute of Technology.General characterization
X-ray diffraction (XRD) patterns were recorded on a MiniFlex600 (Rigaku) powder diffractometer. Diffuse reflectance spectra (DRS) were obtained using a V-670 (JASCO) spectrometer equipped with an integration sphere using BaSO4 as a reference. Brunauer–Emmett–Teller (BET) surface areas were measured using a BELSORP mini (BEL Japan) at liquid nitrogen temperature (77 K). The surface morphology was observed using a scanning electron microscope (SEM; JSM-IT100LA, Jeol or SU9000, Hitachi) equipped with an energy-dispersive X-ray spectroscopy (EDX) apparatus. Amounts of nitrogen and fluorine were determined using elemental analysis (MICRO CORDER JM10, J-SCIENCE; HSU-20+ICS-1100, Yanaco) by the Suzukakedai Materials Analysis Division, Technical Department, Tokyo Institute of Technology. Surface atomic compositions were examined by means of X-ray photoelectron spectroscopy (XPS; ESCA-3400, Shimadzu).STEM observation
A titan cubed microscope (FEI) equipped with spherical aberration correctors (CEOS) was used for taking scanning transmission electron microscopy (STEM) images at an acceleration voltage of 300 kV. The convergence semiangle of the incident probe was 25 mrad, with an incident probe current of 20 pA. The detector collection semiangles were from 77 to 200 mrad for high-angle annular dark-field (HAADF) and 10 to 19 mrad for annular bright-field (ABF) imaging, respectively. The acquired images were processed for noise reduction using a Wiener filter implemented as FiltersPro plug-in (HREM Research) for DigitalMicrograph (Gatan).XAFS measurements
X-ray absorption fine structure (XAFS) measurements were performed for titanium and nitrogen. Ti–K edge XAFS were taken at the beamline 9A of the Photon Factory (High Energy Accelerator Research Organization, Tsukuba, Japan) under the approval of the Photon Factory Advisory Committee (proposal no. 2014S2-006). The X-ray energy was varied using a Si (111) double-crystal monochromator. The data were processed using Athena.50 N–K edge X-ray absorption near edge structure (XANES) spectra of the samples were measured at the BL7U stations of the Aichi Synchrotron Radiation Center (proposal no. 201704061), Japan. Data were recorded at room temperature in total electron yield mode, and the X-ray energy dependence of the N Auger electron yield was monitored. Considering the escape depth of the Auger electrons, the spectra probe the sample from the surface up to a few nanometres in depth.Electrochemical impedance measurements
R-TiO2:N,F electrodes were prepared by electrophoretic deposition on a conductive glass modified with a fluorine-doped tin oxide (FTO) layer. During the electrophoretic deposition procedure, a pair of FTO glasses were immersed parallel to each other in dispersions of R-TiO2:N,F powder (50 mg) in an acetone solution (45 mL) containing I2 (10 mg) at a distance of 1.8 cm, and connected to a DC power supply (GW Instek PSW 80-13.5). A bias of 50 V was applied between the FTO glasses for 15 s, resulting in photocatalyst-coated FTO glass. The coated area was fixed at 1.5 cm × 3.5 cm. The electrode was dried in a vacuum overnight.Impedance measurements were conducted using a potentiostat (AMETEK VersaSTAT3) in an aqueous 0.1 M Na2SO4 solution using the R-TiO2:N,F/FTO glass as a working electrode, an Ag/AgCl reference electrode (in saturated KCl aqueous solution) and Pt wire as a counter electrode. The solution was purged with argon for 15 min. The pH of the solution was adjusted by the addition of H2SO4 or NaOH as needed. Mott–Schottky plots were obtained at a frequency of 100 Hz.
Transient absorption spectroscopy
Measurements were conducted using a homemade spectrometer described previously.38 R-TiO2:N,F samples were fixed on a CaF2 plate at a density of 1.5 mg cm−2 and placed in an IR cell for measurements. The samples were photoexcited using 480 nm pulses from an Nd:YAG laser (Continuum Surelite I with Surelite OPO; duration, 6 ns; power, 5 mJ; repetition rate, 5–0.1 Hz), and transient absorptions in the visible to mid-IR region were measured under a nitrogen atmosphere. The time resolution of this spectrometer was limited to 1–2 μs by the bandwidth of the amplifier (Stanford Research Systems, SR560, 1 MHz).Photocatalytic reactions
Photocatalytic reactions were conducted in a Pyrex top-irradiation type reaction vessel connected to a closed circulation system. In a reaction vessel, 50 mg of photocatalyst was dispersed in 140 mL of aqueous solution containing 10 mM AgNO3, NaIO3 or FeCl3 that works as an electron acceptor. When using AgNO3 solution, 200 mg of La2O3 heated at 1273 K for 2 h before use was added as a buffer. The system was evacuated several times to remove air and then, a small amount of Ar gas was introduced prior to irradiation. Light was irradiated through a water filter, in combination with a suitable cutoff filter and a CM-1 cold mirror. Evolved gases were analysed using an on-line gas chromatograph (GC-2014s with a TCD detector and a MS-5A column, Ar carrier gas, Shimadzu). For the light source, a 300 W Xe lamp was used. The output current was set to 20 A unless otherwise stated. The solution was kept at room temperature by a flow of cooling water during the reaction.Z-Scheme water splitting was conducted in a similar manner. Ru/SrTiO3:Rh (25 mg) and RuO2/TiO2:N,F (50 mg) were suspended in an aqueous tris(2,2′-bipyridyl)cobalt(II) sulfate ([Co(bpy)3]2+, 0.5 mM) solution (120 mL). The cobalt complex was synthesized according to a previous method.51 After removing residual air from the reaction system, irradiation (420 < λ < 800 nm) was done in the same manner unless otherwise stated.
Results and discussion
X-ray diffraction, elemental analyses and electron microscopy
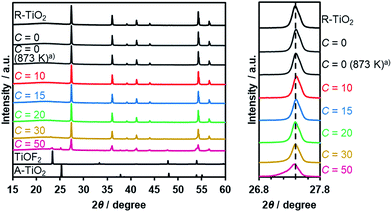
Thermal treatment of a physical mixture of R-TiO2 and (NH4)2TiF6 under a flow of NH3 gas resulted in the production of an orange/yellow powder, depending on the C value in the synthesis. The XRD patterns of the as-obtained samples are shown in Fig. 2, which indicated that they mainly consist of a R-TiO2 structure. More importantly, for samples prepared at higher C values (i.e., higher concentration of (NH4)2TiF6), diffraction peaks corresponding to R-TiO2 show shoulders at the lower angle side. This suggests the occurrence of partial incorporation of anions into the lattice of rutile TiO2, thereby changing the lattice spacing. This peak shift has been observed in nitrogen/fluorine-codoped anatase TiO2.17 Although excess addition of (NH4)2TiF6 resulted in the formation of impurity phases, samples prepared with C ≤ 20 did not show such distinct peaks, so they are considered to be essentially single-phase rutile. The impurity phases observed at higher C samples are presumably anion doped anatase TiO2- and TiOF2-like species, since they are reported to form during pyrolysis of (NH4)2TiF6 in the presence of an oxygen source.16 The fact that a lower concentration of (NH4)2TiF6 does not show peaks related to impurity phases also suggests that these impurity phases are caused by the excess presence of (NH4)2TiF6.To further confirm the presence of nitrogen and fluorine in the synthesized samples, elemental analysis was performed. As listed in Table 1, nitrogen and fluorine are detected for all samples nitrided with (NH4)2TiF6 (C ≥ 10). Furthermore, samples prepared with (NH4)2TiF6 showed higher nitrogen concentration compared to the samples prepared without (NH4)2TiF6, in which the concentration of nitrogen was below the detection limit (<0.1 wt%). This can be explained by the fact that fluorine can compensate the charge imbalance caused by nitrogen.16,17 Note that nitrogen-doping into anatase TiO2 generally occurs even at lower temperatures (<773 K),17 different from rutile TiO2 that is more nitridation-resistant. Therefore, codoping with fluorine was essential to achieve higher nitrogen concentration in rutile TiO2. We also confirmed by means of XPS that contamination of nickel species in the nitrided product from the nickel plate used in the synthesis was negligibly small (see Table S1†).
Scanning electron microscopy showed that the as-prepared R-TiO2:N,F samples consisted of 200–300 nm particles, irrespective of the C value (Fig. 3 and S1†). The specific surface areas determined by nitrogen adsorption at 77 K ranged from 5–7 m2 g−1.
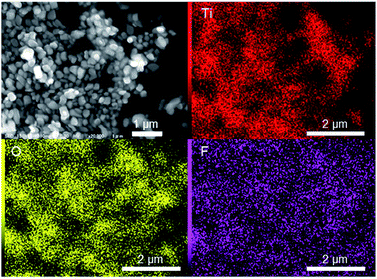
Distribution of nitrogen and fluorine in the R-TiO2:N,F samples was examined by energy-dispersive X-ray spectroscopy equipped on the SEM apparatus. As shown in Fig. 3, the elemental mapping data indicated that fluorine was uniformly dispersed in the C = 15 sample, although the distribution of nitrogen could not be visualized because of the overlap of the nitrogen signal with titanium. Similar results were obtained for C = 10 and 20 samples. For the C = 50 sample, however, fluorine-rich particles were observed, as shown in Fig. S2.† The Ti/O/F atomic ratio in the particle was determined to be close to TiOF2, which may support the idea that the impurity observed in XRD (Fig. 2) is TiOF2-like species. Although fluorine-rich particles were observed, other parts of C = 30 and 50 samples showed almost uniform distribution of fluorine. These results suggest that fluorine doping into TiO2 occurred uniformly in all of the samples, but with some segregation at higher C values.
STEM measurements were conducted for the C = 15 sample to obtain atomic-resolution images.52,53Fig. 4 shows HAADF and ABF-STEM images. As the signal intensity in HAADF imaging is approximately proportional to Z2 (where Z represents the atomic number),54 Ti atomic columns in the HAADF images can be seen as bright dots. Here the arrangement of the bright dots agreed well with atomic positions of Ti as expected from the crystal structure of rutile TiO2. It is also noted that the ABF images enabled us to visualize the arrangement of anions, which is again consistent with that in the rutile structure. The STEM observations thus confirmed the generation of the rutile-type structure of R-TiO2:N,F (C = 15), in good agreement with the result of XRD analysis (Fig. 2).
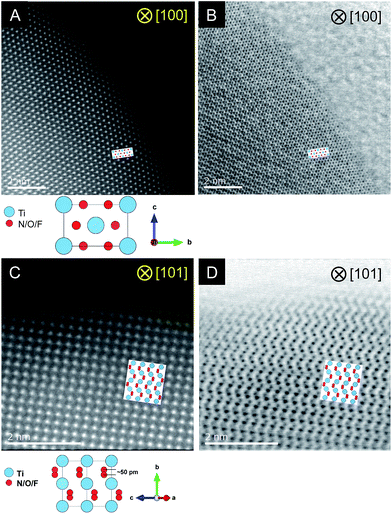 | ||
| Fig. 4 Results of STEM observations for R-TiO2:N,F (C = 15). (A and B) HAADF and ABF images taken along the [100] and (C, D) [101] direction. | ||
X-ray absorption spectroscopy
The incorporated nitrogen and fluorine into rutile TiO2 also influenced the electronic state of Ti. Fig. 5A shows the Ti–K edge XANES spectra of R-TiO2:N,F. The XANES spectra of R-TiO2:N,F samples resemble that of rutile TiO2, but different from those of Ti foil, (NH4)2TiF6 and anatase TiO2. This indicates that the local structure around Ti atoms in rutile TiO2 remains largely unchanged even after nitrogen/fluorine doping. However, a distinct change was observed in three pre-edge peaks (Fig. 5B); A1, A2 and A3 result from the hybridization of p and d orbitals of the local Ti absorber and surrounding neighbors.55 The Ti 3d orbital of R-TiO2:N,F, which has a TiA6 (A = anion) octahedral unit, is split into t2g and eg by a ligand field. The A1 peak arises from the quadrupole transition of 1s to t2g of the local Ti absorber. The A2 peak is overlapped by two components, the quadrupole transition of 1s to eg of the local Ti absorber and the dipole transition of 1s to t2g of the neighboring Ti atoms. The A3 peak is attributed to the dipole transition of 1s to eg of the neighboring Ti atoms. Among the three pre-edge peaks, there is an obvious increase in the A2 peak with increasing C values. In the displacive-type ferroelectricity of Ti oxides,56 and in the nano-size effect of TiO2,57 it has been reported that the A2 peak is increased by the local symmetry breaking around the Ti atom, because the Ti d/p mixing induced by the distortion of the TiA6 unit affects the quadrupole transition of 1s to eg in the A2 peak. Therefore, the observed increase in the A2 peak arises from the local distortion around the Ti site caused by nitrogen/fluorine doping. We also measured N–K edge XANES spectra (Fig. S3†). The result showed that irrespective of the C value, the nitrogen dopant in R-TiO2:N,F existed in the form of lattice N3−, somewhat similar to nitrogen-doped anatase TiO2 that exhibits relatively high activity.58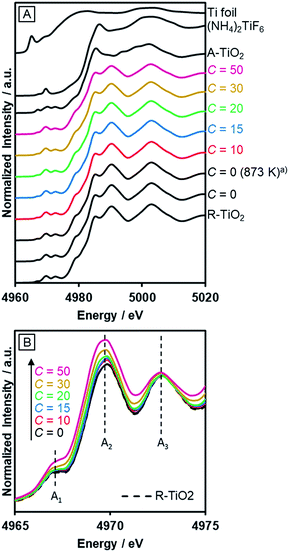 | ||
| Fig. 5 Ti–K edge XANES of R-TiO2:N,F obtained by nitriding the mixture of R-TiO2 and (NH4)2TiF6 with various concentrations of (NH4)2TiF6 at 773 K for 1 h. (a) Nitrided at 873 K. | ||
On the basis of structural characterization using XRD, elemental analyses, SEM/EDX, STEM and XAFS, it is reasonably concluded that the prepared samples are nitrogen/fluorine-codoped rutile TiO2, although the samples with higher C values tended to contain undesirable byproducts such as TiOF2.
Optical properties and band-edge positions of R-TiO2:N,F
The UV-Visible diffuse reflectance spectra of the R-TiO2:N,F samples are displayed in Fig. 6. Samples prepared using (NH4)2TiF6 (C ≥ 10) showed clear absorption in the visible region, in addition to the intrinsic band-gap absorption of rutile TiO2 at around 400 nm. By contrast, synthesis without (NH4)2TiF6 did not produce a material that shows such distinct visible light absorption, even though the temperature for the synthesis was increased to 873 K. The visible light absorption was more pronounced with increasing the C value. It has been reported that the increase in the nitrogen content enhances visible light absorption in nitrogen-doped oxide materials.16 Therefore, the more pronounced visible light absorption in the present R-TiO2:N,F samples is attributed to the increased nitrogen content, which is consistent with the result of elemental analysis (Table 1). It is noted that the absorption edge of R-TiO2:N,F is located at longer wavelengths than that reported for anatase R-TiO2:N,F.17 The absorption at longer wavelengths (λ > 600 nm) is usually assigned to reduced titanium species.17,18,59 A plausible reason for the increase of reduced titanium species in samples synthesized with higher (NH4)2TiF6 concentration is the reduction of TiO2 by (NH4)2TiF6.16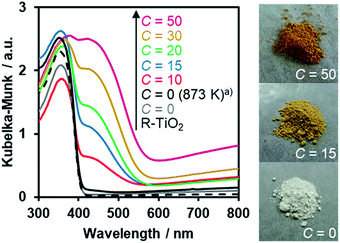 | ||
| Fig. 6 DRS of R-TiO2:N,F obtained by nitriding the mixture of R-TiO2 and (NH4)2TiF6 with various concentrations of (NH4)2TiF6 at 773 K for 1 h. (a) Nitrided at 873 K. | ||
In order to estimate the band potentials of R-TiO2:N,F, electrochemical impedance measurements were conducted for the C = 15 sample. As shown in Fig. S4,† Mott–Schottky plots had a positive slope corresponding to n-type band bending. Flat band potentials estimated from these plots were −0.41 V, −0.72 V and −0.93 V vs. Ag/AgCl at pH 4.3, 6.7 and 9.8, respectively. These values correspond to 0.03 V, −0.13 V, and −0.15 V vs. RHE, which is close to the reported value for rutile TiO2 at 0 V (vs. RHE).60 Of course, we confirmed that the R-TiO2:N,F sample is stable in the potential range examined (Fig. S5†).
The conduction band edge potential of n-type semiconductors depends on their conductivity and is located at 0.1–0.3 V negative of the flat band potential.61 In this study, the difference between the conduction band potential and the flat band potential was assumed to be 0.2 V, since the conductivity of the material is not clear. Based on this assumption and the band gap determined from DRS, the band potentials were determined as shown in Fig. 7. The valence band edge of R-TiO2:N,F is located at ca. 2.0 V vs. RHE, which is positive enough for water oxidation. This is 1.0 V above the reported rutile TiO2 valence band, which is located at 3.0 V vs. RHE.
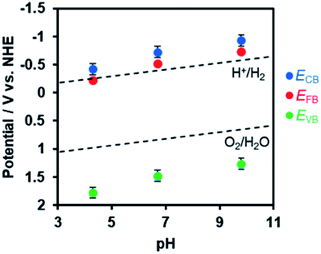 | ||
| Fig. 7 Dependence of conduction and valence band edge potentials for R-TiO2:N,F (C = 15) on the pH of electrolyte, as determined from Mott–Schottky plots (see Fig. S4†). ECB, EFB, and EVB are potentials of the conduction band minimum, the flat band, and the valence band maximum, respectively. | ||
Photocatalytic water oxidation
Water oxidation activity was first examined using AgNO3 as a sacrificial electron acceptor, in order to optimize the C value. As shown in Fig. 8, all of the synthesized materials produced O2 upon visible light irradiation. However, the activities of the R-TiO2:N,F samples differed with respect to the C value. The photocatalytic activity of R-TiO2:N,F increased abruptly with an increase in C, reaching maximum at C = 15, and then decreased gradually.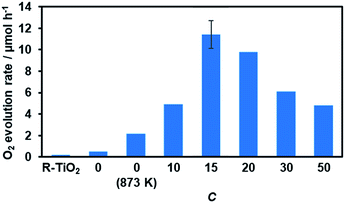 | ||
| Fig. 8 Photocatalytic activity of R-TiO2:N,F with different C values for O2 evolution under visible light irradiation in AgNO3 aqueous solution. Reaction conditions: catalyst, 50 mg; La2O3, 200 mg; 10 mM AgNO3 aqueous solution, 140 mL; light source, 300 W Xe lamp fitted with a CM-1 mirror and an L42 cutoff filter (λ > 420 nm). Average rate of O2 evolution for the first 30 minutes of irradiation. Full time course data are shown in Fig. S6.† | ||
The O2 evolution rate decreased with increasing the cutoff wavelength of the incident light (Fig. S7†), indicating that the reaction occurred through light absorption by R-TiO2:N,F. It is noteworthy that the present R-TiO2:N,F was capable of producing O2 even under >580 nm irradiation, different from anatase-type TiO2:N,F that had a shorter absorption edge than the rutile counterpart and did not work under the irradiation conditions.17
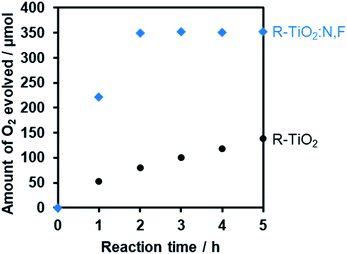
It should be noted that the most active R-TiO2:N,F (C = 15) showed a higher rate of O2 evolution than undoped rutile TiO2 even under >350 nm irradiation, where rutile TiO2 is able to undergo photoexcitation (Fig. 9). In most cases, the photocatalytic activities of doped TiO2 materials for water oxidation under UV irradiation are much lower than that of the undoped one, despite the fact that the doped materials have superior light absorption capability (i.e., visible light absorption).62–64 Therefore, the photocatalytic properties of the present R-TiO2:N,F appear unusual, and such properties have scarcely been reported in visible-light-responsive doped TiO2 materials for water oxidation. The apparent quantum yield of O2 evolution on the R-TiO2:N,F (C = 15) photocatalyst was measured to be ca. 6.4% at 365 nm, which was higher than that of R-TiO2 (ca. 5.4%).65
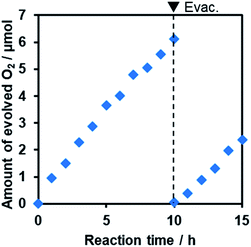
Furthermore, it was found that the optimized R-TiO2:N,F (C = 15) produced O2 from aqueous solutions containing a reversible electron acceptor (NaIO3), with the aid of a RuO2 cocatalyst (Fig. 10). The water oxidation reaction with NaIO3 is “non-sacrificial”, as the change in Gibbs energy during the reaction is positive.9 SEM observations indicated that the loaded RuO2 on the R-TiO2:N,F was in the form of nanoparticles of 10–20 nm in size (Fig. S8†), which can work as both reduction and oxidation sites.48 While the rate of O2 evolution decreased slightly at the initial stage of the reaction (<5 h), it became constant after 5 h, as shown in Fig. 10. No noticeable change in the XRD pattern and DRS could be identified before and after 15 h of reaction (Fig. S9†). O2 evolution was also observed when Fe3+ was used as an electron acceptor (Fig. S10†). These results indicate that R-TiO2:N,F works as a stable photocatalyst for water oxidation into O2 under visible light even in the presence of a reversible electron acceptor.
Z-Scheme water splitting
Finally, we applied the optimized R-TiO2:N,F modified with a RuO2 cocatalyst as the component of water oxidation in a Z-scheme water splitting system, in combination with a known H2 evolution photocatalyst of Ru/SrTiO3:Rh.51 The XRD pattern and UV-visible diffuse reflectance spectrum of the as-prepared SrTiO3:Rh are shown in Fig. S11.† We employed a [Co(bpy)3]3+/2+ couple as a shuttle redox mediator, which can mediate electron transfer from a suitable O2 evolution photocatalyst to the H2 evolution Ru/SrTiO3:Rh photocatalyst.51 In the Z-scheme system, forward reactions that occur on the Ru/SrTiO3:Rh surface are as follows:| 2H+ + 2e− → H2 | (1) |
| [Co(bpy)3]2+ + h+ → [Co(bpy)3]3+ | (2) |
On the other hand, the forward reactions on an O2 evolution photocatalyst are as follows:
| [Co(bpy)3]3+ + e− → [Co(bpy)3]2+ | (3) |
| 4OH− + 4h+ → O2 + 2H2O | (4) |
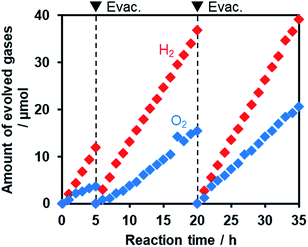
Fig. 11 shows that visible light irradiation of an aqueous [Co(bpy)3]2+ solution suspended with Ru/SrTiO3:Rh and RuO2/R-TiO2:N,F resulted in stoichiometric H2 and O2 evolution without noticeable degradation even after 35 h of irradiation. Here the total amount of reacted electrons during the reaction (159 μmol [=4 × evolved O2], see Fig. 11) was much greater than that of [Co(bpy)3]2+ (60 μmol), indicating that the [Co(bpy)3]3+/2+ couple was cycled during the reaction. This system was also workable even under simulated sunlight irradiation (Fig. S12†), giving a solar energy conversion efficiency of 0.02%.66 No reaction took place in the dark. Without using [Co(bpy)3]2+, the rates of H2 and O2 evolution were very low (Fig. S13†), an order of magnitude lower than those recorded with [Co(bpy)3]2+ (Fig. 11). This indicates that the contribution of Z-scheme water splitting through inter-particle electron transfer67 was very small under the present reaction conditions. Note that without a suitable O2 evolution photocatalyst, only H2 evolution was observed.51 Using RuO2/R-TiO2 instead of RuO2/R-TiO2:N,F, the O2 evolution activity decreased significantly (Fig. S14†). This is because RuO2/R-TiO2 cannot efficiently reduce [Co(bpy)3]3+ and oxidize water under visible light due to its large band gap (Fig. 6).
On the basis of these results, we concluded that Z-scheme overall water splitting into H2 and O2 is achieved using a mixture of Ru/SrTiO3:Rh and RuO2/R-TiO2:N,F in the presence of [Co(bpy)3]3+/2+ as a shuttle redox mediator, and that RuO2/R-TiO2:N,F achieved the functionality as an O2 evolution photocatalyst similar to oxide-based semiconductor photocatalysts (e.g., BiVO4).51 This is the first example of achieving visible-light-driven Z-scheme overall water splitting using a ternary mixed anion compound as the component of water oxidation.
Although H2 and O2 are simultaneously evolved from the same suspension in Z-scheme water splitting systems, Kudo et al. proposed a method to separately produce H2 and O2.51 They developed a two-compartment reactor, in which H2 and O2 evolution photocatalysts are separately suspended in each compartment divided by a membrane filter that is permeable to a redox mediator.
Time-resolved visible to mid-infrared absorption spectroscopy
To further understand the effect of nitrogen/fluorine codoping on the energy levels in the band gap, time-resolved visible to mid-infrared absorption spectroscopy measurements were conducted. As shown in Fig. 12, the shape of the transient absorption spectra depends on dopants as well as their concentration. This suggests that trap states in the band gap of rutile TiO2 are altered by the anion doping. R-TiO2:N,F (C = 0 (873 K)) shows absorption at around 7000 cm−1, which is attributable to deeply trapped electrons.24,41,42 Since oxygen vacancies have been reported as the most probable trap states in TiO2,68 the trap states can be ascribed to the oxygen vacancies caused by nitrogen doping. The absorption at around 7000 cm−1 tended to decrease upon fluorine codoping (i.e., with increasing C) up to C = 15. This strongly suggests that the density of the oxygen vacancies is reduced as a result of maintaining the charge balance (i.e. 2O2− ↔ N3− + F−). In addition, an absorption at around 18000 cm−1 increased sharply, which is assigned to trapped holes.44,45 Importantly, the existence of the signal from trapped holes suggests that the sample has reactive holes that can be used for water oxidation reactions.44,45 While the trapped hole signal was more pronounced upon further increase in C from 15 to 50, an absorption centred at around 5000 cm−1 increased. This suggests that new trap states were formed in samples with larger C values. It is also noted that a signal observed at 3000–1000 cm−1, which is due to shallowly trapped and/or free electrons,40,42 disappeared with increasing the C value from 15 to 50. This means that the lifetime of mobile electrons in R-TiO2:N,F was shortened upon excess increase in fluorine codoping. | ||
| Fig. 12 Transient absorption spectra of R-TiO2:N,F with different C values excited with 480 nm laser pulses under a N2 atmosphere. Transmittance and reflectance were measured below and above 6000 cm−1, respectively. Data for the C = 10 and 30 samples are shown in Fig. S15.† | ||
Factors affecting the water oxidation activity of R-TiO2:N,F
The result of photocatalytic reactions indicated that the water oxidation activity of R-TiO2:N,F depended on the C value in the synthesis. The increased activity with increasing C is most likely due to the difference in visible-light absorption. That is, more visible light absorption leads to an increase in the number of available photons to the water oxidation reaction. However, this could not account for the decrease in activity at higher C values.The time-resolved visible to mid-IR absorption measurements revealed that there is a difference in carrier dynamics of R-TiO2:N,F with different C values. The C = 15 sample, which showed the highest water oxidation activity, has a relatively low density of mid-gap states, compared to samples with smaller and larger C values. This feature would be responsible for the high photocatalytic activity of the C = 15 sample, in addition to the improved light absorption capability. The reason for the activity drop from C = 15 to 50 can be explained by the emergence of mid-gap states that deeply trap photogenerated charge carriers. Since deeply trapped carriers are usually less reactive,41,69,70 this is most likely the main cause of the decrease in the photocatalytic activity for larger C values. Thus, it can be concluded that enhancement of light absorption while suppressing the formation of trap states for photogenerated carriers is important for high photocatalytic activity.
Conclusions
Nitrogen/fluorine-codoped rutile TiO2 (R-TiO2:N,F) was successfully synthesized by nitriding a mixture of rutile TiO2 and (NH4)2TiF6. R-TiO2:N,F exhibited higher photocatalytic activity under visible light irradiation than only nitrogen-doped analogues. R-TiO2:N,F was also applicable to non-sacrificial water oxidation using IO3− or Fe3+ as a reversible electron acceptor when modified with a RuO2 cocatalyst. The RuO2-loaded R-TiO2:N,F was found to work as an O2 evolution photocatalyst for visible-light-driven Z-scheme water splitting, in combination with a Ru/SrTiO3:Rh H2 evolution photocatalyst and a [Co(bpy)3]3+/2+ shuttle redox mediator. Physicochemical analyses indicated that the key to achieve high water oxidation activity of the R-TiO2:N,F photocatalyst is appropriate adjustment of the N/F codoping level, which maximizes visible light absorption while minimizing the density of deep trap states in the band gap structure of R-TiO2:N,F.Recently, the codoping strategy with N3− and F− has been applied to non-TiO2 photocatalysts for tuning the band gap as well as exploring a new crystal phase.71–73 Although photocatalytic activities of such ternary mixed-anion compounds have been reported, no strategy to improve the photocatalytic activity based on photogenerated charge carrier dynamics had been established. Therefore, we believe that the results of the present study shed light on the development of N/O/F-based ternary mixed anion compounds, which exhibit high photocatalytic activity under visible light.
Author contributions
A. M. and K. M. designed the project and wrote a draft of the manuscript. A. M. conducted most of the experiments and analyses. J. J. M. V. and A. Y. performed transient absorption spectroscopy with A. M. S. Nishioka synthesized SrTiO3:Rh and modified it with a Ru cocatalyst. Y. K., M. Y., S. Nozawa and T. Y. performed XAFS measurements with A. M. S. Y. and K. K. conducted STEM observation. A. I. and A. K. synthesized the cobalt complex. All of the authors discussed and provided comments on the experiments and the manuscript during preparation.Conflicts of interest
There are no conflicts to declare.Acknowledgements
This work was supported by a Grant-in-Aid for Scientific Research on Innovative Area “Mixed Anion (project JP16H06438, JP16H06440, JP16H06441 and JP17H05491)” (JSPS). It was also partially supported by Grant-in-Aids for Young Scientists (A) (project JP16H06130) and for Challenging Research (Exploratory) (project JP17K19169). K. M. acknowledges the Noguchi Institute, The Hosokawa Powder Technology Foundation and the PRESTO/JST program “Chemical Conversion of Light Energy” for financial support. S. Nishioka acknowledges financial support from Grant-in-Aid for JSPS Fellows from JSPS. The authors also would like to express gratitude to Prof. Tsutomu Minegishi and Kazunari Domen (The University of Tokyo) for assistance with electrochemical impedance measurements.Notes and references
- H. Kageyama, K. Hayashi, K. Maeda, J. P. Attfield, Z. Hiroi, J. M. Rondinelli and K. R. Poeppelmeier, Nat. Commun., 2018, 9, 772 CrossRef PubMed.
- W. J. Youngblood, S.-H. A. Lee, K. Maeda and T. E. Mallouk, Acc. Chem. Res., 2009, 42, 1966 CrossRef PubMed.
- A. Kudo and Y. Miseki, Chem. Soc. Rev., 2009, 38, 253 RSC.
- K. Maeda, J. Photochem. Photobiol., C, 2011, 12, 237 CrossRef.
- R. Abe, Bull. Chem. Soc. Jpn., 2011, 84, 1000 CrossRef.
- Y. Wang, X. Wang and M. Antonietti, Angew. Chem., Int. Ed., 2012, 51, 68 CrossRef PubMed.
- F. E. Osterloh, Chem. Soc. Rev., 2013, 42, 2294 RSC.
- Y. Ma, X. Wang, Y. Jia, X. Chen, H. Han and C. Li, Chem. Rev., 2014, 114, 9987 CrossRef PubMed.
- K. Maeda and K. Domen, Bull. Chem. Soc. Jpn., 2016, 89, 627 CrossRef.
- K. Takanabe, ACS Catal., 2017, 7, 8006 CrossRef.
- S. Sato, T. Arai and T. Morikawa, Inorg. Chem., 2015, 54, 5105 CrossRef PubMed.
- R. Kuriki and K. Maeda, Phys. Chem. Chem. Phys., 2017, 19, 4938 RSC.
- K. Maeda, Prog. Solid State Chem., 2018 DOI:10.1016/j.progsolidstchem.2017.11.003.
- R. Asahi, T. Morikawa, T. Ohwaki, K. Aoki and Y. Taga, Science, 2001, 293, 269 CrossRef PubMed.
- T. Morikawa, R. Asahi, T. Ohwaki, K. Aoki and Y. Taga, Jpn. J. Appl. Phys., 2001, 40, L561 CrossRef.
- K. Nukumizu, J. Nunoshige, T. Takata, J. N. Kondo, M. Hara, H. Kobayashi and K. Domen, Chem. Lett., 2003, 32, 196 CrossRef.
- K. Maeda, Y. Shimodaira, B. Lee, K. Teramura, D. Lu, H. Kobayashi and K. Domen, J. Phys. Chem. C, 2007, 111, 18264 CrossRef.
- K. Maeda, B. Lee, D. Lu and K. Domen, Chem. Mater., 2009, 21, 2286 CrossRef.
- D. Li, H. Haneda, S. Hishita and N. Ohashi, Chem. Mater., 2005, 17, 2588 CrossRef.
- X. Zong, Z. Xing, H. Yu, Z. Chen, F. Tang, J. Zou, G. Q. Lu and L. Wang, Chem. Commun., 2011, 47, 11742 RSC.
- N. Kumar, U. Maitra, V. I. Hegde, U. V. Waghmare, A. Sundaresan and C. N. R. Rao, Inorg. Chem., 2013, 52, 10512 CrossRef PubMed.
- H. Liu and L. Gao, J. Am. Ceram. Soc., 2004, 87, 1582 CrossRef.
- S. Yin, K. Ihara, Y. Aita, M. Komatsu and T. Sato, J. Photochem. Photobiol., A, 2006, 179, 105 CrossRef.
- A. Nakada, S. Nishioka, J. J. M. Vequizo, K. Muraoka, T. Kanazawa, A. Yamakata, S. Nozawa, H. Kumagai, S. Adachi, O. Ishitani and K. Maeda, J. Mater. Chem. A, 2017, 5, 11710 RSC.
- R. Abe, K. Sayama and H. Sugihara, J. Phys. Chem. B, 2005, 109, 16052 CrossRef PubMed.
- O.-O. Prieto-Mahaney, N. Murakami, R. Abe and B. Ohtani, Chem. Lett., 2009, 38, 238 CrossRef.
- T. Ohno, D. Haga, K. Fujihara, K. Kaizaki and M. Matsumura, J. Phys. Chem. B, 1997, 101, 6415 CrossRef.
- K. Maeda, Chem. Commun., 2013, 49, 8404 RSC.
- K. Maeda, N. Murakami and T. Ohno, J. Phys. Chem. C, 2014, 118, 9093 CrossRef.
- R. Li, Y. Weng, X. Zhou, X. Wang, Y. Mi, R. Chong, H. Han and C. Li, Energy Environ. Sci., 2015, 8, 2377 RSC.
- K. Maeda, M. Higashi, D. Lu, R. Abe and K. Domen, J. Am. Chem. Soc., 2010, 132, 5858 CrossRef PubMed.
- K. Maeda, D. Lu and K. Domen, ACS Catal., 2013, 3, 1026 CrossRef.
- W. Zhao, K. Maeda, F. Zhang, T. Hisatomi and K. Domen, Phys. Chem. Chem. Phys., 2014, 16, 12051 RSC.
- K. Iwashina, A. Iwase, Y. H. Ng, R. Amal and A. Kudo, J. Am. Chem. Soc., 2015, 137, 604 CrossRef PubMed.
- D. A. H. Hanaor and C. C. Sorrell, J. Mater. Sci., 2011, 46, 855 CrossRef.
- J. C. Yu, J. Yu, W. Ho, Z. Jiang and L. Zhang, Chem. Mater., 2002, 14, 3808 CrossRef.
- H. Chen, A. Nambu, W. Wen, J. Graciani, Z. Zhong, J. C. Hanson, E. Fujita and J. A. Rodriguez, J. Phys. Chem. C, 2007, 111, 1366 CrossRef.
- A. Yamakata, T.-a. Ishibashi and H. Onishi, J. Phys. Chem. B, 2001, 105, 7258 CrossRef.
- A. Yamakata, M. Yoshida, J. Kubota, M. Osawa and K. Domen, J. Am. Chem. Soc., 2011, 133, 11351 CrossRef PubMed.
- K. Furuhashi, Q. Jia, A. Kudo and H. Onishi, J. Phys. Chem. C, 2013, 117, 19101 CrossRef.
- A. Yamakata, H. Yeilin, M. Kawaguchi, T. Hisatomi, J. Kubota, Y. Sakata and K. Domen, J. Photochem. Photobiol., A, 2015, 313, 168 CrossRef.
- A. Yamakata, J. J. M. Vequizo and H. Matsunaga, J. Phys. Chem. C, 2015, 119, 24538 CrossRef.
- F. Zhang, A. Yamakata, K. Maeda, Y. Moriya, T. Takata, J. Kubota, K. Teshima, S. Oishi and K. Domen, J. Am. Chem. Soc., 2012, 134, 8348 CrossRef PubMed.
- M. Hojamberdiev, K. Yubuta, J. J. M. Vequizo, A. Yamakata, S. Oishi, K. Domen and K. Teshima, Cryst. Growth Des., 2015, 15, 4663 CrossRef.
- M. Hojamberdiev, H. Wagata, K. Yubuta, K. Kawashima, J. J. M. Vequizo, A. Yamakata, S. Oishi, K. Domen and K. Teshima, Appl. Catal., B, 2016, 182, 626 CrossRef.
- H. Zhang, Y. Chen, R. Lu, R. Li and A. Yu, Phys. Chem. Chem. Phys., 2016, 18, 14904 RSC.
- R. Godin, Y. Wang, M. A. Zwijnenburg, J. Tang and J. R. Durrant, J. Am. Chem. Soc., 2017, 139, 5216 CrossRef PubMed.
- K. Maeda, R. Abe and K. Domen, J. Phys. Chem. C, 2011, 115, 3057 CrossRef.
- H. Suzuki, S. Nitta, O. Tomita, M. Higashi and R. Abe, ACS Catal., 2017, 7, 4336 CrossRef.
- B. Ravel and M. Newville, J. Synchrotron Radiat., 2005, 12, 537 CrossRef PubMed.
- Y. Sasaki, H. Kato and A. Kudo, J. Am. Chem. Soc., 2013, 135, 5441 CrossRef PubMed.
- K. Kimoto, T. Asaka, X. Yu, T. Nagai, Y. Matsui and K. Ishizuka, Ultramicroscopy, 2010, 110, 778 CrossRef PubMed.
- S. D. Findlay, N. Shibata, H. Sawada, E. Okunishi, Y. Kondo and Y. Ikuhara, Ultramicroscopy, 2010, 110, 903 CrossRef PubMed.
- S. J. Pennycook and D. E. Jesson, Ultramicroscopy, 1991, 37, 14 CrossRef.
- T. Uozumi, A. Kotani and J. C. Parlebas, J. Electron Spectrosc. Relat. Phenom., 2004, 137–140, 623 CrossRef.
- S. Nozawa, T. Iwazumi, H. Osawa and T. Uozumi, Appl. Phys. Express, 2013, 6, 061501 CrossRef.
- L. X. Chen, T. Rajh, Z. Wang and M. C. Thurnauer, J. Phys. Chem. B, 1997, 101, 10688 CrossRef.
- T. Yoshida, S. Niimi, M. Yamamoto, T. Nomoto and S. Yagi, J. Colloid Interface Sci., 2015, 447, 278 CrossRef PubMed.
- A. Kasahara, K. Nukumizu, G. Hitoki, T. Takata, J. N. Kondo, M. Hara, H. Kobayashi and K. Domen, J. Phys. Chem. A, 2002, 106, 6750 CrossRef.
- L. Kavan, M. Grätzel, S. E. Gilbert, C. Klemenz and H. J. Scheel, J. Am. Chem. Soc., 1996, 118, 6716 CrossRef.
- Y. Matsumoto, J. Solid State Chem., 1996, 126, 227 CrossRef.
- H. Kato and A. Kudo, J. Phys. Chem. B, 2002, 106, 5029 CrossRef.
- R. Niishiro, H. Kato and A. Kudo, Phys. Chem. Chem. Phys., 2005, 7, 2241 RSC.
- R. Niishiro, R. Konta, H. Kato, W.-J. Chun, K. Asakura and A. Kudo, J. Phys. Chem. C, 2007, 111, 17420 CrossRef.
- The apparent quantum yield (AQY) for the water oxidation reaction was measured using the same experimental setup, except for the addition of a band-pass filter (λ = 365 nm) and output current (10 A), and was estimated according to the equation (AQY (%) = (A × R/I) × 100), where A, R and I represent coefficients based on the reaction (O2 evolution, 4), the O2 evolution rate and the rate of incident photons, respectively. The total number of incident photons (ca. 0.88 mW) was measured using a calibrated silicon photodiode.
- Solar energy conversion efficiency (η) was calculated according to the following equation: η (%) = RHΔG0/(PS) × 100. Here RH, ΔG0, P, and S indicate the rate of hydrogen evolution (mol s−1) in Z-scheme water splitting, standard Gibbs energy of water (237.13 × 10³ J mol−1), the intensity of simulated sunlight (100 mW cm−2) from a solar simulator (Asahi Spectra, HAL-320) and irradiation area (16 cm2), respectively. The irradiance of the solar simulator almost (ca. 95%) corresponds to that of AM1.5G.
- Y. Sasaki, H. Nemoto, K. Saito and A. Kudo, J. Phys. Chem. C, 2009, 113, 17536 CrossRef.
- S. Ikeda, N. Sugiyama, S. Murakami, H. Kominami, Y. Kera, H. Noguchi, K. Uosaki, T. Torimoto and B. Ohtani, Phys. Chem. Chem. Phys., 2003, 5, 778 RSC.
- R. Kuriki, H. Matsunaga, T. Nakashima, K. Wada, A. Yamakata, O. Ishitani and K. Maeda, J. Am. Chem. Soc., 2016, 138, 5159 CrossRef PubMed.
- K. Wada, C. S. K. Ranasinghe, R. Kuriki, A. Yamakata, O. Ishitani and K. Maeda, ACS Appl. Mater. Interfaces, 2017, 9, 23869 CrossRef PubMed.
- N. Kumar, J. Pan, N. Aysha, U. V. Waghmare, A. Sundaresan and C. N. R. Rao, J. Phys.: Condens. Matter, 2013, 25, 345901 CrossRef PubMed.
- S. Yoon, A. E. Maegli, L. Karvonen, S. K. Matam, A. Shkabko, S. Riegg, T. Großmann, S. G. Ebbinghaus, S. Pokrant and A. Weidenkaff, J. Solid State Chem., 2013, 206, 226 CrossRef.
- S. R. Lingampalli, K. Manjunath, S. Shenoy, U. V. Waghmare and C. N. R. Rao, J. Am. Chem. Soc., 2016, 138, 8228 CrossRef PubMed.
Footnote |
| † Electronic supplementary information (ESI) available: Additional characterization and reaction data. See DOI: 10.1039/c8se00191j |
| This journal is © The Royal Society of Chemistry 2018 |

