Surfactant-assisted synthesis of CeO2 nanoparticles and their application in wastewater treatment†
He Lia, Guofeng Wanga, Fei Zhanga, Yun Caia, Yude Wang*a and Igor Djerdj*b
aDepartment of Materials Science & Engineering, Yunnan University, 650091 Kunming, People's Republic of China. E-mail: ydwang@ynu.edu.cn; Fax: +868715031410; Tel: +868715031124
bRuđer Bošković Institute, Bijenička 54, 10000 Zagreb, Croatia. E-mail: igor.djerdj@irb.hr; Fax: +38514680114; Tel: +38514680113
First published on 18th October 2012
Abstract
The stable and crystalline phase of pure nanostructured CeO2 with various morphologies has been directly synthesized using a cationic surfactant (cetyltrimethylammonium bromide, CTAB) and cerium chloride (CeCl3·6H2O) at room temperature by a new, simple, and green chemical precipitation method. Thorough structural characterization techniques, including X-ray diffraction (XRD), Fourier transform infrared spectroscopy (FTIR), scanning electron microscopy (SEM), transmission electron microscopy (TEM), electron diffraction, and Raman spectroscopy, were employed to examine the morphology and the microstructure of the final product. The catalytic activity of the nanostructured CeO2 was tested towards the degradation of the azo dye Congo red (CR). In order to obtain the optimum degradation conditions of CR, the performance of nanostructured CeO2 with various morphologies (spherical nanoparticles, nanorods, and mixture thereof) for the removal of CR from wastewater was tested under various concentrations of CR dye and quantities of the nanostructured CeO2. The results show an excellent removal capacity for the organic pollutant CR from wastewater, making it a promising candidate for wastewater treatment.
1. Introduction
As one of the most reactive rare earth oxides, with a wide bandgap (Eg = 3.15 eV for the coarse-grained material) and high dielectric constant (ε = 24.5),1 ceria (cerium oxide, CeO2) has attracted intense interest because it plays a vital role in emerging technologies for environmental and energy related applications, such as heterogeneous catalysis,2 solid oxide fuel cells (SOFCs),3 optics,4 polishing materials,5 gas sensors,6 UV light blockers,7 and especially in three-way catalysts (TWCs).8–10 Moreover, nanostructured CeO2 materials have received tremendous attention because of their unique properties which are derived from their size, shape, orientation, and high surface area. Nanostructured ceria with various morphologies (spherical nanoparticles and one-dimensional nanostructures) exhibits excellent physicochemical properties, resulting in its important applications as three-way catalysts in vehicle emission control systems, electrolyte materials for solid oxide fuel cells, ultraviolet-blocking materials, conversion catalysts, solar cells, gates for metal-oxide semiconductor devices, polishing materials, sunscreen cosmetics, etc.6,11–16 Motivated by both the possible applications and the excellent properties, the development of efficient methods to synthesize nanostructures with size/shape-control is one of the key trends in materials science nowadays. Over the past few years, the syntheses of size/shape-controlled CeO2 nanostructures, such as spherical nanoparticles, nanorods, nanowires, nanotubes, nanocubes, nanospheres, and hierarchical nanostructures, accompanied by the investigation of their size/shape-dependent properties, have been carried out by ourselves and other research groups.17–27 However, these methods have defects in the complex process and expensive raw materials, or require very stringent control of various processing parameters, together with a low production yield, high energy consumption, complicated manufacture, and a rather not environmentally friendly behaviour, the cost of the production is very high and it is difficult to be realized at an industrial scale. In order to overcome these problems, the simple, environmentally benign, and low cost routes to synthesize nanostructured CeO2 with different morphologies are still the key issues and challenge, especially in the viewpoints of “green chemistry”. Kluson and co-workers have successfully prepared titania nanosized particles by a surfactant-mediated sol–gel method from a non-ionic surfactant and titanium(IV) isopropoxide.28 The synthesis of cerium oxides has been achieved via surfactant-templated synthesis.29 In these methods, it is necessary for samples to withstand post-calcination at high temperature, so that the crystalline CeO2 can be obtained. Our method of the controllable synthesis of CeO2 nanostructures is based on the cationic surfactant CTAB and simple chemical reagents hydrous cerium chloride (CeCl3·6H2O and NH3·H2O) at room temperature by controlling the molar ratio of CTAB to cerium species and the aging times in an aqueous solution. It is a low energy consuming and environmentally benign green process because the post-calcinations or thermal treatments at high temperature are avoided. The cations (cerium) are assembled within the template of the surfactant micelle in an aqueous solution. The surfactant not only provides a favorable site for the growth of the particulate assemblies, it also influences the morphology and the formation process, including nucleation, growth, coagulation and flocculation.30As an inexpensive and relatively harmless material, CeO2 presents several characteristics that could be potentially advantageous for catalytic applications. It has been investigated under UV irradiation concerning water splitting for the generation of hydrogen gas,31,32 and photodegradation of toluene in the gas phase.33 Many researchers have reported that the CeO2 nanostructures exhibit catalytic behaviors under photoirradiation to degrade dyes.34–37 Generally, CeO2 nanostructures have apparent advantages in enhancing the catalytic activities because such structures not only possess a high surface area but can also effectively transport reactant molecules to the active sites.38,39 The removal of gaseous noxious compounds from automobile exhausts is an inevitable component and the main environmental application of ceria.40 Recently, ceria could be potentially used as a near-UV-Vis range irradiation or visible light responsive catalyst to decompose organics in the aqueous phase.19,41–43 However, upon comparison with the plentiful nanostructures synthesized with different methods, it appears that there is little work that has been carried out to investigate their catalytic behavior so far. With this aim, in the present work we study the catalytic degradation of organic dyes utilizing CeO2 nanostructures prepared from an aqueous solution at room temperature.
Organic dye removal from wastewater has attracted considerable attention because of their long-term environmental toxicity and short-term public health damage.41,44 Congo red [1-naphthalene sulfonic acid, 3,30-(4,40-biphenylenebis(azo))bis(4-amino-)disodium salt] with two azo bond (–N![[double bond, length as m-dash]](https://www.rsc.org/images/entities/char_e001.gif) N–) chromophores in its molecular structure is a well-known class of azo dyes that are of high toxicity and are even carcinogenic to animals and humans, and they are not readily degradable. CR dyes from the textile and dye industries are causing grave environmental problems and are banned in many countries because of health concerns. However, the traditional physical, chemical and biological means of wastewater treatment often have little degradation effect on this anionic secondary diazo dye pollutant due to their complex aromatic structures, which provide them with physicochemical, thermal and optical stability.45,46 Compared with the conventional wastewater treatment means, degradation has been proved to be effective for this kind of pollution due to its strong destructive power to mineralize the pollutants into CO2 and H2O. The present investigation assesses the applicability of materials for the degradation and removal of the CR from wastewater, such as TiO2,47–50 zeolite,51 Ni(OH)3 and NiO,52 Fe2O3,53 CeO2,19,45 carbon nanotubles,54 CdS,55 Zn1−xCuxS and Zn1−xNixS,56 ZnO,57 WO3–TiO2/activated carbon,46 SnO2–ZnO,58 and waste materials (bottom ash and deoiled soya).59 However, their practical uses have been constrained by their low catalytic activity under solar light, short-term stability against photo and chemical corrosion as well as potential toxicity. To our knowledge, the catalytic activity of CeO2 nanostructures of various morphologies, used as a potential catalytic material for the degradation and removal of the CR from wastewater has rarely been reported. In this paper, CR dye was selected as a model dye pollutant to evaluate the degradation activity of the CeO2 nanostructures. The obtained data are discussed in connection with the differences in the activity of the CeO2 nanostructures.
N–) chromophores in its molecular structure is a well-known class of azo dyes that are of high toxicity and are even carcinogenic to animals and humans, and they are not readily degradable. CR dyes from the textile and dye industries are causing grave environmental problems and are banned in many countries because of health concerns. However, the traditional physical, chemical and biological means of wastewater treatment often have little degradation effect on this anionic secondary diazo dye pollutant due to their complex aromatic structures, which provide them with physicochemical, thermal and optical stability.45,46 Compared with the conventional wastewater treatment means, degradation has been proved to be effective for this kind of pollution due to its strong destructive power to mineralize the pollutants into CO2 and H2O. The present investigation assesses the applicability of materials for the degradation and removal of the CR from wastewater, such as TiO2,47–50 zeolite,51 Ni(OH)3 and NiO,52 Fe2O3,53 CeO2,19,45 carbon nanotubles,54 CdS,55 Zn1−xCuxS and Zn1−xNixS,56 ZnO,57 WO3–TiO2/activated carbon,46 SnO2–ZnO,58 and waste materials (bottom ash and deoiled soya).59 However, their practical uses have been constrained by their low catalytic activity under solar light, short-term stability against photo and chemical corrosion as well as potential toxicity. To our knowledge, the catalytic activity of CeO2 nanostructures of various morphologies, used as a potential catalytic material for the degradation and removal of the CR from wastewater has rarely been reported. In this paper, CR dye was selected as a model dye pollutant to evaluate the degradation activity of the CeO2 nanostructures. The obtained data are discussed in connection with the differences in the activity of the CeO2 nanostructures.
2. Experimental
2.1 Synthesis of CeO2 nanostructures
All the chemical reagents used in the experiments were obtained from commercial sources as guaranteed-grade reagents and used without further purification. The purity of CTAB was 99% and of the inorganic precursors was not lower than 99%.The synthesis was based on the use of the cationic surfactant (CTAB) and the simple chemical materials (cerium chloride CeCl3 and NH3·H2O) as inorganic precursors. The reaction was performed at room temperature. The starting compositions and synthesis conditions are presented in Table 1. In a typical process of CeO2 nanoparticle preparation, the synthetic procedures were as follows: the CTAB was mixed with distilled deionized water under stirring until a homogeneous solution (0.1 M) was obtained. The solution of diluted NH3·H2O (25 wt% solution, 10 mL) was then added into the CTAB solution under vigorous stirring. When the mixing solution became homogeneous, a solution of CeCl3 (0.1 M) was added, also under stirring condition. After stirring for 2 h, the products were aged at ambient temperature for 30 min. The resulting material was filtered, washed with distilled water to remove surfactant, and then dried at ambient temperature.
CTAB![[thin space (1/6-em)]](https://www.rsc.org/images/entities/char_2009.gif) : :![[thin space (1/6-em)]](https://www.rsc.org/images/entities/char_2009.gif) Ce3+ (molar ratio) Ce3+ (molar ratio) | Aging time | Observed morphology | Lattice parametera (Å) | Average crystallite sizeb (nm) | SBETc (m2 g−1) |
|---|---|---|---|---|---|
| a The lattice parameter was extracted using the Rietveld refinement.b The average crystallite size (D) of the as-prepared CeO2 nanoparticles was calculated from the peak broadening using the Rietveld method.c BET specific surface area. | |||||
1.0![[thin space (1/6-em)]](https://www.rsc.org/images/entities/char_2009.gif) : :![[thin space (1/6-em)]](https://www.rsc.org/images/entities/char_2009.gif) 1.0 1.0 | 30 min | Spherical nanoparticles | 5.413(1) | 5.0 | 127.8 |
1.5![[thin space (1/6-em)]](https://www.rsc.org/images/entities/char_2009.gif) : :![[thin space (1/6-em)]](https://www.rsc.org/images/entities/char_2009.gif) 1.0 1.0 | 10 days | Nanorods | 5.414(1) | 4.3 | 132.9 |
1.0![[thin space (1/6-em)]](https://www.rsc.org/images/entities/char_2009.gif) : :![[thin space (1/6-em)]](https://www.rsc.org/images/entities/char_2009.gif) 1.0 1.0 | 10 days | Spherical nanoparticles and nanorods | 5.414(1) | 4.4 | 121.1 |
2.2 Characterization of the CeO2 nanostructures
Powder X-ray diffraction (XRD) data was recorded with a Rigaku D/MAX-3B powder diffractometer using the copper target and Kα radiation (λ = 1.54056 Å). The sample was scanned from 20° to 90° (2θ) in steps of 0.02°. The Rietveld refinement of the powder XRD patterns was performed using the programme FULLPROF.60 The profile function was chosen to be the modified Thompson–Cox–Hastings pseudo-Voigt (TCH pV), allowing the straightforward size analysis. In this approach, we assumed that the line-broadening of the deconvoluted profile occurred due to the small crystallite size only. The values of half-width parameters U, V, W, and X were kept constant at instrumental values determined by using the standard sample LaB6. Fourier transform infrared (FT-IR) spectroscopy was performed on a Perkin-Elmer 2000 FT-IR spectrometer. Scanning electron microscopy (SEM) images of the final particles were obtained with an XL30ESEM-TMP microscope. The samples for SEM were prepared by dispersing the final powders in the conductive glue; this dispersion was then sprayed with carbon. Transmission electron microscopy (TEM) measurements were performed on a Zeiss EM 912 Ω instrument at an acceleration voltage of 120 kV, while high-resolution transmission electron microscopy (HRTEM) characterization was done using a JEOL JEM-2010 Electron Microscope (with an acceleration voltage of 200 kV). The samples for TEM were prepared by dispersing the final samples in distilled deionized water; this dispersion was then dropped on the carbon–copper grids coated by an amorphous carbon film. N2 adsorption–desorption isotherms at 77 K were recorded on a Micromeritics ASAP 2010 automated sorption analyzer. The samples were outgassed at 150 °C for 20 h before sorption analysis. UV-Vis measurements were made with a UV-2401PC spectrophotometer.2.3 Water treatment with CeO2 nanostructures
CR (C32H22N6Na2O6S2, molecular weight: 696.67 g mol−1, from Guangzhou Reagent Corporation, China) was used as a model dye to investigate the catalytic activity of the CeO2 nanostructures. The degradation was carried out in an aqueous solution at ambient temperature using CeO2 nanostructures as the catalyst. The amount of CeO2 nanostructures contained in the dye solution, initial CR concentration and irradiation time were varied to determine the optimum working conditions for CR degradation. In a typical degradation experiment, the proper amounts (20, 50, 100, 150, 200, and 250 mg) of the CeO2 nanostructures were added to 50 mL of CR aqueous solution (CRS) with different concentrations (10, 30, 50, 80, and 100 mg L−1) in a quartz beaker under stirring. 4 mL of the dispersion was extracted and subsequently centrifuged to separate CeO2 nanostructures and dye solutions at 3500 rpm for 10 min at different intervals. The changes of the concentration of the centrifuged solutions were recorded by a UV-2401PC spectrophotometer. The concentration (C) of the centrifuged solution and the initial concentration (C0) of the CR solution were monitored immediately by measuring the absorbance of the supernatant at 498 nm using a spectrophotometer (model no. JH722N), and was finally analyzed by a UV-2401PC spectrophotometer. The degradation rate was calculated as C/C0. CeO2 powders were thoroughly washed, dried and then used as the recycled catalysts to degrade new CR solutions. The degradation products formed at the end of the degradation reaction process were analyzed by liquid chromatography–mass spectrometry (LC–MS) measurements performed using Agilent G1969A (Agilent Technologies Inc. USA) with electrospray ionization mass spectrometry.3. Results and discussion
3.1 Physicochemical characterization
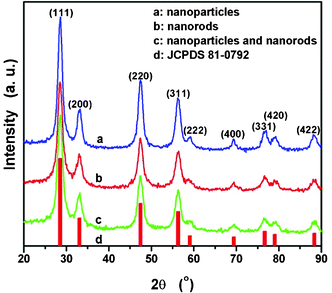 | ||
| Fig. 1 XRD patterns of as-synthesized CeO2 nanostructures. | ||
Fourier transform infrared spectroscopy (FT-IR) was usually employed as an additional probe to evidence the presence of OH groups as well as other organic and inorganic species. The fabricated CeO2 nanostructured materials were characterized by the spectroscopic techniques in the range 4000–400 cm−1. The FT-IR spectra of as-synthesized CeO2 nanostructures and CTAB are shown in Fig. 2. Some bands are observed in the region 2800–3020 cm−1, and are attributed to CTAB surfactant.62,63 The asymmetric (2918.7 cm−1) and symmetric (2846.4 cm−1) stretching vibrations of C–CH2 and C–CH3 asymmetric stretching and N–CH3 symmetric stretching vibrations (3011.6 cm−1) are assigned to the solid surfactant CTAB. The sharp bands in the region of 1450–1500 cm−1 are attributed to the deformation of –CH2– and –CH363 of the incorporated surfactants. Some bands attributed to the CTAB surfactant are not observed in the region 2800–3020 cm−1 from Fig. 2(b), 2(c), and 2(d) for the samples of as-synthesized CeO2 nanostructures, respectively. The absence of CH2 vibrations at 2846.4 cm−1 and 2918.7 cm−1 indicates that the surfactant is not present in the as-synthesized samples.64 The bands at 3381.8 cm−1 and 1623.1 cm−1 can be attributed to the O–H vibration of adsorbed water on the sample surface.65 In addition to the bands in the 850–1600 and 2800–3000 cm−1 regions, the band due to the stretching frequency of Ce–O can be seen below 450 cm−1, which confirms the formation of CeO2. The peak positions and peak shapes of the FT-IR spectra are consistent with the standard spectrum of CeO2 Sadler (SDBS 40343). The FT-IR absorption bands at about 1558, 1373, 1046, and 877 cm−1, are similar to those of commercial CeO2 powders66 and CeO2 nanoparticles.67
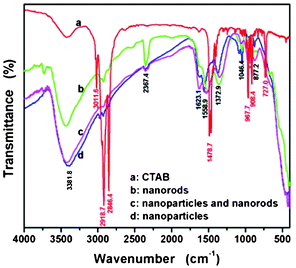 | ||
| Fig. 2 (a)–(d) FTIR spectra of the as-synthesized CeO2 nanostructures. | ||
The morphology of the CeO2 nanostructured products were characterized by scanning electron microscopy (SEM). SEM images of the examined samples are shown in Fig. S1, ESI†. As shown in Fig. S1(a), ESI†, the SEM image revealed various particle sizes of the as-prepared sample. The large particles are composed of small crystallites and show particle aggregates of irregular shapes and large sizes (1–6 μm). Fig. S1(b), ESI† gives the image of another CeO2 sample, in which nanorods are seen to be up to 12 nm in diameter and 200 nm in length. Fig. S1(c), ESI† shows two morphologies of the particles with irregular shapes and the nanorods with lengths of 100–150 nm, which indicates that the as-synthesized CeO2 nanostructure is a mixture of nanoparticles and nanorods.
The morphology and the structure of the final products were further examined with transmission electron microscopy (TEM) and high-resolution TEM (HRTEM). The TEM overview image in Fig. 3(a) displays nanoparticles that are uniform in morphology and narrow in size distribution. To obtain further insight into the local crystallinity of the CeO2 nanoparticles, a high-resolution image was recorded. The HRTEM micrograph shows well-developed lattice fringes, which are randomly oriented with respect to each other (Fig. 3(b)). Fig. 3(c) and 3(d) show the typical TEM and HRTEM images of the CeO2 nanorods. TEM observation revealed that they all exhibit one-dimensional rod-like nanostructures with poor dispersion. The synthesized CeO2 nanostructures display the uniform morphology of nanorods with 10–12 nm in width and 100–200 nm in length. That is to say, the aspect ratio of these nanorods is about 8–15. more detailed HRTEM image of CeO2 nanorods is displayed in Fig. S2, ESI†. It reveals individual nanorods with well-developed lattice fringes, whose spacings are consistent with those of bulk CeO2. The analyzed single nanorod from the upper right corner in Fig. S2, ESI† is recorded with the electron beam parallel to the [−111] axis, deduced from the lattice fringes and the corresponding fast fourier transform (FFT) pattern. Moreover, on the basis of the identified spots in the FFT pattern, the growth direction of the nanorod is found to be [1−12] direction. The morphology of the CeO2 nanoparticles and nanorods is displayed in Fig. 3(e) and 3(f), where the nanoparticles have well-distributed size and good dispersion, and the nanorods are 12–14 nm in width and 100–150 nm in length and have an aspect ratio of 7–12.
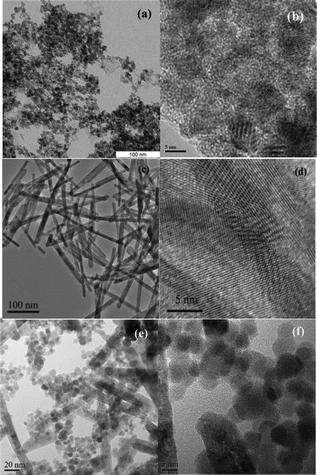 | ||
| Fig. 3 TEM and HRTEM images of the nanostructured CeO2 nanoparticles (a–b), nanorods (c–d), and mixture thereof (e–f). | ||
The experimental synthetic conditions and the final morphologies of the as-synthesized CeO2 nanostructures are presented in Table 1. It is found that the CTAB/Ce3+ value and the aging time have a great influence on the morphologies of the final products.
Template-based systems are frequently used to control nucleation and growth of inorganic particles. In this approach, the template simply serves as a scaffold in which different materials are generated in situ and are shaped into a nanostructure with its morphology complementary to that of the template. When the solutions (CTAB and NH3·H2O mixed solution, and CeCl3·6H2O solution) were mixed, the precipitate appeared instantly and gradually increased with the addition of the CeCl3·6H2O solution, which indicated that the reaction occurred. Under the action of the modulation preparation, cerium salts and precursors form CeO2 nanoparticles through nucleation and growth in a relatively short time. In the process of aging, the nanoparticles stack with each other and grow directionally. For the lower ratio of CTAB and Ce3+ (CTAB![[thin space (1/6-em)]](https://www.rsc.org/images/entities/char_2009.gif) :
:![[thin space (1/6-em)]](https://www.rsc.org/images/entities/char_2009.gif) Ce3+ < 1.5
Ce3+ < 1.5![[thin space (1/6-em)]](https://www.rsc.org/images/entities/char_2009.gif) :
:![[thin space (1/6-em)]](https://www.rsc.org/images/entities/char_2009.gif) 1.0), two morphologies of CeO2 nanoparticles and nanorods can be formed; while the higher ratio of CTAB and Ce3+ (CTAB
1.0), two morphologies of CeO2 nanoparticles and nanorods can be formed; while the higher ratio of CTAB and Ce3+ (CTAB![[thin space (1/6-em)]](https://www.rsc.org/images/entities/char_2009.gif) :
:![[thin space (1/6-em)]](https://www.rsc.org/images/entities/char_2009.gif) Ce3+ ≥ 15.
Ce3+ ≥ 15.![[thin space (1/6-em)]](https://www.rsc.org/images/entities/char_2009.gif) :
:![[thin space (1/6-em)]](https://www.rsc.org/images/entities/char_2009.gif) 1), CeO2 nanorods can be obtained. A similar finding was reported elsewhere.68 The overall assembly behaviors of the CeO2 nanostructures at room temperature could be illustrated, as in Fig. 4, which reveals the schematic diagram of the formation of CeO2 nanostructures. Similar formation mechanisms were reported and the nanostructures in relatively large quantities can be synthesized by templating against rod-like or sphere micelles assembled from the surfactant.69–71
1), CeO2 nanorods can be obtained. A similar finding was reported elsewhere.68 The overall assembly behaviors of the CeO2 nanostructures at room temperature could be illustrated, as in Fig. 4, which reveals the schematic diagram of the formation of CeO2 nanostructures. Similar formation mechanisms were reported and the nanostructures in relatively large quantities can be synthesized by templating against rod-like or sphere micelles assembled from the surfactant.69–71
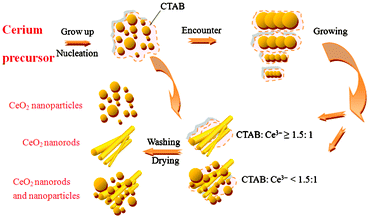 | ||
| Fig. 4 Schematic diagram of the proposed mechanism for the formation of the CeO2 nanostructures at room temperature. | ||
3.2 The degradation of CR with different CeO2 nanostructures
In general, the catalytic activity is tightly related to the structure of the catalyst, such as small size and high surface area.75 In order to test the catalytic performance of these three cerium samples, the degradation of CR was carried out under visible light illumination at wavelengths longer than 420 nm in an aqueous CeO2 dispersion. In order to compare the degradation effects, varying different parameters, such as catalyst amount, initial concentration of CR solution and treatment time, were studied. UV-visible absorbance spectra of the CR solutions, as a function of operation time, are depicted in Fig. 5. As shown in Fig. 5, the results of the degradation experiments under various conditions showed that CR can be effectively removed by the CeO2 nanostructures. Rapid removal of CR was observed at the beginning of the reaction time. Following the rapid removal, the removal rate decreased, and an apparent equilibrium was reached after 5–120 min depending on the CeO2 nanostructures. When 250 mg of CeO2 nanoparticles was added to 50 mL of CR solution, with an initial concentration of 100 mg L−1, the CeO2 nanoparticles removed about 90% of the CR at room temperature without any additives, as shown in Fig. 5(a). This is a removal capacity of 45 mg CR per mg CeO2. Comparing Fig. 5(a), (b), and (c), after 10 min of reaction, the removal efficiency of 20 mg CeO2 nanorods reaches above 97%, which is much higher than that of the CeO2 nanoparticles and CeO2 mixture of nanoparticles and nanorods. The CeO2 nanorods show the highest degradation efficiency and capacity (122 mg CR per g CeO2 nanorods) for CR dye in aqueous solution. On the other hand, it is evident that the treatment time has a significant influence on the degradation process, considering that other parameters from Fig. 5 are constant.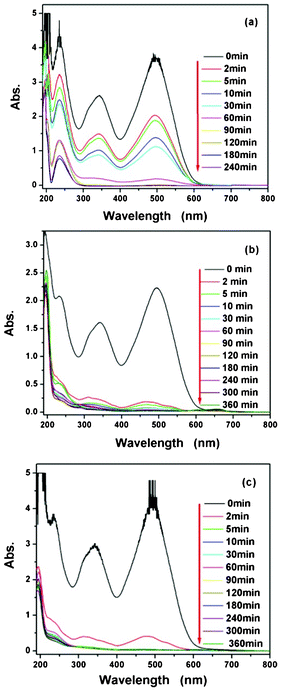 | ||
| Fig. 5 UV-Vis absorption spectra of CR solutions (CRS) before and after treatment with CeO2 at different time intervals: (a) CRS (100 mg L−1, 50 mL) in the presence of 250 mg of CeO2 nanoparticles, (b) CRS (50 mg L−1, 50 mL) in the presence of 20 mg of CeO2 nanorods, and (c) CRS (80 mg L−1, 50 mL) in the presence of 150 mg of the CeO2 mixture of nanoparticles and nanorods. | ||
The continuous UV-Vis spectra of the centrifuged solution after catalytic reactions at the different intervals were used to record and contrast with that of the initial CR solution, which further clarified the removal performance and mechanism of CR. As seen in Fig. 5, the absorption spectra of the original CR solutions are characterized by one main band in the visible region with its maximum absorption at 493 nm, corresponding to the azo bonds of the CR molecule, which is responsible for the dark red color of the aromatic rings pertaining to the azo groups.76,77 The other two bands in the ultraviolet region, located at 236 nm and 343 nm, respectively, are attributed to the benzene ring and naphthalene ring structure.78 The characteristic absorption peaks of CR at 343 nm and 493 nm was chosen as the parameter that was monitored. As shown in Fig. 5, the degradation rate (C/C0) increased with respect to the treatment time, and correspondingly, the amplitude of the peak decreased with respect to time. A continuous decrease in the absorbance peaks at 493 nm and 343 nm in Fig. 5 suggests that the azo bonds and the naphthyl rings are destroyed to form phenyl derivatives. From Fig. 5, one can see that the main absorption peaks (343 nm and 493 nm) of the dye in the UV-Vis region have basically disappeared after 10–60 min. UV light illumination of the aqueous CR solution in the presence of the as-synthesized CeO2 nanostructures causes the absorption bands of the CR dye in the visible region to decrease with time and finally to disappear, indicating the destruction of its chromophoric structure in the vicinity of the azo-linkage.
That is, the dye is surely degraded by the catalytic action. Furthermore, the decay of the absorbance at 236 nm can be considered as evidence of aromatic fragment degradation in the dye molecule and its intermediates.55
The color of the CR aqueous solutions was bleached when the CeO2 nanostructures were used to degrade the CRS and the absorption of the solution at 493 nm was close to zero. Thus, the absorption of the CR aqueous solution at 493 nm could represent the degradation degree of CR. As it can be observed, the disappearance of the visible band is accompanied by total discoloration of the solutions from Fig. 6, which also displays the degradation process of CR. It is clearly seen that the cardinal red color of the starting solution gradually disappears along with the increase in the degradation time. The color of the CR completely disappeared after 5 min when using the CeO2 nanorods, while when using the CeO2 nanoparticles this took 90 min, suggesting that the CeO2 nanorods have the better performance compared to CeO2 nanoparticles and the CeO2 mixture of nanoparticles and nanorods. The decay of the CR solutions color may be compared with the degradation performance shown in Fig. 5.
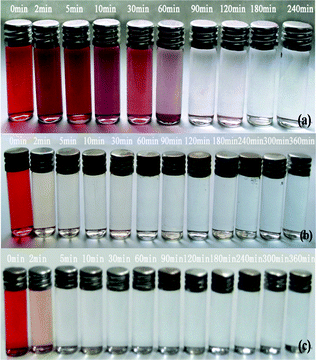 | ||
| Fig. 6 Photographs of CR solutions (CRS) before and after treatment with CeO2 at different time intervals: (a) CRS (100 mg L−1, 50 mL) in the presence of 250 mg of CeO2 nanoparticles, (b) CRS (50 mg L−1, 50 mL) in the presence of 20 mg of CeO2 nanorods, and (c) CRS (80 mg L−1, 50 mL) in the presence of 150 mg of the CeO2 mixture of nanoparticles and nanorods. | ||
3.3 The effect of initial CRS concentration on the degradation
Heterogeneous degradation is a complicated process, involving the function of many factors and even their mutual effect. To simplify the process, only the kinetic analysis under the different CRS initial concentrations and catalyst amounts were studied in this work. The kinetics of the aqueous degradation process plays an important role in assessing the efficiency and feasibility of treating dye contaminated wastewater. The kinetics of CR degradation reactions on the catalyst with typical photolytic processes has been described with models based on chemical and photochemical reactions,79 which can be expressed by the Langmuir–Hinshelwood (L–H) model.80,81 For the lower initial concentration of CR dye, the reaction rate can be expressed as:82 | (1) |
 versus t will yield a slope of −k. The the effect of the initial CRS concentration on the degradation kinetics was studied by varying the concentrations from 10 to 100 mg L−1 in the presence of 100 mg CeO2 nanoparticles, 20 mg CeO2 nanorods, and 150 mg CeO2 mixture of nanoparticles and nanorods under visible light, respectively. Fig. 7 shows the degradation efficiencies of CR under the different initial concentrations versus time catalyzed by the different CeO2 nanostructures, respectively. They show that the degradation rate depends on the initial concentration of CR. The degradation rate constants at different initial concentrations of CR were determined from the slope of the plots, in accordance to the proposed kinetic model. As seen from Fig. 7, the degradation rate constants decrease with the increase of the initial concentration of CR dye. The results show that the degradation rate depends on the initial concentration of CR solutions, and it is found that CR degradation basically obeys the pseudo-first-order kinetic expression, as can be seen from Fig. 7(a), (b) and (c). The k values and corresponding regression coefficients (the square of the relative correlative coefficient (R2) of the experimental results) can be found, too. The coefficient values, R2, of the experimental runs are more than 0.83, indicating that the degradation of CR dye by the CeO2 nanostructures satisfactory followed apparent-first-order kinetics. The effect of initial CRS concentration on the degradation kinetics is compared from a plot of 1/k versus different initial dye concentrations in the presence of the different CeO2 nanostructures as shown in Fig. 7(d). The drastic decrease in the degradation activity with CRS concentration is ascribed to the increase in the local concentration of CR on the CeO2 surface, leading to the formation of higher order aggregates owing to hydrophobic interactions between the aromatic rings.57 The degradation effect in the presence of CeO2 nanorods is better than that of CeO2 nanoparticles and the CeO2 mixture of nanoparticles and nanorods throughout all experimental concentration ranges from Fig. 7(d). Perhaps, the following argumentation explains the high degradation ratio for CeO2 nanorods: the CeO2 nanorods have the largest surface area and surface-to-volume ratio. It is generally noted that an increase in dye concentration leads to a decrease in the degradation rate. A possible reason is that the high initial concentration of the dye solution caused more of the degradation reaction to take place to achieve the same level of degradation between the dye molecules and CeO2 catalyst. However, a higher concentration might also cause excessive adsorption of the CR molecules on the surface of the CeO2 nanostructures to limit its efficiency. Therefore, as the initial concentration of the CR dye increases, the requirement of the CeO2 catalyst surface needed for the degradation also increases. It was also found that a longer reaction time is necessary to degrade the higher concentration CRS under the same degradation conditions.
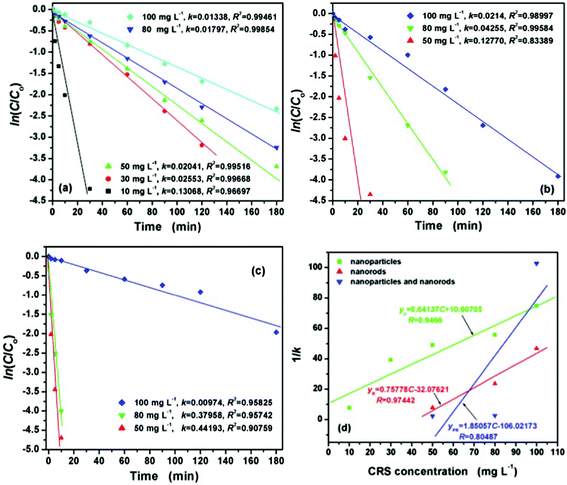 | ||
| Fig. 7 The effect of initial CRS concentration on the degradation kinetics for 50 mL CR solution at different time intervals: (a) 100 mg CeO2 nanoparticles, (b) 20 mg CeO2 nanorods, (c) 150 mg CeO2 mixture of nanoparticles and nanorods, and (d) the relationship between the degradation rate constant k and CRS concentrations from 10 to 100 mg L−1. | ||
3.4 The effect of the CeO2 nanostructure quantities on the degradation
Further comparative experiments were also carried out to investigate the effect the quantity of CeO2 nanostructures had on the degradation of the CR dye, which optimized the addition of CeO2 catalyst used for the highest degradation ratio. The effect of the quantity of CeO2 nanostructures on the degradation kinetics was studied by varying from 10 to 250 mg in 50 mL CRS, respectively. The corresponding results of the reaction kinetics studies are given in Fig. 8. As shown there, it can be seen that the CeO2 nanostructures content also plays a very important role in CR removal under visible light irradiation. The degradation rate of CR markedly slowed down due to the small amount of CeO2 nanostructures. With increased amounts of CeO2 nanostructures from 10 to 250 mg, the removal ratio of CR increased from 4.4 to 99%. This was due to the increase in catalyst amount, which contributed to the increase in the number of available active sites on the catalyst surface and also the number of the dye molecules degraded. The degradation rate constants k calculated from the curves referred to 10 or 20 mg CeO2 nanostructures are small for all cases, indicating that the CR molecules are difficult to be decomposed under visible light irradiation. Nevertheless, for the catalytic degradation related curves shown in Fig. 8(d), the degradation rate constants reveal that CR molecules can be degraded quickly in the presence of various CeO2 nanostructures from 50 to 250 mg. Of course, the CeO2 nanorods under visible light irradiation display the highest catalytic activity in these three prepared CeO2 nanostructures catalysts.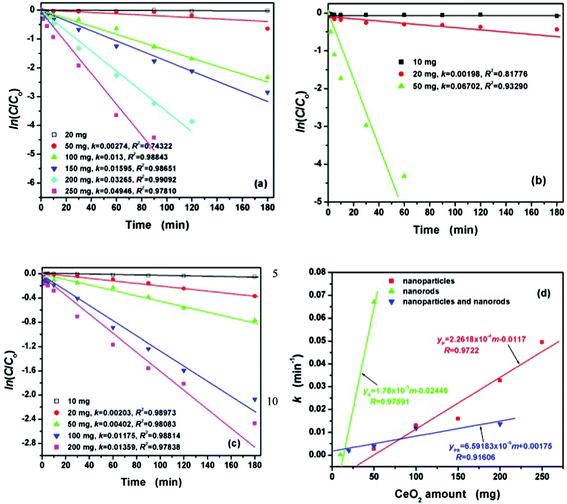 | ||
| Fig. 8 The effect of the amount of CeO2 nanostructures on the degradation kinetics for 50 mL CRS (100 mg L−1) at different time intervals: (a) CeO2 nanoparticles, (b) CeO2 nanorods, (c) CeO2 mixture of nanoparticles and nanorods, and (d) the relationship between the degradation rate constant k and the amounts of CeO2 nanostructures from 10 to 250 mg. | ||
The degradation rate constant (6.702 × 10⁻² min−1) of 50 mg CeO2 nanorods is far beyond those corresponding to the degradation reaction of 50 mg CeO2 nanoparticles ((2.74 × 10⁻³ min−1) and 50 mg of the CeO2 mixture of nanoparticles and nanorods (4.02 × 10⁻³ min−1), respectively, which also belong to first-order reaction kinetics. However, according to the experimental results, the shape of the lines indicates that the pseudo-first-order equation did not fit well to the whole range of the removal process and was generally applicable over the initial stage of the reaction time (less than 30 min).
3.5 The degradation of CR using regenerated CeO2 nanostructures
The performance of CeO2 nanostructures after CR degradation is hardly reported. In order to optimize the application of CeO2 catalysts for wastewater treatment for an industrial process, the regeneration and reuse of the catalysts are one of the key issues.83 Based on these aims, an attempt was made in this study to elucidate the differences between the as-synthesized and regenerated CeO2 and the consequences on the catalytic activity. The CeO2 nanostructures after the catalysis reaction were regenerated by simple drying at 60 °C in air for 12 h, and the regenerated catalysts were used in the degradation of CR dye under similar conditions. The regenerated CeO2 nanostructured materials had almost the same degradation performance for CR solutions, as shown in Fig. S4 and Fig. S5, ESI†. The results demonstrate the excellent degradation performance for CR solutions using CeO2 nanostructures as catalyst. The excellent degradation performances make it a promising degradation material to remove organic pollutants in wastewater treatments.3.6 The degradation mechanism of CR
To further clarify the removal mechanism of CR, the regenerated CeO2 nanoparticles, the as-synthesized CeO2 nanoparticles, and the CR dye were characterized by XRD. As shown in Fig. S6, ESI†, all diffraction peaks of the regenerated CeO2 nanoparticles can be perfectly indexed to a pure cubic phase, which perfectly indexed to CeO2. Comparing the CR diffraction peaks, no CR peaks are observed from the regenerated CeO2 nanoparticles. This indicates that the CeO2 catalyst does not adsorb the CR dye after the degradation reaction of CR. For the CeO2 nanorods and the CeO2 mixture of nanoparticles and nanorods, the same result was obtained.The FT-IR technique was used to identify specific changes of the functional groups in the CR dye molecule and CeO2 nanostructures. The FT-IR spectra of the CR dye, as-synthesized CeO2 nanoparticles, and regenerated CeO2 nanoparticles were measured and contrasted. From Fig. S7, ESI†, it can be seen that no characteristic peaks of CR dye occur in the FT-IR spectrum of the regenerated CeO2 nanoparticles dried after the catalysis reaction, which is also confirmed by the XRD analysis. It indicates that the dye molecules are not adsorbed by the catalyst, implying that the degradation of the dye is caused by the catalytic reaction, not by adsorption. The same is valid for CeO2 nanorods and the CeO2 mixture of nanoparticles and nanorods. The other two possible removal mechanisms are related to the fact that CeO2 is a very good oxidizer, which could remove organic compounds from wastewater through oxidation or photocatalysis decomposition. The main demand for the latter is that the minimum photon energy, in this case visible light with a wavelength longer than 420 nm, required for this process equals the bandgap energy of CeO2, which for our case of CeO2 nanoparticles amounts to 3.15 eV, as deduced from the corresponding UV-Vis spectrum (Fig. S8(a), ESI†) by applying the Tauc equation.84 Accordingly, one obtains a typical plot of (αhν)2 as a function of photon energy, and extrapolates the linear portion of the curve to give the value of the direct bandgap energy (Fig. S8(b), ESI†). It implies that CeO2 nanoparticles mainly adsorb light in the UV range, which makes photocatalysis decomposition negligible because our water treatment experiments were performed under a visible light at room temperature. Therefore, the most probable catalytic pathway for the CR removal is oxidative degradation. The main assumption for such a pathway is the presence of redox switch Ce3+/Ce4+ cations within the CeO2 nanoparticles. In order to corroborate this, samples were analyzed by means of X-ray photoelectron spectroscopy (XPS). The Ce 3d core level peak can be confirmed by the XPS analysis, as shown in Fig. 9. Due to its highly non-stoichiometric nature, both valences (3+ and 4+) are present in CeO2. The main peaks of Ce4+ 3d3/2 and Ce4+ 3d5/2 are shown at binding energies of 916.6 and 898.3 eV, respectively. Those of Ce3+ 3d3/2 and Ce3+ 3d5/2 are located at 901.5 and 882.2 eV. Three additional satellite lines SU1 and SU2, which means ‘shake-up’, are shown at 907.8 eV on the Ce3+ 3d3/2 and at 885.8 and 889.5 eV on the Ce3+ 3d5/2, respectively. This spectrum is fully consistent with those reported previously.85–87
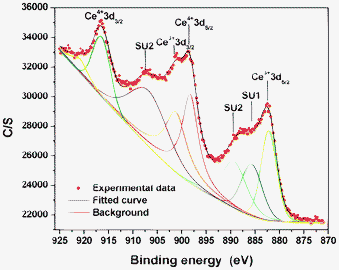 | ||
| Fig. 9 XPS spectrum of CeO2 nanoparticles. | ||
To rationalize XPS findings, one can state that the presence of Ce3+ is a result of oxygen vacancies and this effect is enhanced in nanoparticles because a larger fraction of the atoms are on the surface as the particle size is reduced and the surface atoms have reduced coordination. This leads to CeO2−x as the proper structural description for ceria nanoparticles. The oxygen vacancies lead to the transformation Ce4+↔Ce3+, a key issue in the oxidative degradation of CR. To further validate the proposed mechanism, an additional set of degradation experiments under the exclusion of any visible light (in the dark) were carried out. The representative degradation kinetics, measured under visible light and for comparison in the dark, for 50 mL CR solutions (100 mg L−1) using various CeO2 nanostructures are displayed in Fig. S9, ESI†. It reveals that the CeO2 nanostructures also exhibit a high degradation activity without any visible light irradiation. Therefore, this comparison experiment additionally confirms the proposed degradation mechanism of CR in the presence of CeO2 nanostructures as the oxidative degradation. From Fig. S9, ESI†, one can also notice that the degradation rate without any visible light irradiation is slightly lower than the degradation rate under visible light irradiation. The most probable explanation for this finding is that CeO2 nanostructures under visible light conditions might adsorb some UV light and thus they not only degrade CR oxidatively but also photocatalytically.
As shown in Fig. 10, CR and the degradation products formed at the end of the degradation reaction process were analyzed by LC–MS and identified by the interpretation of their mass spectra showing their molecular ion peaks with respect to m/z (where m is molecular weight of the intermediates in the mass spectra). CR is a sulphonated compound with two sulphonic acid groups. The MS spectrum (Fig. 10(a)) shows two negative pseudo-molecular ions of 650 and 324 m/z. The ion at 650 m/z was due to [M − 2Na + H]− , while the ion at 324 m/z corresponds to [M − 2Na]2−.88 The results from the MS analysis revealed that seven intermediate by-products were detected in the degradation of the CRS. The spectrum of the CRS is different from that of CRS degraded in the presence of CeO2 nanostructures, shown in Fig. 10(a). The difference can be explained by the decomposition of the species at different m/z ratios in the ion trap and the atmospheric pressure of the chemical ionization source of the instrument, i.e., the presence of CeO2 nanostructures changes the decomposition of CR. Li et al. reported that CR degradation events include the cleavage of C–S bonds, aromatic ring opening, cleavage of –N![[double bond, length as m-dash]](https://www.rsc.org/images/entities/char_e001.gif) N– double bonds, cleavage of various C–N and C–C bonds in addition to decarboxylation.89
N– double bonds, cleavage of various C–N and C–C bonds in addition to decarboxylation.89
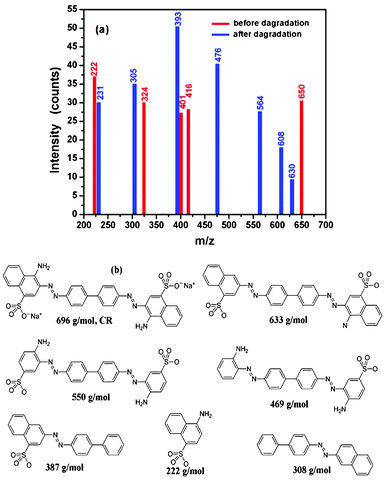 | ||
| Fig. 10 Spectra of CRS before and after degradation (a) and the CR and possible degradation products of CR (b). | ||
Although certified references are not available for the degradation products that occurred in the spectra, the species of the possible degradation products of CR are considered similar to the results reported by Li et al.89Fig. 10(b) shows the possible species formed after degradation of the CRS in the presence of CeO2, suggesting that CR degrades together with remarkable decolorization and insignificant mineralization to give CO2 and H2O. Similar results can be found in other reports.89,90
Based on our experimental results and previous literature records, the degradation mechanism of CR in the presence of CeO2 nanostructures can be proposed and is described below:
| Ce3+ + O2 → Ce4+ + O−2 | (2) |
| Ce4+ + H2O → Ce3+ + ˙OH + H+ | (3) |
| O−2 + H+ → HO2 | (4) |
| 2HO2 → H2O2 + O2 | (5) |
| H2O2 → 2˙OH | (6) |
| CR + ˙OH → CRox(intermediates) → CO2 + H2O | (7) |
Rather unstable surface resided Ce3+ ions in the presence of air (in water solution of CR-eqn (2)) oxidizes to Ce4+ producing O−2 Then, the produced Ce4+ cations can react easily with surface bound H2O to produce ˙OH radicals (eqn (3)). The superoxide radical anion O−2 can yield hydrogen peroxide H2O2 (eqn (4) and (5)) in oxygen-equilibrated media. These intermediates can interact to produce a hydroxyl radical ˙OH (eqn (6)). It is well known that the ˙OH radical is a powerful oxidizing agent capable of degrading most pollutants. The CR dye can be oxidized by ˙OH in deep levels (eqn (7)), and then be degraded to form smaller organic molecules, and these organic molecules can eventually be mineralized into CO2 and H2O. The location of these reactive species determines that the degradation of CR only occurs on the surface of CeO2, which also explains why the morphology and BET area have a great influence on their catalytic activity, as discussed previously.
4. Conclusions
CeO2 nanoparticles with various morphologies were successfully synthesized by a surfactant CTAB-assisted coprecipitation process at room temperature. XRD, SEM, TEM, and BET results showed that stable and crystalline phase pure CeO2 nanoparticles with a cubic fluorite structure were obtained. The most probable formation mechanism of these CeO2 nanoparticles was proposed. This new and simple approach has obvious advantages due to its simplicity, low cost and it being environmentally benign. The degradation performances of the as-synthesized and regenerated CeO2 with the different nanostructures towards CR in aqueous solution were studied.The effects of the amount of CeO2 nanostructures, initial CR concentration, and degradation time on the degradation of CR were examined. The removal of CR follows a Langmuir–Hinshelwood first-order kinetic law over the initial stage of the reaction time for the different CR concentrations (10–100 mg L−1), by using various amounts ofCeO2 nanoparticles with various morphologies catalyst. The proposed mechanism for the catalytic removal of CR dyes relies on the presence of surface Ce3+ cations which via a redox Ce3+/Ce4+ switch degrade the CR dye. The CeO2 nanoparticles are found to be efficient in generating less toxic secondary pollutants, which can be easily eliminated from the system by being subjected further to traditional physical, chemical and biological treatments.
Acknowledgements
This work was supported by the Department of Science and Technology of Yunnan Province via the Key Project for the Science and Technology (Grant No.2011FA001), the Key Project of Chinese Ministry of Education (Grant No. 210206), and National Natural Science Foundation of China (Grant No. 50662006).References
- O. S. Polezhaeva, N. V. Yaroshinskaya and V. K. Ivanov, Russ. J. Inorg. Chem., 2007, 52, 1184–1188 CrossRef.
- B. Murugan and A. V. Ramaswamy, J. Am. Chem. Soc., 2007, 129, 3062–3063 CrossRef CAS.
- H. Y. Yahiro, K. Baba, H. Eguchi and J. Arai, J. Electrochem. Soc., 1988, 135, 2077–2080 CrossRef CAS.
- H. Gu and M. D. Soucek, Chem. Mater., 2007, 19, 1103–1108 CrossRef CAS.
- X. D. Feng, D. C. Sayle, Z. L. Wang, M. S. Paras, B. Santora, A. C. Sutorik, T. X. T. Sayle, Y. Yang, Y. Ding, X. D. Wang and Y. S. Her, Science, 2006, 312, 1504–1508 CrossRef CAS.
- N. Izu, W. Shin, N. Murayama and S. Kanzaki, Sens. Actuators, B, 2002, 87, 95–98 CrossRef.
- S. Tsunekawa, T. Fukuda and A. Kasuya, J. Appl. Phys., 2000, 87, 1318–1321 CrossRef CAS.
- A. Trovarelli, Catal. Rev. Sci. Eng., 1996, 38, 439–520 CAS.
- J. Kašpar, P. Fornasiero and M. Graziani, Catal. Today, 1999, 50, 285–298 CrossRef.
- M. L. Granados, F. C. Galisteo, P. S. Lambrou, R. Mariscal, J. Sanzc, I. Sobrados, J. L. G. Fierro and A. M. Efstathiou, J. Catal., 2006, 239, 410–421 CrossRef.
- Q. Fu, H. Saltsburg and M. Flytzani-Stephanopoulos, Science, 2003, 301, 935–938 CrossRef CAS.
- E. P. Murray, T. Tsai and S. A. Barnett, Nature, 1999, 400, 649–651 CrossRef CAS.
- A. Corma, P. Atienzar, H. Garcia and J. Y. Chane-Ching, Nat. Mater., 2004, 3, 394–397 CrossRef CAS.
- A. H. Morshed, M. E. Moussa, S. M. Bedair, R. Leonard, S. X. Liu and N. Elmasry, Appl. Phys. Lett., 1997, 70, 1647–1649 CrossRef CAS.
- S. H. Lee, Z. Y. Lu, S. V. Babu and E. Matijevic, J. Mater. Res., 2002, 17, 2744–2749 CrossRef CAS.
- S. Yabe and T. Sato, J. Solid State Chem., 2003, 171, 7–11 CrossRef CAS.
- S. J. Huang, K. Hara and A. Fukuoka, Energy Environ. Sci., 2009, 2, 1060–1068 CAS.
- G. A. Umeda, W. C. Chueh, L. Noailles, S. M. Haile and B. S. Dunn, Energy Environ. Sci., 2008, 1, 484–486 CAS.
- X. H. Lu, D. Z. Zheng, J. Y. Gan, Z. Q. Liu, C. L. Liang, P. Liu and Y. X. Tong, J. Mater. Chem., 2010, 20, 7118–7122 RSC.
- R. Si, Y. W. Zhang, L. P. You and C. H.Yan, Angew. Chem., Int. Ed., 2005, 44, 3256–3260 CrossRef CAS.
- Q. Wu, F. Zhang, P. Xiao, H. S. Tao, X. Z. Wang, Z. Hu and Yinong Lu, J. Phys. Chem. C, 2008, 112, 17076–17080 CAS.
- D. C. Sayle, X. D. Feng, Y. Ding, Z. L. Wang and T. X. T. Sayle, J. Am. Chem. Soc., 2007, 129, 7924–7935 CrossRef CAS.
- B. Tang, L. H. Zhuo, J. C. Ge, G. L. Wang, Z. Q. Shi and J. Y.Niu, Chem. Commun., 2005, 3565–3567 RSC.
- M. Yada, S. Sakai, T. Torikai, T. Watari, S. Furuta and H. Katsuki, Adv. Mater., 2004, 16, 1222–1226 CrossRef CAS.
- L. Yan, R. B. Yu, J. Chen and X. R. Xing, Cryst. Growth Des., 2008, 8, 1474–1477 CAS.
- W. Q. Han, L. Wu and Y. Zhu, J. Am. Chem. Soc., 2005, 127, 12814–12815 CrossRef CAS.
- Y. Ma, X. D. Wang, S. H. Li, M. S. Toprak, B. Zhu and M. Muhammed, Adv. Mater., 2010, 22, 1640–1644 CrossRef CAS.
- P. Kluson, P. Kacer, T. Cajthanml and M. Kalaji, J. Mater. Chem., 2001, 11, 644–651 RSC.
- T. Masui, K. Fujiwara, K. Machida, G. Adachi, T. Sakata and H. Mori, Chem. Mater., 1997, 9, 2197–2204 CrossRef CAS.
- S. G. Dixit, A. R. Mahadeshwar and S. K. Haram, Colloids Surf., A, 1998, 133, 69–75 CrossRef CAS.
- K. H. Chung and D. C. Park, Catal. Today, 1996, 30, 157–162 CrossRef CAS.
- G. R. Bamwenda and H. J. Arakawa, J. Mol. Catal. A: Chem., 2000, 161, 105–113 CrossRef CAS.
- M. D. Hernández-Alonso, A. B. Hungría, A. Martínez-Arias, M. Fernández-García, J. M. Coronado, J. C. Conesa and J. Soria, Appl. Catal., B, 2004, 50, 167–175 CrossRef.
- Y. Q. Zhai, S. Y. Zhang and H. Pang, Mater. Lett., 2007, 61, 1863–1866 CrossRef CAS.
- P. Borker and A. V. Salker, Mater. Chem. Phys., 2007, 103, 366–370 CrossRef CAS.
- L. Yue and X. M. Zhang, J. Alloys Compd., 2009, 475, 702–705 CrossRef CAS.
- L. W. Qian, J. Zhua, W. M. Du and X. F. Qian, Mater. Chem. Phys., 2009, 115, 835–840 CrossRef CAS.
- J. Kašpar, P. Fornasiero and N. Hickey, Catal. Today, 2003, 77, 419–449 CrossRef.
- S. W. Boettcher, J. Fan, C. Tsung, Q. Shi and G. D. Stucky, Acc. Chem. Res., 2007, 40, 784–792 CrossRef CAS.
- Z. X. Li, L. L. Li, Q. Yuan, W. Feng, J. Xu, L. D. Sun, W. G. Song and C. H.Yan, J. Phys. Chem. C, 2008, 112, 18405–18411 CAS.
- H. Y. Xiao, Z. H. Ai and L. Z. Zhang, J. Phys. Chem. C, 2009, 113, 16625–16630 CAS.
- Y. Zhai, S. Zhang and H. Pang, Mater. Lett., 2007, 61, 1863–1866 CrossRef CAS.
- P. Borker and A. V. Salker, Mater. Chem. Phys., 2007, 103, 366–370 CrossRef CAS.
- J. B. Fei, Y. Cui, X. H. Yan, Y. Yang, K. W. Wang, Q. He and J. B. Li, Adv. Mater., 2008, 20, 452–456 CrossRef.
- Z. J. Yang, J. J. Wei, H. X. Yang, L. Liu, H. Liang and Y. Z. Yang, Eur. J. Inorg. Chem., 2010, 3354–3359 CrossRef CAS.
- J. H. Sun, Y. K. Wang, R. X. Sun and S. Y. Dong, Mater. Chem. Phys., 2009, 115, 303–308 CrossRef CAS.
- V. A. Sakkas, M. A. Islam, C. Stalikas and T. A. Albanis, J. Hazard. Mater., 2010, 175, 33–44 CrossRef CAS.
- M. N. Chong, H. Y. Zhu and B. Jin, Chem. Eng. J., 2010, 156, 278–285 CrossRef CAS.
- M. T. C. Sansiviero, D.S. dos Santos, A. E. Job and R. F. Aroca, J. Photochem. Photobiol., A, 2011, 220, 20–24 CrossRef CAS.
- G. Laeraa, B. Jin, H. Zhu and A. Lopez, Catal. Today, 2011, 161, 147–152 CrossRef.
- A. K. Kondru, P. Kumar and S. Chand, J. Hazard. Mater., 2009, 166, 342–347 CrossRef CAS.
- B. Cheng, Y. Le, W. Q. Cai and J. G. Yu, J. Hazard. Mater., 2011, 185, 889–897 CrossRef CAS.
- A. Afkhami and R. Moosavi, J. Hazard. Mater., 2010, 174, 398–403 CrossRef CAS.
- S. Chatterjee, M. W. Lee and S. H. Woo, Bioresour. Technol., 2010, 101, 1800–1806 CrossRef CAS.
- H. Y. Zhu, R. Jiang, L. Xiao, Y. H. Chang, Y. J. Guan, X. D. Li and G. M. Zeng, J. Hazard. Mater., 2009, 169, 933–940 CrossRef CAS.
- H. R. Pouretedal and M. H. Keshavarz, J. Alloys Compd., 2010, 501, 130–135 CrossRef CAS.
- A. Elaziouti, N. Laouedj and B. Ahmed, J. Chem. Eng. Process Technol., 2011, 2, 1–9 Search PubMed.
- K. Melghit, M. S. Al-Rubaei and I. Al-Amri, J. Photochem. Photobiol., A, 2006, 181, 137–141 CrossRef CAS.
- A. Mittal, J. Mittal, A. Malviya and V. K. Gupta, J. Colloid Interface Sci., 2009, 340, 16–26 CrossRef CAS.
- J. Rodriguez-Carvajal, Fullprof – program for the Rietveld refinement, Laboratorie Leon Brillouin, CEA-Saclay, France, 2001 Search PubMed.
- F. Zhang, S. Chan, J. E. Spanier, E. Apak, Q. Jin, R. D. Robinson and I. P. Herman, Appl. Phys. Lett., 2002, 80, 127–129 CrossRef CAS.
- K. H. S. Kung and K. F. Hayes, Langmuir, 1993, 9, 263–267 CrossRef CAS.
- L. J. Bellamy, The infrared spectra of complex molecules, Chapman Hall, New York, 1975 Search PubMed.
- Q. Y. Mu and Y. D. Wang, J. Alloys Compd., 2011, 509, 2060–2065 CrossRef CAS.
- J. X. Xu, G. S. Li and L. P. Li, Mater. Res. Bull., 2008, 43, 990–995 CrossRef CAS.
- D. S. Zhang, H. X. Fu, L. Y. Shi, C. S. Pan, Q. Li, Y. L. Chu and W. Y. Yu, Inorg. Chem., 2007, 46, 2446–2451 CrossRef CAS.
- S. Phoka, P. Laokul, E. Swatsitang, V. Promarak, S. Seraphin and S. Maensiri, Mater. Chem. Phys., 2009, 115, 423–428 CrossRef CAS.
- A. Vantomme, Z. Y. Yuan, G. Du and B. L. Su, Langmuir, 2005, 21, 1132–1135 CrossRef CAS.
- D. S. Zhang, H. X. Fu, L. Y. Shi, C. S. Pan, Q. Li, Y. L. Chu and W. J Yu, Inorg. Chem., 2007, 46, 2446–2451 CrossRef CAS.
- C. S. Pan, D. S. Zhang and L. Y. Shi, J. Solid State Chem., 2008, 181, 1298–1306 CrossRef CAS.
- Q. Y. Mu, T. Chen and Y. D. Wang, Nanotechnology, 2009, 20, 345602 CrossRef (7 pages).
- K. B. Zhou, X. Wang, X. M. Sun, Q. Peng and Y. D. Li, J. Catal., 2005, 229, 206–212 CrossRef CAS.
- P. F. Ji, J. L. Zhang, F. Chen and M. Anpo, J. Phys. Chem. C, 2008, 112, 17809–17813 CAS.
- P. X. Huang, F. Wu, B. L. Zhu, X. P. Gao, H. Y. Zhu, T. Y. Yan, W. P. Huang, S. H. Wu and D. Y. Song, J. Phys. Chem. B, 2005, 109, 19169–19174 CrossRef CAS.
- Y. Wang, Y. Wang, Y.L. Meng, H. M. Ding, Y. K. Shan, X. Zhao and X. Z. Tang, J. Phys. Chem. C, 2008, 112, 6620–6626 CAS.
- J. S. Chang, C. Chou, Y. C. Lin, P. J. Lin, J. Y. Ho and L. H. Tai, Water Res., 2001, 35, 2841–2850 CrossRef CAS.
- N. H. Ince, M. I. Stefan and J. R. Bolton, J. Adv. Oxid. Technol., 1997, 2, 442–448 CAS.
- Y. Q. Cao, Y. Y. Hu, J. Sun and B. Hou, Bioelectrochemistry, 2010, 79, 71–76 CrossRef CAS.
- B. C. B. Salgado, M. I. C. Nogueira, K. A. Rodrigues, G. M. M. S. Sampaio, H. L. Buarque and R. S. Araújo, Engenharia Sanitaria e Ambiental, 2009, 14, 1–9 CrossRef.
- H. Y. Chen, O. Zahraa, M. Bouchy, F. Thomas and J. Y. Bottero, J. Photochem. Photobiol., A, 1995, 85, 179–186 CrossRef CAS.
- R. K. Wahi, W. W. Yu, Y. Liu, M. L. Mejia, J. C. Falkner, W. Nolte and V. L. Colvin, J. Mol. Catal. A: Chem., 2005, 242, 48–56 CrossRef CAS.
- S. Kaur and V. Singh, J. Hazard. Mater., 2007, 141, 230–236 CrossRef CAS.
- S. Mozia, M. Toyoda, M. Inagaki, B. Tryba and A. W. Morawski, J. Hazard. Mater., 2007, 140, 369–375 CrossRef CAS.
- J. A. Prins, Proc. Int. Conf. Physics of Noncrystalline Solids, Amsterdam, North Holland Pub. Co, New York, 1964 Search PubMed.
- S. Tsunekawa, T. Fukuda and A. Kasuya, Surf. Sci., 2000, 457, L437–L440 CrossRef CAS.
- D. R. Mullins, S. H. Overbury and D. R. Huntley, Surf. Sci., 1998, 409, 307–319 CrossRef CAS.
- R. Vercaemst, D. Poelman, R. L. Van Meirhaeghe, L. Fiermans, W. H. Laflke and F. Cardon, J. Lumin., 1995, 63, 19–30 CrossRef CAS.
- H. J. Ma, M. Wang, R. Y. Yang, W. F. Wang, J. Zhao, Z. Q. Shen and S. D Yao, Chemosphere, 2007, 68, 1098–1104 CrossRef CAS.
- D. Li, Y. Guo, C. Hu, C. Jiang and E. Wang, J. Mol. Catal. A: Chem., 2004, 207, 183–193 CrossRef CAS.
- S. Erdemoğlu, S. K. Aksu, F. Sayilkan, B. İzgi, M. Asiltürk, H. Sayılkan, F. Frimmel and S. Gücer, J. Hazard. Mater., 2008, 155, 469–47 CrossRef.
Footnote |
| † Electronic Supplementary Information (ESI) available: Fig. S1–S9. See DOI: 10.1039/c2ra21590j |
| This journal is © The Royal Society of Chemistry 2012 |
