In situ nano-assembly of bacterial cellulose–polyaniline composites
Zhijun
Shi
a,
Shanshan
Zang
a,
Fan
Jiang
a,
Long
Huang
b,
Dan
Lu
b,
Yuguang
Ma
b and
Guang
Yang
*a
aNational Engineering Research Center for Nano-Medicine, College of Life Science and Technology, Huazhong University of Science and Technology, Wuhan, 430074, China. E-mail: yang_sunny@yahoo.com; Fax: 86 027 8779 2265; Tel: 86 027 8779 3523
bState Key Laboratory of Supramolecular Structure and Materials, Jilin University, Changchun, 130012, China
First published on 7th December 2011
Abstract
Bacterial cellulose (BC), produced by Gluconacetobacter xylinum, consists of ribbon-shaped nano-fibers in web-like structures. Polyaniline (PAni) is a conductive polymer, the conductivity of which is related to the synthesis and doping process. In this paper, we report on the in situ nano-assembly of BC nanofibers and PAni to enhance the electronic conductivity. PAni could be synthesized on the surface of BC nano-fibers and assembled into a novel 3D network. The reaction time of polymerization, the types and concentration of doping protonic acids play a major role on the electroconductivity properties of the composites. The electroconductivity of composite hydrogels was enhanced from 10−8 to 10−2 S cm−1, and can be further improved by doping with various protonic acids. The BC–PAni nanofiber composite is an electro-conductive hydrogel that combines the properties of hydrogels and conductive systems, and it may potentially be used for flexible displays, biosensors, and platform substrates to study the effect of electrical signals on cell activity, and to direct desirable cell function for tissue engineering applications.
Introduction
As a conductive electroactive polymer, polyaniline is well-known for its ease of synthesis and environmental stability (Fig. 1). Aniline can be polymerized to polyaniline through chemical1 or electrochemical polymerization.2,3 The conductivity of polyaniline can be changed through doping/dedoping and oxidation/reduction, from 10−8 S m−1 (an insulator) to 102 S m−1 (a conductor).4 Conductive electroactive polymers, including polyaniline, find applications as electrical conductors, batteries, chemical and biological sensors, actuators, electromagnetic shielding, antistatic coatings, corrosion protection, and electro-optic and electrochromic devices.3,5–12 Their unique electrical, electrochemical and optical properties also could be used as health care materials, from tissue engineering to drug delivery, from neural regeneration to smart implants. All these several special sections provide new opportunities and challenges to these polymers. Many researchers want to use conductive electroactive polymers in biomedical applications, such as implantable electrochemical biosensors, electro-stimulated drug release devices and neural prosthetics. But there are several obvious challenges, in which questionable biocompatibility is the most serious problem.13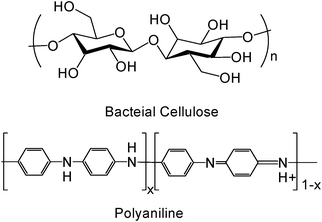 | ||
| Fig. 1 Chemical structure of BC and PAni (x = 1, leucoemeraldine base; x = 0.5, emeraldine salt; x = 0, pernigraniline). | ||
Bacterial cellulose (BC) is a kind of cellulose, and it can be produced by many microorganisms,14,15 one of which is Gluconacetobacter xylinum.16 Sharing the same structural unit (Fig. 1), BC does not only have the properties of common cellulose products produced by plants, but it also has its own special properties. The special properties of BC are its high chemical purity and crystallinity,17 high degree of polymerization, excellent biocompatibility and biodegradability.18,19 These properties have already led to successful commercialization in a variety of niche markets, including health foods, high-end audio components, speciality paper, and wound care,19–21 or even for gene detection.22 Most importantly, BC is a natural polymer hydrogel, which has three-dimensional polymeric networks and imbibes large amounts of water. BC hydrogels are flexible and have good mechanical properties, and they can accordingly easily change their size and shape in response to the environmental stimuli. Moreover, BC can also imbibe other monomeric, reactive and potentially polymerizable monomers into its networks, essentially occupying its void volume and interacting with BC fiber chains. Many researchers have used these properties to change or improve the characteristics of BC to achieve optical transparency,23–26 electrical conductivity,27 hydrophobicity,28etc.
The use of plant cellulose, regenerated cellulose and cellulose derivatives in combination with conductive polymers for the preparation of conductive materials has been reported previously.29,30 Additionally, there are multiple reports involving BC that document their biocompatibility, biodegradability, and bioadhesion.18–20,31 In this paper, we incorporated polyaniline, with BC hydrogels, to synthesize an electroconductive hydrogel that combines the properties of hydrogels and conductive systems. The reaction time of polymerization, the type and concentration of doping protonic acids play a major role in the electroconductivity properties of the composites. The combination of BC hydrogels and inherently conductive electroactive polymers forms an excellent biocompatible and electroconductive hydrogel material, which may engender new applications in flexible electrodes, flexible displays, or even be used as healthcare materials, such as tissue engineering scaffolds, deep brain stimulation electrodes, implantable biosensors, and implantable neural prosthetic devices.
Experimental section
Preparation of BC membranes
Gluconacetobacter xylinum (ATCC53582) was used for the biosynthesis of BC. The bacterium was cultured in a Hestrin and Schramm (HS) medium, which was composed of 2% (wt) glucose, 0.5% (wt) yeast extract, 0.5% (wt) peptone, 0.27% (wt) disodium phosphate, and 0.15% (wt) citric acid. After incubating statically for 6∼14 days at 26 °C, the BC membranes were dipped into distilled water for 2 days, and then steamed by boiling in a 1 wt% NaOH solution for 30 min to eliminate bacteria and proteins.18 Afterwards, the BC membranes were purified by being washed in distilled water several times, and were then stored in distilled water at 4 °C.Preparation of BC–PAni composite membranes
The BC membrane was dipped into a 100 ml aniline hydrochloride solution (0.5 mol L−1) for about 48 h with stirring, at room temperature, enabling the aniline hydrochloride solution to fully infiltrate through the network of BC fibers. The BC was immersed into 200 ml of an ammonium peroxydisulfate solution (0.25 mol L−1) with stirring. Samples were taken out of the ammonium peroxydisulfate solution after 5, 10, 20, 30, 60 and 120 min. The schematic diagram of the process of aniline polymerization is shown in Fig. 2. The composite samples obtained at 10, 30 and 60 min were named BC–PAni-1, BC–PAni-2 and BC–PAni-3. Finally, dry BC or BC–PAni hybrid sheets were obtained by pressing the BC or BC–PAni hydrogels at 120 °C and 1–2 MPa.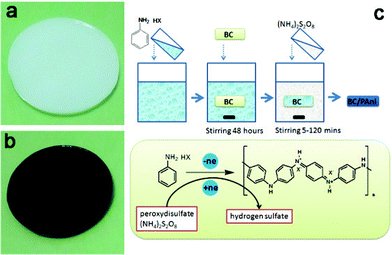 | ||
| Fig. 2 Photographs of (a) BC hydrogel and (b) BC–PAni hydrogel and (c) schematic diagram showing the experiment process, the chemical structure and synthesis of PAni in the BC hydrogel. | ||
Characterization
The surface morphology of all the samples was observed using environment scanning electron microscopy (ESEM, Quanta 200, Holand) and field emission scanning electron microscopy (FESEM, Sirion 200, FEI, Holand). All samples were sputtered with gold, before observation and photography.X-Ray photoelectron spectroscopy (XPS ESCALAB 250, UK) was used to characterize the surface composition of the BC and the BC–PAni. Monochromatic Al Kr X-rays were employed. The X-ray source was 0.5 mm nominal X-ray spot size utilized for both survey and high-resolution spectra. Survey spectra, from 0 to 1200 eV binding energy, were recorded at 50 eV pass energy with an energy step of 1.0 eV. High-resolution spectra were recorded at 20 eV pass energy with an energy step of 0.05 eV, with a typical average of three scans.
The samples were analyzed in KBr discs by Fourier transform infrared spectroscopy (FTIR, VERTEX 70, Germany) in the region 400–4000 cm−1.
13C cross-polarization magic-angle spinning (CPMAS) and 13C single-pulse excitation magic-angle spinning (SPEMAS) NMR spectra were recorded on a Varian InfinityPlus-300 NMR spectrometer equipped with a standard Chemagnetic magic-angle spinning probe head, operating at 299.98 MHz for 1H and 75.12 MHz for 13C, respectively. Typically, about 50 mg sample was packed into a 4 mm zirconium oxide rotor and spun at about 6 kHz (±1 Hz).
Raman microscopy (Renishaw inVia, U.K.) was performed using 325 nm laser excitation.
The conducting properties of samples were measured by using Potentiostats-Electrochemistry Workstation (Par 2273, USA). The samples were placed between two SnO2:F electrodes, by measuring the current in a voltage range 0∼1 V or −4∼4 V.
Results and discussion
In the process of cellulose formation, sub-elementary fibrils are first assembled to form microfibrils (d = 3∼4 nm) and further polymerized to form ribbons (d = 30∼50 nm), which finally developed into a hyperfine network structure through interactive interweaving. For subsequent analysis, the BC membranes were soaked in water for 2 days and then freeze-dried. The ESEM images of the dried BC membranes showed that they formed dense and finely branched nanolevel networks in the planar direction (Fig. 3), and the microfibrils are 40 nm in diameter. To obtain purified BC membranes, bacterial cell debris and protein should be totally removed by boiling in 1% wt NaOH solution for about 30 mins.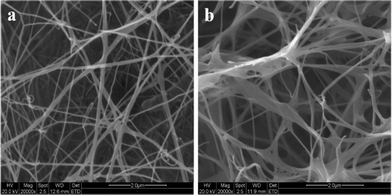 | ||
| Fig. 3 ESEM images of the surface of a bacterial cellulose membrane cultured for 10 days. (The BC membrane was soaked in water for 2 days and then freeze-dried.) | ||
Dry BC membranes were obtained by pressing the wet BC mat at 120 °C and 1–2 MPa. After the hot press process, the wet BC membrane turned into a highly toughened sheet, with the fracture strength reaching 180 MPa. The FESEM images show the network structure of the purified BC membrane (Fig. 4a).
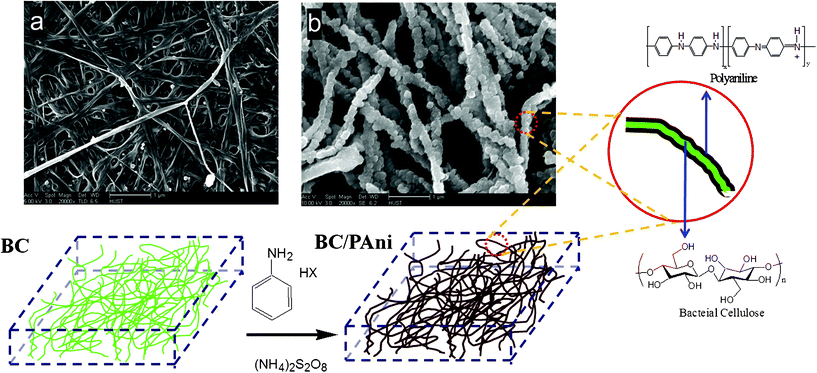 | ||
| Fig. 4 Schematic diagram of the process of aniline polymerization in the BC hydrogel. (Fig. a is the FESEM image of the hot-pressed BC membrane; and Fig. b is the FESEM image of hot-pressed BC–PAni membrane.) | ||
PAni is currently prepared by the oxidation of aniline with ammonium persulfate as the oxidant in an acidic aqueous medium.32,33 The BC membrane was added to a conical flask filled with an aniline salt solution, and then the flask was placed on a shaking table for 48 h to let the aniline salt solution replace the water in the membrane. When the BC membrane was soaked in a solution of ammonium persulfate, polymerization started in the BC membrane substrate to form PAni. The aniline salt lost electrons as it was converted to PAni, and ammonium persulfate accepted these electrons and was reduced to sulfate.34 Based on the section images of samples with different reaction times, it was concluded that the PAni was formed from the surface to the middle layer of the BC hydrogel; contrast is provided by the color of the BC–PAni composites which are dark green.
The results of FESEM show that BC–PAni composites (Fig. 4b) contain a random assembly of microfibrils. This morphology of uniform microfibrils is very different from that of microfibrils of purified BC. From several images the width of BC microfibrils was measured to be 40–60 nm, and the width of BC–PAni composites microfibrils was 80–120 nm. We propose that the PAni polymerized on the surface of the BC nanofiber.
X-Ray photoelectron spectroscopy (XPS) was used to characterize the surface composition of BC, PAni and BC–PAni. The appearance of S (169 eV, 232 eV) in the PAni sample was attributed the ammonium persulfate which accepted electrons and was reduced to sulfate. Survey scans of BC showed the C 1 s peak at 285 eV and the O 1 s peak at 532 eV, respectively. The N 1s peak appears at 400 eV; no nitrogen peak is found in BC, but it is seen in PAni and BC–PAni (Fig. 5). From Table 1 we know that the atom% of O in BC–PAni was lower than that in BC, while the atom% for C in BC–PAni was higher than that of BC, and the difference was attributed to the polymerization of PAni on the BC nanofiber.
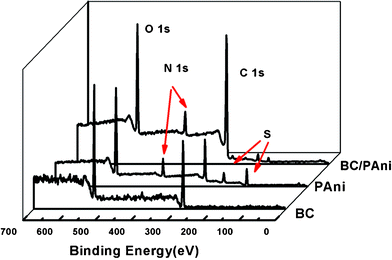 | ||
| Fig. 5 XPS of BC, PAni and BC–PAni-2. | ||
Fig. 6a represents the XPS spectra for the nitrogen of PAni. The curve deconvolution resulted in the presence of three peaks attributed –N![[double bond, length as m-dash]](https://www.rsc.org/images/entities/char_e001.gif) (398.5eV), –N- (399.8eV) and N+ (401.6eV).35,36 PAni is prepared by the oxidation of aniline with ammonium persulfate as the oxidant in an acidic aqueous medium. The percentage of –N
(398.5eV), –N- (399.8eV) and N+ (401.6eV).35,36 PAni is prepared by the oxidation of aniline with ammonium persulfate as the oxidant in an acidic aqueous medium. The percentage of –N![[double bond, length as m-dash]](https://www.rsc.org/images/entities/char_e001.gif) , –N– and N+ was of 0%, 24.6% and 75.4% respectively (Table 2). The PAni sample we obtained is a protonated emeraldine base form with a high conductivity (∼3 S cm−1), which is called the emeraldine salt form (ES).37Fig. 7a shows the molecular structure of ES; from this we know that the nitrogens of ES occurred as protonated nitrogens (N+) and as amine nitrogens (–N–). The XPS spectrum for BC–PAni-2 is shown on Fig. 6b. In this case, the percentages of –N
, –N– and N+ was of 0%, 24.6% and 75.4% respectively (Table 2). The PAni sample we obtained is a protonated emeraldine base form with a high conductivity (∼3 S cm−1), which is called the emeraldine salt form (ES).37Fig. 7a shows the molecular structure of ES; from this we know that the nitrogens of ES occurred as protonated nitrogens (N+) and as amine nitrogens (–N–). The XPS spectrum for BC–PAni-2 is shown on Fig. 6b. In this case, the percentages of –N![[double bond, length as m-dash]](https://www.rsc.org/images/entities/char_e001.gif) , –N– and N+ were of 17.6%, 62.6% and 19.8%. The decrease of the percentage of protonated nitrogen (N+) could indicate that BC interacts with the PAni through the formation of hydrogen bonds, as suggested in Fig. 7.
, –N– and N+ were of 17.6%, 62.6% and 19.8%. The decrease of the percentage of protonated nitrogen (N+) could indicate that BC interacts with the PAni through the formation of hydrogen bonds, as suggested in Fig. 7.
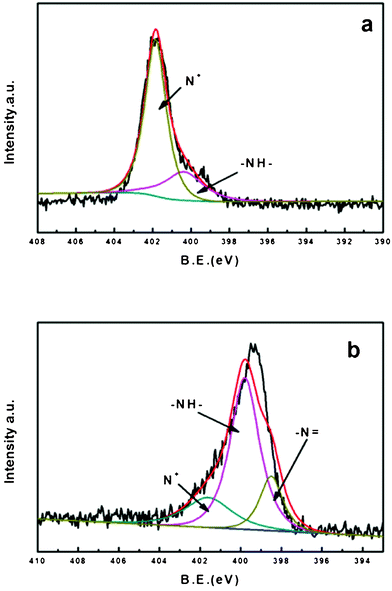 | ||
| Fig. 6 XPS spectra (N 1s) for (a) PAni and (b) BC–PAni-2. | ||
| XPS | |||
|---|---|---|---|
| N+/N | –NH–/N | –N![[double bond, length as m-dash]](https://www.rsc.org/images/entities/char_e001.gif) /N /N |
|
| PAni | 75.4 | 24.6 | 0 |
| BC–PAni | 19.8 | 62.6 | 17.6 |
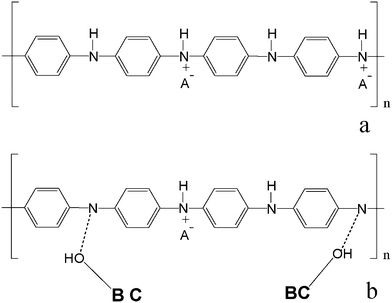 | ||
| Fig. 7 Scheme of PAni (emeraldine salt form) (a) and BC–PAni (b). | ||
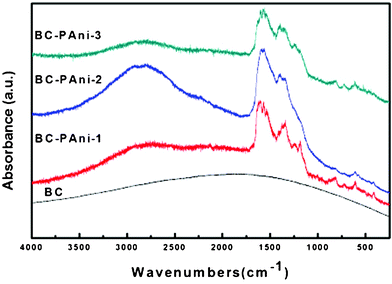
BC and BC–PAni composites were also characterized by Fourier transform infrared spectroscopy (Fig. 8). In the spectrum of BC, the peak at 3400 cm−1 was assigned to the hydroxyl group, and the peak at 2800∼3000 cm−1 was attributed to C–H stretching. The spectrum of all three samples of composites showed two peaks at 1560 cm−1 and 1460 cm−1, which were assigned to N![[double bond, length as m-dash]](https://www.rsc.org/images/entities/char_e001.gif) Q
Q![[double bond, length as m-dash]](https://www.rsc.org/images/entities/char_e001.gif) N and N–B–N, respectively (Q represents quinonoid and B represents benzenoid moieties). The conductive form of PAni, which consists of about equal amounts of benzenoid and quinonoid units, has approximately equal intensities for the 1560 cm−1 and 1460 cm−1 absorption bands.38 The sample of BC–PAni-1, in which the intensity for the 1460 cm−1 absorption band was much stronger than for the 1560 cm−1 band, demonstrated that the amounts of benzenoid units were greater than those of the quinonoid units. Moreover, the sample of BC–PAni-2, in which intensity of the 1460 cm−1 absorption band was about equal to the 1560 cm−1 absorption band, suggested that with increased progressing reaction time, more benzenoid units would transform to quinonoid units. The BC–PAni-2 sample consists of about equal amounts of benzenoid and quinonoid units, that is to say, the structure of this sample was similar to that of the conductive form of PAni. Therefore, the sample of BC–PAni-2 should have good electrical conductivity.
N and N–B–N, respectively (Q represents quinonoid and B represents benzenoid moieties). The conductive form of PAni, which consists of about equal amounts of benzenoid and quinonoid units, has approximately equal intensities for the 1560 cm−1 and 1460 cm−1 absorption bands.38 The sample of BC–PAni-1, in which the intensity for the 1460 cm−1 absorption band was much stronger than for the 1560 cm−1 band, demonstrated that the amounts of benzenoid units were greater than those of the quinonoid units. Moreover, the sample of BC–PAni-2, in which intensity of the 1460 cm−1 absorption band was about equal to the 1560 cm−1 absorption band, suggested that with increased progressing reaction time, more benzenoid units would transform to quinonoid units. The BC–PAni-2 sample consists of about equal amounts of benzenoid and quinonoid units, that is to say, the structure of this sample was similar to that of the conductive form of PAni. Therefore, the sample of BC–PAni-2 should have good electrical conductivity.
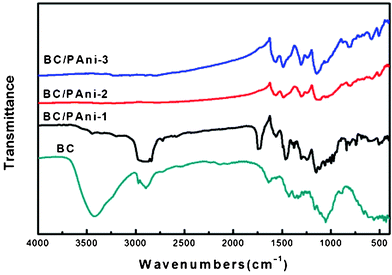 | ||
| Fig. 8 FT-IR spectra of BC and BC–PAni composites. | ||
It is important to inquire how PAni was incorporated into the BC. We observed that the intensity for the 3400 cm−1 absorption band, which is attributed to the hydroxyl (–OH), was reduced in BC–PAni-1, and even disappeared in BC–PAni-2 and BC–PAni-3. In addition, the absorption spectra of BC–PAni composites did not show any N–H stretching absorption. Thus, we can conclude that BC may have reacted via dehydration–condensation with PAni, leading to cause the disappearance of O–H and N–H bonds.
The laser Raman spectra of BC and BC–PAni samples are shown in Fig. 9; they were obtained with a 325 nm excitation line. As it can be observed, the spectrum of BC indicates dispersion of fluorescence, but the spectra of BC–PAni composites could be analysed. The relative intensity of the band at 1486 cm−1, assigned to the C![[double bond, length as m-dash]](https://www.rsc.org/images/entities/char_e001.gif) N stretching of the quinoid diimine units, was enhanced when the BC–PAni reaction was terminated at 30 min and 60 min. The bands at 1600 cm−1 (ν(C–C) benzenoid units) and 1148 cm−1 (ν(C–N) benzenediamine units)39 appear in the spectrum of BC–PAni-1, but the bands at 1148 cm−1 (ν(C–N) benzenediamine units) diminished in the samples of BC–PAni-2 and BC–PAni-3. All these changes were consistent with the transformation of benzenoid units into quinoid ones, corresponding to the analysis by FT-IR.
N stretching of the quinoid diimine units, was enhanced when the BC–PAni reaction was terminated at 30 min and 60 min. The bands at 1600 cm−1 (ν(C–C) benzenoid units) and 1148 cm−1 (ν(C–N) benzenediamine units)39 appear in the spectrum of BC–PAni-1, but the bands at 1148 cm−1 (ν(C–N) benzenediamine units) diminished in the samples of BC–PAni-2 and BC–PAni-3. All these changes were consistent with the transformation of benzenoid units into quinoid ones, corresponding to the analysis by FT-IR.
 | ||
| Fig. 9 Laser Raman spectra of BC and BC–PAni. | ||
The structures of BC and BC–PAni-1 were confirmed by NMR spectroscopy, as shown in Fig. 10. The spectrum of BC, the region between 60 and 70 ppm is assigned to C6 of the primary alcohol group. The next cluster of resonances, between 70 and 80 ppm, is attributed to C2, C3, C5, and the ring carbons other than those anchoring the glycosidic linkage. The region between 80 and 95 ppm is associated with C4 and that between 100 and 110 ppm with C1, the anomeric carbon.40,41 The spectrum of sample BC–PAni-1, compared with that of BC, shows that the peak of C6 is merged with the peaks of C2, C3 and C5, the hydroxyl (–OH) of C6 may react via dehydration–condensation with PAni, leading to the C6 peak merging with the other peaks. Finally, the region between 110 and 140 ppm is assigned to the aromatic ring of PAni.42,43
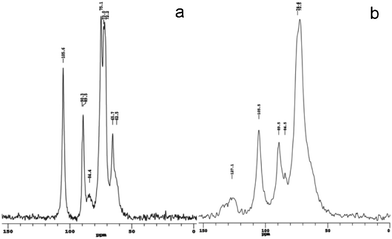 | ||
| Fig. 10 13C CPMAS NMR spectra of (a) BC and (b) BC–PAni-1 | ||
The conductivities of all samples were measured on a Potentiostats-Electrochemistry Workstation. To measure the conductance, the samples were placed between two SnO2:F electrodes; by measuring the current in a voltage range 0∼1 V or −4∼4 V, the results are shown in Fig. 11. The reaction times for the polymerizations of aniline were 5, 10, 20, 30, 60, and 120 min. The pure BC membrane is an insulator with a conductivity of 6.3 × 10⁻⁸ S cm−1. The conductivity of the BC–PAni composites rose at first and then declined with reaction time; it reached a maximum of 1.3 × 10⁻² S cm−1 when the reaction time was 30 min (Table 3). The result is corresponds to the analysis of FT-IR and laser Raman spectroscopy. The PAni was formed gradually in the network of the BC membrane; in the beginning of the reaction, aniline hydrochloride polymerized to leucomeraldine, the fully reduced state of PAni. When the reaction time was about 30 min, the BC–PAni mixtures have a structure similar to that of the emeraldine salt form, the electrical conductive form of PAni, so its conductivity reached the maximum. Afterwards, emeraldine is oxidized to pernigraniline, which made the conductivity decline.
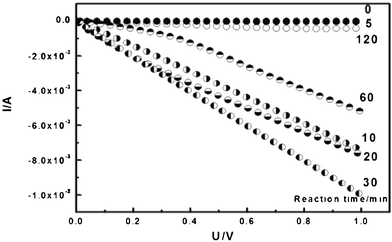 | ||
| Fig. 11 C–V characteristic curve of BC–PAni with different reaction times. (Linear sweep voltammogram of the samples between two SnO2:F electrodes from 0∼1 V.) | ||
| Reaction time (min) | 0 | 5 | 10 | 20 | 30 | 60 | 120 |
| Electrical conductivity (S cm−1) | 6.3 × 10⁻⁸ | 7.2 × 10⁻⁴ | 7.8 × 10⁻³ | 5.8 × 10⁻³ | 1.3 × 10⁻² | 4.5 × 10⁻³ | 6.7 × 10⁻⁵ |
It is well-known that PAni doped by protonic acids displays better conductivity than the undoped ones. The influence of the concentration of the protonic acids can also change and control the BC–PAni hydrogel’s conductivity. The samples were given reaction times of 30 min, then doped by 1, 0.1, 0.01, 0.001 Mol L−1 HCl solution, and doped by 0.5, 0.05, 0.005, 0.0005 Mol L−1 H2SO4 solution, respectively. Recorded linear sweep voltammograms are shown in Fig. 12, and electrical conductivity results are shown in Table 4. The sample which was undoped showed an electrical conductivity of 1.0 × 10⁻² S cm−1, when doped by 0.001 Mol L−1 HCl solution, the electrical conductivity was improved at 3.8 × 10⁻² S cm−1, and when doped by 0.0005 Mol L−1 H2SO4 solution, the electrical conductivity was improved from 2.0 × 10⁻² S cm−1 to 2.9 × 10⁻² S cm−1. Moreover, the electrical conductivity increased when the concentration of HCl/H2SO4 solution is promoted. These results suggested that the concentration of hydrogen cations also improved the conductivity of the BC–PAni hydrogel. From Table 4 it can be seen that, in the same concentration of protonic acids, the electrical conductivity of the prepared composites is: HCl > H2SO4.
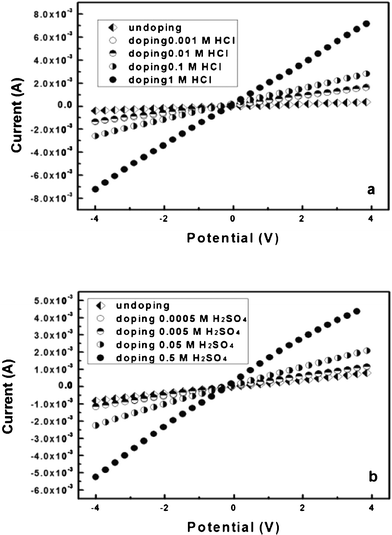 | ||
| Fig. 12 Linear sweep voltammograms recorded for hybrid BC–PAni films doped by (a) HCl solution and (b) H2SO4 solution between −4 and +4 V. | ||
| CHCl (Mol/L) | 1 | 0.1 | 0.01 | 0.001 | Undoped |
| pH | 0.01 | 0.99 | 1.99 | 2.73 | — |
| Electrical conductivity (S cm−1) | 1.8 × 10⁻¹ | 6.8 × 10⁻² | 3.7 × 10⁻² | 3.8 × 10⁻² | 1.0 × 10⁻² |
| CH2SO4 (Mol/L) | 0.5 | 0.05 | 0.005 | 0.0005 | Undoped |
| pH | 0.46 | 1.54 | 2.30 | 3.17 | — |
| Electrical conductivity (S cm−1) | 1.2 × 10⁻¹ | 5.5 × 10⁻² | 2.9 × 10⁻² | 2.9 × 10⁻² | 2.0 × 10⁻² |
Conclusions
The BC–PAni composite was successfully fabricated by in situ nano-assembly with polyaniline. PAni was polymerized and deposited as an adhering layer on the surface of the cellulose fiber. The mixture can form a relatively uniform thin-film conductive material, and its electrical conductivity can reach 10−1 S cm−1. By varying the reaction time, we can get materials with a range of conductivities, and the conductivity of polyaniline can be further improved by controlling the proton acid doping/dedoping. These favorable characteristics can be expected to make the material useful in many fields, such as flexible electrodes, flexible display devices, bio-sensors, as a platform substrate to study the effect of electrical signals on cell activities, to direct desirable cell function for tissue engineering applications, etc.Acknowledgements
This subject was supported by National Natural Science Foundation of China (20774033, 21074041), Open Project of State Key Laboratory of Supramolecular Structure and Materials (SKLSSM200708), the Natural Science Foundation of Hubei Province for Distinguished Young Scholars (2008CDB279). We thank Dr Limin Zhang and Prof. Huiru Tang of Wuhan Institute of Physics and Mathematics, The Chinese Academy of Sciences for their assistance in performing the NMR experiments. We thank Prof. Hongwei Han of Wuhan National Laboratory for Optoelectronic for his assistance in performing the conductivities experiments. And we thank analytical and testing center, Huazhong University of Science and Technology.References
- Z. Zhang, Z. Wei and M. Wan, Nanostructures of polyaniline doped with inorganic acids, Macromolecules, 2002, 35(15), 5937–5942 CrossRef CAS.
- J. Liu, Y. Lin, L. Liang, J. A. Voigt, D. L. Huber, Z. R. Tian, E. Coker, B. Mckenzie and M. J. Mcdermott, Templateless assembly of molecularly aligned conductive polymer nanowires: a new approach for oriented nanostructures, Chem.–Eur. J., 2003, 9(3), 604–611 CrossRef CAS.
- A. G. MacDiarmid, J. C. Chiang, A. F. Richter and A. J. Epstein, Polyaniline: a new concept in conducting polymers, Synth. Met., 1987, 18(1–3), 285–290 CrossRef CAS.
- D. Li, J. Huang and R. B. Kaner, Polyaniline Nanofibers: A Unique Polymer Nanostructure for Versatile Applications, Acc. Chem. Res., 2009, 42(1), 135–145 CrossRef CAS.
- P. Chandrasekhar, Conducting polymers, fundamentals and applications: a practical approach, Springer, Netherlands, 1999 Search PubMed.
- L. Hu, G. Gruner, D. Li, R. B. Kaner and J. Cech, Patternable transparent carbon nanotube films for electrochromic devices, J. Appl. Phys., 2007, 101, 016102 CrossRef.
- E. M. Genies, A. Boyle, M. Lapkowski and C. Tsintavis, Polyaniline: a historical survey, Synth. Met., 1990, 36(2), 139–182 CrossRef CAS.
- M. M. Alam, J. Wang, Y. Guo, S. P. Lee and H. R. Tseng, Electrolyte-gated transistors based on conducting polymer nanowire junction arrays, J. Phys. Chem. B, 2005, 109(26), 12777–12784 CrossRef CAS.
- J. Huang, S. Virji, B. H. Weiller and R. B. Kaner, Polyaniline nanofibers: facile synthesis and chemical sensors, J. Am. Chem. Soc., 2003, 125(2), 314–315 CrossRef CAS.
- Y. Qiao, S. J. Bao, C. M. Li, X. Q. Cui, Z. S. Lu and J. Guo, Nanostructured polyaniline/titanium dioxide composite anode for microbial fuel cells, ACS Nano, 2007, 2(1), 113–119 CrossRef.
- J. Janata and M. Josowicz, Conducting polymers in electronic chemical sensors, Nat. Mater., 2003, 2(1), 19–24 CrossRef CAS.
- D. W. Hatchett and M. Josowicz, Composites of intrinsically conducting polymers as sensing nanomaterials, Chem. Rev., 2008, 108(2), 746–769 CrossRef CAS.
- A. Guiseppi-Elie, Electroconductive hydrogels: Synthesis, characterization and biomedical applications, Biomaterials, 2010, 31(10), 2701–2716 CrossRef CAS.
- R. Jonas and L. F. Farah, Production application of microbial cellulose, Polym. Degrad. Stab., 1998, 59(1), 101–106 CrossRef CAS.
- D. Klemm, F. Kramer, S. Moritz, M. T. Lindstr, M. Ankerfors, D. Gray and A. Dorris, Nanocelluloses: A New Family of Nature-Based Materials, Angew. Chem., Int. Ed., 2011, 50(24), 5438–5466 CrossRef CAS.
- R. M. Brown and D. Montezinos, Cellulose microfibrils: visualization of biosynthetic and orienting complexes in association with the plasma membrane, Proc. Natl. Acad. Sci. U. S. A., 1976, 73(1), 143 CrossRef CAS.
- J. Shah and R. Malcolm Brown, Towards electronic paper displays made from microbial cellulose, Appl. Microbiol. Biotechnol., 2005, 66(4), 352–355 CrossRef CAS.
- D. Klemm, D. Schumann, U. Udhardt and S. Marsch, Bacterial synthesized cellulose–artificial blood vessels for microsurgery, Prog. Polym. Sci., 2001, 26(9), 1561–1603 CrossRef CAS.
- M. Iguchi, S. Yamanaka and A. Budhiono, Bacterial cellulose—a masterpiece of nature's arts, J. Mater. Sci., 2000, 35(2), 261–270 CrossRef CAS.
- W. K. Czaja, D. J. Young, M. Kawecki and R. M. Brown Jr, The future prospects of microbial cellulose in biomedical applications, Biomacromolecules, 2007, 8(1), 1–12 CrossRef CAS.
- L. Fu, Y. Zhang, J. Zhang and G. Yang, Bacterial Cellulose for Skin Repair Materials. In Biomedical Engineering–Frontiers and Challenges, Fazel-Rezai, R., Ed InTech, 2011, 249–274 Search PubMed.
- M. Tabuchi, Nanobiotech versus synthetic nanotech?, Nat. Biotechnol., 2007, 25(4), 389–390 CrossRef CAS.
- S. Ifuku, M. Nogi, K. Abe, K. Handa, F. Nakatsubo and H. Yano, Surface modification of bacterial cellulose nanofibers for property enhancement of optically transparent composites: Dependence on acetyl-group DS, Biomacromolecules, 2007, 8(6), 1973–1978 CrossRef CAS.
- M. Nogi, K. Handa, A. N. Nakagaito and H. Yano, Optically transparent bionanofiber composites with low sensitivity to refractive index of the polymer matrix, Appl. Phys. Lett., 2005, 87, 243110 CrossRef.
- M. Nogi and H. Yano, Transparent nanocomposites based on cellulose produced by bacteria offer potential innovation in the electronics device industry, Adv. Mater., 2008, 20(10), 1849–1852 CrossRef CAS.
- R. T. Olsson, M. A. S. A. Samir, G. Salazar-Alvarez, L. Belova, V. Ström, L. A. Berglund, O. Ikkala, J. Nogués and U. W. Gedde, Making flexible magnetic aerogels and stiff magnetic nanopaper using cellulose nanofibrils as templates, Nature nanotechnology, 2010, 5, 584–588 CrossRef CAS.
- S. H. Yoon, H. J. Jin, M. C. Kook and Y. R. Pyun, Electrically conductive bacterial cellulose by incorporation of carbon nanotubes, Biomacromolecules, 2006, 7(4), 1280–1284 CrossRef CAS.
- A. G. Cunha, C. Freire, A. Silvestre, C. P. Neto, A. Gandini, E. Orblin and P. Fardim, Highly hydrophobic biopolymers prepared by the surface pentafluorobenzoylation of cellulose substrates, Biomacromolecules, 2007, 8(4), 1347–1352 CrossRef CAS.
- Z. Mo, Z. Zhao, H. Chen, G. Niu and H. Shi, Heterogeneous preparation of cellulose-polyaniline conductive composites with cellulose activated by acids and its electrical properties, Carbohydr. Polym., 2009, 75(4), 660–664 CrossRef CAS.
- S. M. Ebrahim, A. B. Kashyout and M. M. Soliman, Electrical and structural properties of polyaniline/cellulose triacetate blend films, J. Polym. Res., 2007, 14(5), 423–429 CrossRef CAS.
- D. A. Schumann, J. Wippermann, D. O. Klemm, F. Kramer, D. Koth, H. Kosmehl, T. Wahlers and S. Salehi-Gelani, Artificial vascular implants from bacterial cellulose: preliminary results of small arterial substitutes, Cellulose, 2009, 16(5), 877–885 CrossRef CAS.
- J. Stejskal and R. G. Gilbert, Polyaniline. Preparation of a conducting polymer (IUPAC technical report), Pure Appl. Chem., 2002, 74(5), 857–868 CrossRef CAS.
- P. Anilkumar and M. Jayakannan, Divergent Nanostructures from Identical Ingredients: Unique Amphiphilic Micelle Template for Polyaniline Nanofibers, Tubes, Rods, and Spheres, Macromolecules, 2008, 41(20), 7706–7715 CrossRef CAS.
- N. V. Blinova, J. Stejskal, M. Trchova, G. Ciric-Marjanovic and I. Sapurina, Polymerization of aniline on polyaniline membranes, Journal of Physical Chemistry B-Condensed Phase, 2007, 111(10), 2440–2448 CAS.
- J. Yue and A. J. Epstein, XPS study of self-doped conducting polyaniline and parent systems, Macromolecules, 1991, 24(15), 4441–4445 CrossRef CAS.
- X. L. Wei, M. Fahlman and A. J. Epstein, XPS study of highly sulfonated polyaniline, Macromolecules, 1999, 32(9), 3114–3117 CrossRef CAS.
- J. C. Chiang and A. G. MacDiarmid, Polyaniline': Protonic acid doping of the emeraldine form to the metallic regime, Synth. Met., 1986, 13(1–3), 193–205 CrossRef CAS.
- E. T. Kang, K. G. Neoh and K. L. Tan, Polyaniline: A polymer with many interesting intrinsic redox states, Prog. Polym. Sci., 1998, 23(2), 277–324 CrossRef CAS.
- J. Da Silva, D. De Faria, S. de Torresi and M. Temperini, Influence of thermal treatment on doped polyaniline studied by resonance Raman spectroscopy, Macromolecules, 2000, 33(8), 3077–3083 CrossRef.
- R. H. Atalla and D. L. VanderHart, The role of solid state 13C NMR spectroscopy in studies of the nature of native celluloses, Solid State Nucl. Magn. Reson., 1999, 15(1), 1–19 CrossRef CAS.
- K. Masuda, M. Adachi, A. Hirai, H. Yamamoto, H. Kaji and F. Horii, Solid-state 13C and 1H spin diffusion NMR analyses of the microfibril structure for bacterial cellulose, Solid State Nucl. Magn. Reson., 2003, 23(4), 198–212 CrossRef CAS.
- S. Kaplan, E. M. Conwell, A. F. Richter and A. G. MacDiarmid, A solid-state NMR investigation of the structure and dynamics of polyanilines, Synth. Met., 1989, 29(1), 235–242 CrossRef.
- S. Kababya, M. Appel, Y. Haba, G. I. Titelman and A. Schmidt, Polyaniline- Dodecylbenzene Sulfonic Acid Polymerized from Aqueous Medium: A Solid State NMR Characterization, Macromolecules, 1999, 32(16), 5357–5364 CrossRef CAS.
| This journal is © The Royal Society of Chemistry 2012 |
