
Highly selective adsorption and separation of dichloromethane/trichloromethane on a copper-based metal–organic framework
Fengming Tian ,
Xinghua Zhang and
Yunlin Chen*
,
Xinghua Zhang and
Yunlin Chen*
Institute of Applied Micro-Nano Materials, School of Science, Beijing Jiaotong University, Beijing 100044, People's Republic of China. E-mail: ylchen@bjtu.edu.cn
First published on 21st March 2016
Abstract
A copper-based metal–organic framework (MOF), also known as HKUST-1, was successfully synthesized, characterized, and evaluated for selective adsorption and separation of dichloromethane (DCM) and trichloromethane (TCM). The adsorption equilibria and kinetics of DCM and TCM were systematically investigated on the HKUST-1. Results showed that HKUST-1 has a high adsorption capacity for DCM (13.12 mmol g−1) and TCM (8.53 mmol g−1) at 298 K, respectively. From the kinetics results, the diffusion coefficients of DCM and TCM in HKUST-1 were estimated to be 3.73 × 10⁻⁹ cm2 s−1 and 0.44 × 10⁻⁹ cm2 s−1 at 318 K. In addition, their binary adsorption selectivity and diffusivity selectivity were predicted via the ideal adsorbed solution theory (IAST) method. The high adsorption selectivity (3.04) and diffusivity selectivity (8.93) at 318 K and 2.8 kPa indicated that HKUST-1 is a great candidate for selective adsorption and separation of DCM and TCM. Based on these results, the mechanism of adsorption and separation process has been discussed.
1. Introduction
Chlorinated volatile organic compounds (Cl-VOCs) have been widely used in the chemical industries including the manufacturing of herbicides, pesticides, paints, solvents, and pharmaceuticals.1 Chloromethanes (CMs) are Cl-VOCs which are commonly used as solvents and reactants in numerous processes. They are also employed in the manufacture of aerosols, adhesives, and for dry cleaning. The main problem of these compounds is their high toxicity and carcinogenic character. In addition to this, they contribute to global warming, the depletion of the ozone layer, and the formation of photochemical smog. In particular, dichloromethane (DCM) and trichloromethane (TCM) are included in the list of the 17 highly dangerous chemicals targeted in the emissions reduction effort of the US Environmental Protection Agency (EPA). DCM and TCM are versatile compounds that are extensively used as solvents and intermediates in the chemical and pharmaceutical industry, dry-cleaning, and degreasing, among other applications. In consequence, their emissions have been progressively submitted to more stringent regulations. Thus, the removal of DCM and TCM is a major environmental concern. Some methods such as biological treatment, distillation, adsorption, and catalytic oxidation have been used for the removal of them.2,3 Among the removal technologies of the pollutants emitted in air, adsorption is a well-established and effective technique for the removal and recovery of Cl-VOCs from polluted air.Porous adsorbents are the key part of this technique.4 Several adsorbents have been studied for Cl-VOC removal from air streams, such as silica gel, zeolites,5 mesoporous silicate6 and activated carbons.7,8 Porous metal–organic frameworks (MOFs) have attracted great attention because they can be applied in gas storage and separation, catalysis, and chemical sensing due to their extra high surface area and pore volume as well as uniform and tunable openings.9–12 Among the reported MOFs, HKUST-1 (Cu-BTC, MOF-199) is one of the most investigated copper-based metal–organic frameworks, which consists of Cu2(COO)4 paddle wheels with copper dimers as for connectors and benzene-1,3,5-tricarboxylate as three connectors, forming a wide-open framework. Therefore, the HKUST-1 is considered to be a promising candidate as sorbent for VOCs removal.
Recently, HKUST-1 has been widely used for gas adsorption and separation. CO2/H2O adsorption equilibrium13 and benzene/water vapor competitive adsorption were studied on the HKUST-1.14 Adsorption of NH3 and toluene on HKUST-1 were studied.15,16 Noble gas adsorption in HKUST-1 was studied by experimental and computational method.17 To the best of the authors' knowledge, HKUST-1 has not been studied in details for DCM and TCM adsorption including adsorption equilibrium at different temperatures, adsorption kinetics, isosteric heat of adsorption, and diffusion of DCM and TCM in HKUST-1. In addition, HKUST-1 consists of two types of pores, including large 9 Å cavities and small 5 Å tetrahedral pockets, which has molecular sieve effect on adsorption and separation of DCM (3.3 Å) and TCM (6.5 Å).
In this work, we have synthesized and characterized a highly porous HKUST-1 to examine the adsorption and diffusion properties of DCM and TCM in the HKUST-1. The equilibrium data were obtained at (298, 308, and 318) K with the pressure up to their saturated vapor pressure for DCM and TCM. The Dual-Site Langmuir (DSL) isotherm model and Langmuir model were employed to correlate the adsorption isotherms. Their isosteric heat of adsorption and diffusion coefficients were estimated based on the adsorption equilibrium and kinetics data. Meanwhile, the adsorption selectivity and kinetic selectivity of the HKUST-1 for DCM/TCM vapor were estimated by using IAST method. From these data, we also systematically discussed the adsorption mechanism of competition adsorption between DCM and TCM on the HKUST-1.
2. Materials and methods
2.1. Synthesis of HKUST-1
The uniform crystals of HKUST-1 were synthesized by using an optimized procedure.18 A solution of Cu(NO3)2·3H2O (3.0 mmol) and BTC (2.0 mmol) was prepared by dissolving them in a water/ethanol solution (24 mL/24 mL). This mixture was defined as the standard solution. Subsequently, the mixed solution was transferred to a 100 mL Teflon-lined autoclave to allow crystal growth at 393 K for 24 h. After crystallization, the particles were isolated by centrifugation and washed for several times with deionized water and ethanol. The resulting solid was dried overnight at ambient temperature before further analysis.2.2. Characterization
Nitrogen adsorption and desorption isotherms, Langmuir area and Brunauer–Emmet–Teller (BET) surface area of the samples were measured by Quadrasorb SI at liquid nitrogen temperature of 77 K. Prior to gas adsorption measurements, the samples were activated by a high temperature at 423 K under a reduced pressure, a color change from blue to purple occurred on HKUST-1 upon removal of the solvent molecules. X-ray diffraction (XRD) was carried out on a Rigaku D/Max-2500 X-ray diffractometer at 40 kV, 120 mA with a scan speed of 10° min−1 and a step size of 0.02° in 2θ range from 5° to 20°, using Cu Kα radiation (wavelength λ = 0.1543 nm). Optical Microscope (OM) studies were conducted with 6XB-PC microscope. Scanning electron microscopy (SEM) studies were conducted with a HITACHI S-4800 SEM (Japan) operating at an accelerating voltage of 10 kV and 10 μA after gold deposition.2.3. Measurements of adsorption isotherms of DCM and TCM
The adsorption isotherms of DCM and TCM (>99.9%, from Shanghai HPLC) on the HKUST-1 crystals were measured using a standard gravimetric method with Intelligent Gravimetric Analyser (IGA-003, HIDEN). The IGA-003 is equipped with an ultra-sensitive balance of resolution 0.2 mg mounted in the thermostated heat sink with high precision temperature control. About 60–70 mg samples was weighted for each run. Prior to the measurements, the sample in the vessel of the IGA-003 was vacuumed up to 3–5 Pa at 423 K for 24 h to remove any residual guests, i.e. the adsorbed water, and gases. After that, isotherms of DCM and TCM on the sample were measured at (298, 308, and 318) K. The highest adsorption pressure was the saturated vapor pressures at the corresponding temperatures. The equilibrium and instantaneous uptakes of DCM and TCM on the sample can be calculated as follows:
where M (g mol−1) is the molecular weight of DCM or TCM molecule; We (g) and Wt (g) are the amount of adsorbent (HKUST-1) at equilibrium and time t (min); Wa (g) is the initial weight of the sample (HKUST-1); and Qe (mmol g−1) and Qt (mmol g−1) are the DCM or TCM amount adsorbed per gram of adsorbent at equilibrium and at time t (min), respectively. Kinetic data were collected at the same time when the isotherms were measured.

3. Results and discussion
3.1. Physical characteristics
The HKUST-1 adsorbent was characterized with nitrogen adsorption for pore textural properties, X-ray powder diffraction for phase structure, and scanning electron microscopy for morphology and particle size.Pore textural properties for HKUST-1 were calculated from the nitrogen adsorption–desorption isotherms plotted in Fig. 1a. The corresponding pore size distribution for HKUST-1 was shown in Fig. 1b. The N2 adsorption isotherm on HKUST-1 is of typical type I profile with a sharp increase in the nitrogen uptake (at low nitrogen relative pressure) followed by a plateau at high pressures. Its Langmuir surface area, BET surface area, and pore volume is 2562.53 m2 g−1, 2326.87 m2 g−1 and 0.81 cm3 g−1, respectively.
 | ||
| Fig. 1 (a) Nitrogen sorption isotherm of the HKUST-1 crystals at 77 K; (b) pore size distribution of the HKUST-1 crystals calculated by HK method. | ||
In differential pore volume plot of the HKUST-1, two sharp peaks are observed at about ∼6.1 Å and ∼8.5 Å, as shown in Fig. 1b. The uniform microporous structure of the synthesized HKUST-1 indicates the high crystallinity of the synthesized HKUST-1. Besides, we can see that obtained pore size is slightly different from its crystallographic data. In ref. 17, single-crystal data have shown that the HKUST-1 contain an intersecting three-dimensional (3D) system of large square-shaped pores (9 × 9 Å). This tiny difference may be caused by the different testing methods and/or sample post-activation processes.
Fig. 2 shows the XRD pattern of the synthesized HKUST-1 crystals along with a simulated diffraction for calculated using the Mercury software package (Cambridge Crystallographic Data Centre) and a crystallographic file from the Cambridge Structural Database. The XRD pattern of the synthesized HKUST-1 sample is identical to the simulated one and those of the experiment one,18,19 which confirms the successful synthesis of high purity and high crystallinity of the HKUST-1 sample in this work. Optical Microscope (OM) image and scanning electron microscope (SEM) image were used to investigate the morphologies, crystallinity, and microstructures of the synthesized HKUST-1 crystals (shown in Fig. 3). The synthesized HKUST-1 blue crystals have an octahedral morphology and uniform size of 15–20 μm. The well facetted crystals with uniform crystals size have clean and smooth surface. It is illustrated that our synthesized HKUST-1 crystals depict a perfect crystallization with high purity.
 | ||
| Fig. 2 XRD pattern of the synthesized HKUST-1 crystals. | ||
 | ||
| Fig. 3 Optical Microscope (OM) image and scanning electron microscope (SEM) image of the synthesized HKUST-1 crystals. | ||
3.2. Adsorption equilibrium
Adsorption isotherms of DCM and TCM in HKUST-1 at (298, 308, and 318) K are plotted in Fig. 4a and b. All the adsorption isotherms exhibit type-I isotherm with a sharp increase section followed by a plateau, suggesting strong interaction between the HKUST-1 and Cl-VOCs. | ||
| Fig. 4 (a) Adsorption isotherms of DCM on the HKUST-1 and the fittings of DSL equation at 298–318 K; (b) adsorption isotherms of TCM on the HKUST-1 and the fittings of Langmuir equation at 298–318 K. | ||
It was observed that at room temperature (298 K) HKUST-1 has the highest adsorption amount of 13.12 mmol g−1 for DCM, which is much higher than that of activated carbon (1.88 mmol g−1)20 and that of dealuminated faujasite Y (DAY) zeolite at 298 K (3.18 mmol g−1).21 Under lower pressure, however, the HKUST-1 shows an obvious higher adsorption capacity than the other porous adsorbents. It can be mainly attributed to the uniform micropore structure and of HKUST-1. Hence, this microporous MOF exhibits excellent adsorption behavior at low concentration levels and may become one of the promising candidates for Cl-VOCs capture applications. It is clearly visible that the maximum adsorption capacity of the HKUST-1 for TCM is up to 8.53 mmol g−1 at 298 K, which is much higher than that of activated carbon at 300.15 K (4.8 mmol g−1)22 and that of Na–Y5.5 zeolite at 303 K (3 mmol g−1).23 The higher adsorption capacity of DCM and TCM on HKUST-1 is attributed to the much larger specific surface area of HKUST-1 (BET of 2326.87 m2 g−1). Meanwhile, the adsorption capacity of DCM and TCM on the HKUST-1 is slightly decreased with temperature increasing, which indicates a physisorption-type interaction.16
To further study the adsorption behavior of DCM and TCM on the HKUST-1 sample, both the Dual-Site Langmuir (DSL) equation and Langmuir equation were applied to fit the experimental isotherm data. The Langmuir isotherm is written as
 | (1) |
Dual-Site Langmuir (DSL) equation was applied to fit the experimental equilibrium isotherm data of DCM. The DSL model was derived from statistical thermodynamics and assumes that a molecule can adsorb on two sites (A and B) with different adsorption nature, reflecting in this way the surface heterogeneity of the framework. The adsorption on sites A and B follows a Langmuir behavior, as described in eqn (2)
 | (2) |
Fig. 4a and b exhibit the comparisons of the experimental equilibrium adsorption data and the isotherm equation fits. It is visible that the DSL equation gives a better fit to the experimental equilibrium adsorption data of DCM. Table 1 gives the fitting parameters of the DSL isotherm for DCM as well as their linear correlation coefficients (R2) representing coincidence degree between the experimental data and the isotherm equation fits.
| T (K) | am,A (mmol g−1) | bA (kPa−1) | am,B (mmol g−1) | bB (kPa−1) | R2 |
|---|---|---|---|---|---|
| 298 | 11.174 | 0.882 | 4.350 | 0.018 | 0.998 |
| 308 | 10.843 | 0.695 | 6.892 | 0.005 | 0.999 |
| 318 | 9.786 | 0.533 | 4.535 | 0.002 | 0.998 |
It is visible that the Langmuir equation gives a better fit to the experimental equilibrium adsorption data of TCM. Table 2 gives the fitting parameters of the Langmuir isotherm for TCM as well as their linear correlation coefficients (R2). The data in Tables 1 and 2 indicate that the linear correlation coefficients (R2) of the both isotherm equations fit are all above 0.99. It demonstrates that the DSL adsorption model and Langmuir adsorption model can well describe the adsorption behavior of DCM and TCM on the HKUST-1.
| T (K) | am (mmol g−1) | b (kPa−1) | R2 |
|---|---|---|---|
| 298 | 9.220 | 0.496 | 0.997 |
| 308 | 8.573 | 0.274 | 0.996 |
| 318 | 8.315 | 0.156 | 0.998 |
As shown in Tables 1 and 2, the value of b also depicts a downtrend as the temperature increase. It is indicated that adsorption interaction of the HKUST-1 towards DCM and TCM becomes weaker as the temperature increases.24 The strength of the affinity between the adsorbate and the adsorbent surface can be given by the values of Henry constants. In the Henry's law region, i.e. at low pressures, the interactions between the adsorbed molecules are negligible. In the Henry's law region the adsorption loading is directly proportional to the pressure:
| q = KHp | (3) |
| q = am,AbAp + am,BbBp | (4) |
Consequently, and combining eqn (3) with eqn (4), the following relation is obtained:
| KH = am,AbA + am,BbB | (5) |
As shown in Table 3, the Henry's constants decrease with increasing temperature, as expected, refiecting the decrease of adsorbate–adsorbent affinity with temperature. DCM possesses the larger Henry's constants than TCM at the three temperatures, revealing its strongest interaction with the HKUST-1 framework due to the smaller kinetic diameter compared with TCM.
| Temperature (K) | KH | αD/T | |
|---|---|---|---|
| DCM | TCM | ||
| 298 | 9.942 | 4.576 | 2.172 |
| 308 | 7.580 | 2.354 | 3.219 |
| 318 | 5.233 | 1.301 | 4.021 |
The selectivity of DCM/TCM mixtures in HKUST-1 was also estimated using IAST based on the pure adsorption equilibrium DSL model fitting parameters. Assuming an equilibrium based separation, the adsorbents can be chosen by the separation factor, α1/2. Thus, this separation factor, also known as ideal selectivity, represents the affinity of the adsorbent for a species 1 over a species 2 and can be calculated by the following equation:
 | (6) |
Adsorption selectivity in a binary be defined as:
 | (7) |
![[thin space (1/6-em)]](https://www.rsc.org/images/entities/char_2009.gif) :1 (a typical composition of chloromethane industrial process) at 298 K, 308 K, and 318 K and pressures up to 40 kPa. For all temperatures, the selectivity decreases as the total pressure increases. Thus, the temperature can significantly affect the Sads,DCM/TCM in this system, showing an increase of Sads,DCM/TCM with temperature. The value of Sads,DCM/TCM is increased from 1.73 to 3.04 when the temperature is raised from 298 to 318 K. It is implied that the competitive interaction of the framework with DCM against TCM is increased, and thus HKUST-1 is more selective for DCM than TCM with temperature.
:1 (a typical composition of chloromethane industrial process) at 298 K, 308 K, and 318 K and pressures up to 40 kPa. For all temperatures, the selectivity decreases as the total pressure increases. Thus, the temperature can significantly affect the Sads,DCM/TCM in this system, showing an increase of Sads,DCM/TCM with temperature. The value of Sads,DCM/TCM is increased from 1.73 to 3.04 when the temperature is raised from 298 to 318 K. It is implied that the competitive interaction of the framework with DCM against TCM is increased, and thus HKUST-1 is more selective for DCM than TCM with temperature.
 | ||
| Fig. 5 (a) Adsorption selectivity of 0.66/0.33 DCM/TCM binary mixtures on HKUST-1 at 298–318 K; (b) adsorption selectivity of DCM/TCM mixtures of 0.50/0.50, 0.66/0.33, and 0.33/0.66 at 298 K. | ||
In Fig. 5b, the ideal selectivity of the HKUS-1 for DCM over TCM from 0.50/0.50 DCM/TCM, 0.66/0.33 DCM/TCM, and 0.33/0.66 DCM/TCM mixtures is illustrated as a function of the total pressure. For all the three mixtures, the ideal selectivity decrease with the total pressure. With the increase of system pressure, the DCM/TCM selectivity decreases because the adsorption competition between DCM and TCM towards limited sorption sites intensifies at higher pressures. For all three mixtures, the selectivity decreases with the total pressure up to 5 kPa and above 5 kPa, selectivities for the three cases remained practically constant. The selectivity of DCM/TCM gradually decreases with increasing pressure at the same temperature. The decreasing Sads,DCM/TCM is mainly attributed to a variety of competitive interactions of the HKUST-1 towards DCM and TCM molecules. It indicates a decreasing competitive interaction of the framework with DCM against TCM as pressure increases.
3.3. Isosteric heat of adsorption
Isosteric heat of adsorption is also an important parameter to evaluate the interaction between the adsorbate molecules and the adsorbent surface through physical adsorption. The isosteric heat of adsorption can be obtained from the van't Hoff's equation
 | (8) |
 | (9) |
In the present study, DCM and TCM adsorption isotherms at 298, 308, and 318 K were used to calculate the heat of adsorption plots. The adsorption isotherms were first converted to adsorption isosteres, i.e., a plot of ln(P/P0) versus 1/T at a given adsorption amount (Fig. 6a and b). The heat of adsorption was then calculated from the slopes of the isosteres according to eqn (9).
 | ||
| Fig. 6 (a) ln(P/P0) versus 1/T for estimation of isosteric adsorption heats of DCM on HKUST-1; (b) ln(P/P0) versus 1/T for estimation of isosteric adsorption heats of TCM on HKUST-1; (c) dependence of isosteric adsorption heat on the amounts adsorbed of DCM on HKUST-1; (d) dependence of isosteric adsorption heat on the amounts adsorbed of TCM on HKUST-1. | ||
Fig. 6c shows the isosteric heat of DCM adsorption on the HKUST-1 as a function of the amounts DCM adsorbed. Note that the values of DCM are from 46.00 kJ mol−1 to 31.28 kJ mol−1, essentially decreasing with increasing amount adsorbed from 5.0 to 11.0 mmol g−1. Fig. 6d shows the isosteric heat of TCM adsorption on the HKUST-1 as a function of the amounts adsorbed of TCM. The values of heats of adsorption for TCM for HKUST-1 decrease significantly with the adsorption amount, and the maximum value of 30.08 kJ mol−1 was observed at the lowest adsorption loading 2 mmol g−1. Note that the values of TCM are from 30.08 kJ mol−1 to 14.17 kJ mol−1, essentially decreasing with increasing amount adsorbed from 2.0 to 7.0 mmol g−1.
The heats of adsorption of TCM in HKUST-1 (18.22 kJ mol−1) is smaller than that DCM in HKUST-1 (46.00 kJ mol−1) at the adsorption amount of 5 mmol g−1. The heats of adsorption of TCM in HKUST-1 (14.17 kJ mol−1) is smaller than that DCM in HKUST-1 possesses a narrow micropore size distribution with nanoscale aperture windows. Meanwhile, the value of the isosteric heat falls in the range of the adsorption heat of physisorption adsorption.
3.4. Adsorption kinetics
Adsorption kinetics and diffusion coefficient are very important parameters for evaluating an adsorbent and designing an adsorption process. Up to now, adsorption kinetics of DCM and TCM on the HKUST-1 has rarely been reported.Fig. 7a shows the fractional uptake curves of DCM on the HKUST-1 at different feed pressures (0.6, 2.8, and 5.8 kPa) and 298 K. It is clearly visible that for a given pressure range, these fractional uptake curves nearly overlap with each other. Similar phenomena are also observed at 308 K and 318 K, which are not showed here. That is to say, the loading of DCM has negligible influence on diffusivity of DCM within the HKUST-1. Fig. 7b shows the fractional uptake curves of DCM on the HKUST-1 at different temperatures (298, 308, and 318 K) and 2.8 kPa. It can be seen that the temperature has great effect on the diffusivity of DCM within HKUST-1, and the higher temperature results in faster adsorption of DCM.
 | ||
| Fig. 7 (a) Fractional uptakes of DCM adsorption on the HKUST-1 at different feed pressures (0.6, 2.8, 5.8 kPa) and 298 K; (b) fractional uptakes of DCM adsorption on the HKUST-1 at different temperatures (298, 308, 318 K) and 2.8 kPa; (c) fractional uptakes of TCM adsorption on the HKUST-1 at different feed pressures (2.8, 4.2, 5.6, and 7.0 kPa) and 298 K; (d) fractional uptakes of TCM adsorption on the HKUST-1 at different temperatures (298, 308, 318 K) and 2.8 kPa. | ||
Fig. 7c shows the fractional uptake curves of TCM on the HKUST-1 sample at different feed pressures (2.8, 4.2, 5.6, and 7.0 kPa) and 298 K. It is clearly visible that for a given pressure range, these fractional uptake curves are nearly overlapping. Similar phenomena are also observed at 308 K and 318 K. That is to say, the loading of TCM has negligible influence on diffusivity of TCM within the HKUST-1 sample. Fig. 7d shows the fractional uptake curves of TCM on the HKUST-1 sample at different temperatures (298, 308, and 318 K) and 2.8 kPa. It can be seen that the three adsorption kinetic curves at different temperatures are obviously different, and the higher temperature results in faster adsorption of TCM. It indicates the temperature has stronger effect on the diffusivity of TCM within HKUST-1. In Fig. 8, it is clear that DCM reached the adsorption saturation level in a shorter interval of time (within 100 min) in comparison to TCM (within 240 min) at 2.8 kPa and 298 K.
 | ||
| Fig. 8 Fractional uptakes of DCM and TCM adsorption on the HKUST-1 at 2.8 kPa and 298 K. | ||
A classical micropore diffusion model25 was applied to correlate the adsorption kinetic data and obtain the intracrystalline diffusivity for DCM and TCM in HKUST-1. Assuming that the adsorbent is a spherical particle and neglecting the heat transfer between particle and surrounding fluid, the transient fractional uptakes can be described by following equation in the range of fractional uptake less than 70%:
 | (10) |
 , a straight line will be obtained and its slope indicates the diffusion time constant (Dc/rc2, s−1) can be determined. In the present work, rc of HKUST-1 (rc = 7.5 × 10⁻⁶ m) was estimated from their SEM images. Once the rc is known, the diffusion coefficient (Dc, cm2 s−1) can be determined. Fig. 9 shows the plots of the fractional uptakes of DCM and TCM adsorption against the square root of adsorption time at different temperatures (298, 308, and 318 K) with the same pressure 2.8 kPa. It can be seen from Fig. 9a that the fits of the three groups of experiment data (with correlation coefficients R2 is more than 0.99), indicating that the DCM and TCM diffusion within the HKUST-1 can be well described by eqn (10).
 | ||
| Fig. 9 (a) Plots of the fractional uptakes of DCM adsorption against the square root of adsorption time at different temperatures (298, 308, and 318 K) and at 2.8 kPa; (b) plots of the fractional uptakes of TCM adsorption against the square root of adsorption time at different temperatures 298, 308, and 318 K and at 2.8 kPa. | ||
From the slopes of these fitting straight lines shown by Fig. 9, the diffusion time constants and diffusion coefficients of DCM and TCM within the HKUST-1 are obtained, as listed in Table 4. The data in Table 4 show that the diffusion time constants (Dc/rc2) of DCM on the HKUST-1 at 298–318 K are in the range of 1.93–6.63 × 10⁻³ s−1. The data in Table 4 show that the diffusion time constants (Dc/rc2) of TCM on the HKUST-1 at 298–318 K are in the range of 0.39–0.79 × 10⁻³ s−1. Since the average particle radius rc of the HKUST-1 samples is 7.5 μm, the diffusion coefficients (Dc) of DCM and TCM on the HKUST-1 at 298–318 K can be found out to be in range of 1.08–3.73 × 10⁻⁹ cm2 s−1 and 0.22–0.44 × 10⁻⁹ cm2 s−1, respectively. In addition, Table 4 indicates that both the diffusion time constants and the diffusion coefficients increase obviously with temperature, which indicates that the diffusion rate can be enhanced by increasing the temperature properly.
| Cl-VOCs | Temperature (K) | Dc/rc2 (10−3 s−1) | Dc (10−9 cm2 s−1) | R2 |
|---|---|---|---|---|
| DCM | 298 | 1.925 | 1.083 | 0.999 |
| 308 | 3.801 | 2.138 | 0.999 | |
| 318 | 6.630 | 3.729 | 0.998 | |
| TCM | 298 | 0.393 | 0.221 | 0.999 |
| 308 | 0.641 | 0.361 | 0.999 | |
| 318 | 0.790 | 0.444 | 0.999 |
The plots of variation of diffusion coefficient with temperature for DCM and TCM are shown in Fig. 10. The DCM diffusivities in HKUST-1 is in the order of 10−9 cm2 s−1, and TCM diffusivities in HKUST-1 is in the order of 10−10 cm2 s−1. It is observed that both of DCM and TCM diffusivities in HKUST-1 increases with an increase in temperature, while the different increasing trend observed between DCM and TCM as shown in Fig. 10.
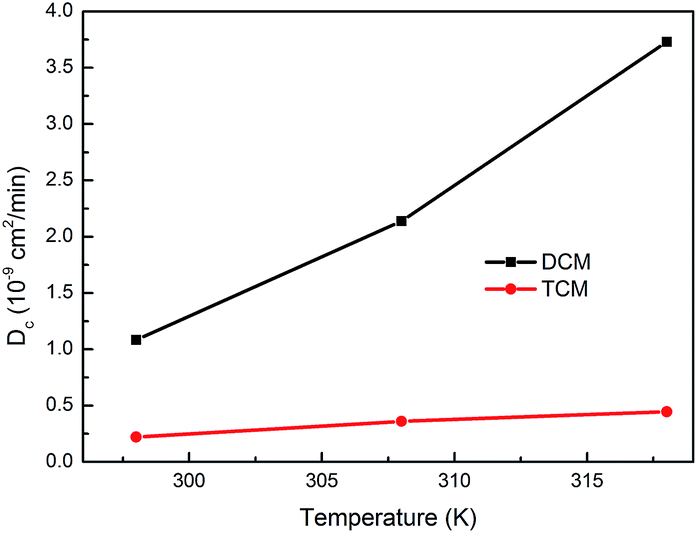 | ||
| Fig. 10 Variation of diffusion coefficient with temperature increasing from 298 K to 318 K at 2.8 kPa for DCM and TCM. | ||
Diffusion selectivity can be defined by:26
| Sdiff,1/2 = D1,self/D2,self | (11) |
For membrane processes the permeation selectivity, Sperm,1/2 can be expressed as follows:
| Sperm,1/2 = Sads,1/2 × Sdiff,1/2 | (12) |
Then from eqn (12), we can get the permeation selectivity of DCM over TCM vapor on the HKUST-1 membrane of about 27.15 by using Sads,DCM/TCM of 3.04 and Sdiff,DCM/TCM of 8.93 under very similar conditions (∼318 K and 2.8 kPa).
3.5. Adsorption activation energy
The Arrhenius equation can usually be applied to estimate adsorption/diffusion activation energy of an adsorbate on an adsorbent. According to the Arrhenius equation, the relationship between the diffusion coefficient (Dc) of the adsorbate and the activation energy (Ea) for adsorption within the HKUST-1 is represented by following equation:
 | (13) |
 | (14) |
Then, the Arrhenius plot of lnDc versus 1/T can be obtained on the basis of eqn (14), as shown by Fig. 11. The adsorption activation energy Ea of DCM and TCM on the HKUST-1 can be calculated from the slope of the fitting line in Fig. 11. The value of the adsorption activation energy for DCM is 48.737 kJ mol−1, which is higher than the adsorption activation energy for TCM (27.633 kJ mol−1), suggesting TCM molecules can adsorbed on the framework of the HKUST-1 much easier than DCM molecules.
 | ||
| Fig. 11 (a) Arrhenius plot of DCM diffusivity in the HKUST-1; (b) Arrhenius plot of TCM diffusivity in the HKUST-1. | ||
3.6. Adsorption mechanism
Based on these results, we also systematically discussed the adsorption mechanism of selectively adsorption of DCM over TCM on HKUST-1 from the molecular sieving effect, thermodynamic equilibrium effect and kinetic effect.27Fig. 12 shows the crystal structures of HKUST-1 considered in this study, constructed from the experimental crystallographic data.28,29 The HKUST-1 framework is composed of copper atoms connected by BTC linkers, which form a characteristic paddle-wheel structure: two copper atoms bonded to the oxygen atoms of four BTC linkers. The framework consists of two types of large 9 Å cavities (L1 and L2) and small 5 Å tetrahedral pockets (T1). There are eight such tetrahedral pockets per unit cell. The larger cavities (L1 and L2) are similar in size and shape, but as a result of the paddle-wheel, the copper atoms are only accessible from the L2 cages. L1 and L2 cavities are connected by 9 Å windows. The small cavities (T1) are tetrahedral pockets enclosed by the benzene rings. They are connected to L2 cages by 4.6 Å triangular windows.30,31
 | ||
| Fig. 12 Unit cell of the HKUST-1 highlights the main volumes available for adsorption. Orange sphere: big cage (inner surface: benzene rings)-site L1, green sphere: big cage (inner surface: hydrogen atom of the BTC linker)-site L2, blue sphere: octahedral cage (5 Å)-site T1. Carbon atoms are represented in gray, copper in yellow, oxygen in red and hydrogen in white. | ||
Size/shape exclusion, also known as steric separation, is common in zeolites and molecular sieves. For such a given porous adsorbent, both the cross-sectional size and the shape of the adsorbate molecule are the ultimate factors affecting selective adsorption. This is because the kinetic diameter of DCM is 3.3 Å, which is slightly smaller than both kinds of pores of HKUST-1 (9.0 Å and 5.0 Å). However, the kinetic diameter of TCM is 6.5 Å, which is smaller than the big pore of diameter 9.0 Å but larger than the small pore of diameter of 5.0 Å. Hence, selectivity arises for the steric hindrance for TCM molecules diffusing into the T1 pocket.
Besides the molecular sieving effect, open metal sites in HKUST-1 take an important role in the selectivity of forming bonds of DCM. For equilibrium separation, small pore T1 can only accommodates DCM molecules but large pores of L1 and L2 are large enough to allow both DCM and TCM molecules to pass, so the interaction between the adsorbate and adsorbent surface is crucial in determining the adsorption selectivity. There is a small dipole moment in the DCM and TCM molecule with the negative end on the chlorine atom that may be strongly attracted to the copper atom with open metal sites in the HKUST-1. In the previous work, the isosteric adsorption heat of DCM and TCM on the HKUST-1 were calculated to be within the range of 46.00 to 31.28 kJ mol−1 and 30.08 to 14.17 kJ mol−1, indicating that DCM has a stronger interaction with the HKUST-1. Therefore, the electrostatic interactions between DCM and HKUST-1 adsorbed both in small pore and large pore is stronger than that of TCM only adsorbed in large pore, which clearly dominate the adsorption selectivity.
In addition, diffusion selectivity is a main indicator for kinetic separation. It has been recognized that for kinetic separation the pore size of the adsorbent needs to be precisely controlled between the kinetic diameters of the two molecules that need to be separated. In the previous work, adsorption kinetics of DCM and TCM on the HKUST-1 were investigated, and the diffusion coefficients of DCM and TCM in the HKUST-1 adsorbent at 318 K were estimated to be 3.73 × 10⁻⁹ cm2 s−1 and 0.44 × 10⁻⁹ cm2 s−1, suggesting that DCM has relatively faster adsorption rate than TCM in HKUST-1. It is due to the kinetic diameter of DCM (0.33 nm) is much smaller than TCM (0.65 nm), which might have facilitated its diffusion in both small pore T1 and large pore L1 and L2 of HKUST-1. Moreover, it is found that the selectivity of DCM/TCM vapor in the membrane-assisted separation process will be much higher than that in the adsorption process due to the great discrepancy of diffusion behavior between DCM and TCM vapor in the HKUST-1.
Herein, it seems that no individual dominating factor could control the selectivity adsorption and separation. Thus, the adsorbent selection is a complex problem since one must consider both the properties of the adsorbents and adsorbates and the adsorption and separation process. When the process is not considered, the adsorbent choice is essentially guided by the size and shape of the adsorbate molecule along with its polarizability, dipole moment, and quadrupole moment. Considering adsorption process, the formation of weak chemical bonds, such as H-bonds and π-complexation bonds between adsorbate molecules and adsorbent is also useful for a lot of important separations and purifications. This work may form the basis for further adsorbent selection and development of adsorption process of high adsorption selectivity and diffusion selectivity.
4. Conclusions
In summary, HKUST-1 has been proved to be a great candidate for highly selective adsorption and separation of DCM and TCM. The adsorption equilibria and kinetics of DCM and TCM were systematically investigated on the HKUST-1. The adsorption capacity of DCM and TCM were up to 13.12 mmol g−1 and 8.53 mmol g−1 at 298 K, which were much higher than those of some other adsorbents such as the activated carbon and zeolite. The isotherms of DCM and TCM on HKUST-1 can be well described by DSL model and Langmuir model, respectively. The isosteric adsorption heat of DCM and TCM on the HKUST-1 were calculated to be within the range of 46.00 to 31.28 kJ mol−1 and 30.08 to 14.17 kJ mol−1, indicating that DCM has a stronger interaction with the HKUST-1. Adsorption kinetics of DCM and TCM on the HKUST-1 were investigated, and the diffusion coefficients of DCM and TCM in the HKUST-1 adsorbent at 318 K were estimated to be 3.73 × 10⁻⁹ cm2 s−1 and 0.44 × 10⁻⁹ cm2 s−1, suggesting that DCM has relatively faster adsorption rate than TCM in HKUST-1. The binary adsorption selectivity and diffusivity selectivity of DCM/TCM on HKUST-1 were predicted via IAST method to be 3.04 and 8.93 at 318 K and 2.8 kPa, respectively. Based on these results, we also systematically discussed the adsorption mechanism of selectively adsorption of DCM over TCM on HKUST-1 from the synergy among open metal site in HKUST-1 and molecular size of DCM and TCM, as well as the gas-framework electrostatic interactions. Furthermore, it is viable for the deep understanding of the selectively adsorption and separation of DCM and TCM within HKUST-1. This work may form the basis for further adsorbent selection and development of adsorption process and will aid in separation technology development using MOFs.Acknowledgements
This work was supported by the National Natural Science Foundation of China No. 21376026.References
- B. Huang, C. Lei, C. Wei and G. Zeng, Environ. Int., 2014, 71, 118–138 CrossRef CAS PubMed.
- A. Michalik-Zym, R. Dula, D. Duraczyńska, J. Kryściak-Czerwenka, T. Machej, R. P. Socha, W. Włodarczyk, A. Gaweł, J. Matusik, K. Bahranowski, E. Wisła-Walsh, L. Lityńska-Dobrzyńska and E. M. Serwicka, Appl. Catal., B, 2015, 174–175, 293–307 CrossRef CAS.
- P. Yang, X. Xue, Z. Meng and R. Zhou, Chem. Eng. J., 2013, 234, 203–210 CrossRef CAS.
- Z. Zhao, S. Wang, Y. Yang, X. Li, J. Li and Z. Li, Chem. Eng. J., 2015, 259, 79–89 CrossRef CAS.
- B. T. Clausse, B. Garrot, C. Cornier, C. Paulin, M. Simonot-Grange and F. Boutros, Microporous Mesoporous Mater., 1998, 25, 169–177 CrossRef CAS.
- J. W. Lee, J. W. Lee, W. G. Shim, S. H. Suh and H. Moon, J. Chem. Eng. Data, 2003, 48, 381–387 CrossRef CAS.
- S. Hsu, C. Huang, T. Chung and S. Gao, J. Taiwan Inst. Chem. Eng., 2014, 45, 2526–2530 CrossRef CAS.
- J. Lemus, M. Martin-Martinez, J. Palomar, L. Gomez-Sainero, M. A. Gilarranz and J. J. Rodriguez, Chem. Eng. J., 2012, 211–212, 246–254 CrossRef CAS.
- H. Furukawa, N. Ko, Y. B. Go, N. Aratani, S. B. Choi, E. Choi, A. O. Yazaydin, R. Q. Snurr, M. O'Keeffe, J. Kim and O. M. Yaghi, Science, 2010, 329, 424–428 CrossRef CAS PubMed.
- Z. Zhang, Y. Chen, X. Xu, J. Zhang, G. Xiang, W. He and X. Wang, Angew. Chem., Int. Ed., 2014, 53, 429–433 CrossRef CAS PubMed.
- Y. H. Hu and L. Zhang, Adv. Mater., 2010, 22, E117–E130 CrossRef CAS PubMed.
- K. Sumida, D. L. Rogow, J. A. Mason, T. M. McDonald, E. D. Bloch, Z. R. Herm, T. Bae and J. R. Long, Chem. Rev., 2012, 112, 724–781 CrossRef CAS PubMed.
- J. Liu, Y. Wang, A. I. Benin, P. Jakubczak, R. R. Willis and M. D. LeVan, Langmuir, 2010, 26, 14301–14307 CrossRef CAS PubMed.
- Z. Zhao, S. Wang, Y. Yang, X. Li, J. Li and Z. Li, Chem. Eng. J., 2015, 259, 79–89 CrossRef CAS.
- E. Borfecchia, S. Maurelli, D. Gianolio, E. Groppo, M. Chiesa, F. Bonino and C. Lamberti, J. Phys. Chem. C, 2012, 116, 19839–19850 CAS.
- F. Xu, S. Xian, Q. Xia, Y. Li and Z. Li, Adsorpt. Sci. Technol., 2013, 31, 325–339 CrossRef CAS.
- Z. Hulvey, K. V. Lawler, Z. Qiao, J. Zhou, D. Fairen-Jimenez, R. Q. Snurr, S. V. Ushakov, A. Navrotsky, C. M. Brown and P. M. Forster, J. Phys. Chem. C, 2013, 117, 20116–20126 CAS.
- L. H. Wee, M. R. Lohe, N. Janssens, S. Kaskel and J. A. Martens, J. Mater. Chem., 2012, 22, 13742–13746 RSC.
- E. Biemmi, S. Christian, N. Stock and T. Bein, Microporous Mesoporous Mater., 2009, 117, 111–117 CrossRef CAS.
- S. Hsu, C. Huang, T. Chung and S. Gao, J. Taiwan Inst. Chem. Eng., 2014, 45, 2526–2530 CrossRef CAS.
- B. T. Clausse, B. Garrot, C. Cornier, C. Paulin, M. Simonot-Grange and F. Boutros, Microporous Mesoporous Mater., 1998, 25, 169–177 CrossRef CAS.
- W. G. Shim, J. W. Lee and H. Moon, J. Chem. Eng. Data, 2003, 48, 286–290 CrossRef CAS.
- T. Kawai, T. Yanagihara and K. Tsutsumi, Colloid Polym. Sci., 1994, 272, 1620–1626 CAS.
- A. R. Zimmerman, K. W. Goyne, J. Chorover, S. Komarneni and S. L. Brantley, Org. Geochem., 2004, 35, 355–375 CrossRef CAS.
- W. Kast, Chem. Eng. Process. Process Intensif., 1985, 19, 118 CrossRef.
- R. Krishna and J. M. van Baten, J. Membr. Sci., 2011, 369, 545–549 CrossRef CAS.
- Z. Hasan and S. H. Jhung, J. Hazard. Mater., 2015, 283, 329–339 CrossRef CAS PubMed.
- M. Eddaoudi, H. Li and O. M. Yaghi, J. Am. Chem. Soc., 2000, 122, 1391–1397 CrossRef CAS.
- S. S. Chui, S. M. Lo, J. P. Charmant, A. G. Orpen and I. D. Williams, Science, 1999, 283, 1148–1150 CrossRef CAS PubMed.
- J. Jose Gutierrez-Sevillano, S. Calero and R. Krishna, J. Phys. Chem. C, 2015, 119, 3658–3666 Search PubMed.
- C. Chmelik, J. Kärger, M. Wiebcke, J. Caro, J. M. van Baten and R. Krishna, Microporous Mesoporous Mater., 2009, 117, 22–32 CrossRef CAS.
| This journal is © The Royal Society of Chemistry 2016 |