
 Open Access Article
 This Open Access Article is licensed under a Creative Commons Attribution-Non Commercial 3.0 Unported Licence
Synthesis of wool roll-like silver nanoflowers in an ethanol/water mixture and their application to detect traces of the fungicide carbendazim by SERS technique
Manh Cuong Nguyenab,
Truc Quynh Ngan Luong *ab,
Thi Thu Vuab,
Cao Tuan Anhc and
Tran Cao Daoab
*ab,
Thi Thu Vuab,
Cao Tuan Anhc and
Tran Cao Daoab
aInstitute of Materials Science, Vietnam Academy of Science and Technology, 18 Hoang Quoc Viet, Cau Giay, 100000, Hanoi, Vietnam. E-mail: nganltq@ims.vast.ac.vn
bGraduate University of Science and Technology, Vietnam Academy of Science and Technology, 18 Hoang Quoc Viet, Cau Giay, 100000, Hanoi, Vietnam
cTantrao University, Yen Son, Trung Mon, 22000, Tuyenquang, Vietnam
First published on 13th April 2022
Abstract
The Raman signal enhancement ability of the surface-enhanced Raman scattering (SERS) technique is largely determined by the SERS substrate, which is usually a collection of precious metal (such as silver or gold) nanoparticles. For use in the SERS substrate, anisotropic metal nanoparticles, e.g. flower-like, will be preferred over the isotropic ones since they will give higher Raman enhancement. The problem is that it is very difficult to fabricate anisotropic metal nanoparticles as small as the isotropic ones that are best suited for use as SERS substrates. This study deals with the synthesis of wool roll-like silver nanoflowers (AgNFs) in a mixed ethanol/water solution instead of the usual aqueous solution when reducing silver nitrate with ascorbic acid in the presence of citric acid, which acts as a structure-directing agent. The size of the wool roll-shaped AgNFs was reduced from about 700 nm when the solution was purely aqueous to about 280 nm when in the mixed solution the ethanol/water volume ratio was 75/25. Thanks to the size reduction of AgNFs, the enhancement factor of SERS substrates made from them has increased dramatically, from 2.7 × 10⁶ when the size of AgNFs is 700 nm to 5.4 × 10⁹ when their size is 280 nm (the calculation is based on rhodamine 6G Raman and SERS spectroscopy). The application of the above AgNFs to recording the SERS spectrum of carbendazim (CBZ), a typical fungicide, at low concentrations has also shown that the smaller the size of the AgNFs, the higher the intensity of the CBZ characteristic bands. The wool roll-shaped AgNFs with a size of 280 nm allowed CBZ to be detected down to a concentration of 0.01 ppm (4.2 × 10⁻⁸ M) with a detection limit of 3.2 ppb (13.4 × 10⁻⁹ M).
Introduction
Surface-enhanced Raman spectroscopy (SERS) is emerging as a powerful optical sensing approach for the detection of various analytes. The SERS effect has been attributed to an enhancement of the Raman scattering efficiency for molecules that are located on or within very close proximity to the surface of certain metal nanostructures, in particular free-electron metals such as silver, gold, and copper. This results in significant Raman signal enhancement for physically or chemically adsorbed molecules on these metal nanostructures. With suitable metal nanostructures and measurement setups, SERS can even detect a single molecule and achieve very high enhancement factor (greater than 1010).1–3 As a method of quantitative analysis, SERS has been developed into a useful tool in detecting harmful substances even at very small concentrations in food and in the environment.Metal nanostructures that enhance the Raman signal of molecules adsorbed on it are often referred to as SERS substrates. It is widely accepted that the huge Raman signal enhancement in SERS arises from the electromagnetic enhancement at areas that are known as ‘hot spots’ on the SERS substrate.1–5 These ‘hot spots’ are usually either the nanogaps between adjacent metal nanostructures or the narrow spaces around the tip of metal nanostructures.4,5 Experimental studies and theoretical calculations have shown that due to the abundance of ‘hot spots’, complex silver nanostructures such as dendritic, flower-like and star-like nanostructures can provide the especially strong enhancement of the electromagnetic field.6–9 Among them, this work will focus on the flower-like silver nanostructure.
The flower-like silver nanostructures (which hereafter will be referred to as silver nanoflowers – AgNFs) have been synthesized by various research groups for use as SERS substrates.10–24 In the majority of studies, AgNFs were obtained in the form of colloidal solutions from the chemical reduction of silver nitrate (AgNO3) with ascorbic acid (AsA) in an aqueous solution.10,11,15,17–23 This means that AsA is a particularly important reducing agent for the production of AgNFs. It is also worth noting that in all published reports the size of the AgNFs obtained is always in the range of 500 nm and several μm, never less than 500 nm. Among the suggested methods to prepare colloidal solutions of AgNFs mentioned above, we especially pay attention to the method proposed by Hong et al. in 2009 (ref. 10) and recently reused with some modifications by Li et al.24 due to its originality and simplicity. In this method AgNFs were synthesized by chemically reducing a primary silver salt precursor at room temperature, using silver nitrate (AgNO3) as the salt precursor, ascorbic acid (AsA) as the reducing agent, and additionally using citric acid (CiA) as the structure-directing agent. It should be noted that with the addition of the structure-directing agent CiA, the obtained AgNFs became like wool rolls in shape. In addition, we would like to mention a number of other studies on metal nanostructures that can be used as SERS substrates for pesticide detection.25–27
In this study, we will synthesize AgNFs in the same manner as Li et al. did24 with some modifications, namely the aqueous reaction medium was replaced by a mixed ethanol–water medium. This change was made with the aim of getting AgNFs with a smaller size. The ethanol–water mixture was used on the basis of our finding that silver nanoparticles became significantly smaller when synthesized electrochemically in an ethanol electrolyte than in an aqueous one, which we reported in a previous work.28 In the present study, we had to use a reaction medium that was a mixture of ethanol and water instead of pure ethanol due to the insolubility of AsA in ethanol. We would like to fabricate AgNFs with smaller sizes in the hope that the SERS substrate made from such AgNFs will provide a greater Raman enhancement and in fact our hopes were fulfilled. More specifically, after AgNFs were prepared, their colloidal solutions were first used to make the SERS substrates to detect rhodamine 6G (R6G) with the aim of evaluating the enhancement factor (EF) in dependence on the size of AgNFs. The results showed that the colloid of AgNFs with smaller size will give higher EF. We next used AgNFs SERS substrates to determine trace concentrations of carbendazim (CBZ), a typical fungicide, and also found that AgNFs with smaller sizes would provide higher SERS sensitivity. Using the smallest AgNFs that could be synthesized (about 280 nm) as the SERS substrate for CBZ detection, we achieved a very good detection limit, 3.2 ppb (13.4 × 10⁻⁹ M).
Regarding carbendazim (CBZ), it is the common name for methyl benzimidazol-2-ylcarbamate, a typical fungicide in the benzimidazole group. The group of benzimidazole fungicides has been introduced since the 1960s.29 Thereafter its use has increased significantly over time thanks to its effectiveness at low doses and inhibitory activity against a variety of fungi. CBZ is commonly used in cultivation for seed fertilization, foliar spraying, and soil treatment. This fungicide is a potentially carcinogenic substance with a long toxicological metabolism.30 Therefore, it has been listed as a banned substance in many countries.
The analytical techniques commonly used to analyze CBZ in agricultural products are mainly based on chromatographic methods such as high-performance liquid chromatography with fluorescence detection31,32 and capillary electrophoresis coupled with mass spectrometry.33 Although these methods are highly sensitive, accurate and reproducible, they still have some major limitations such as being expensive, time-consuming and requiring a complicated sample preparation procedure. It is therefore essential to develop a simple, fast, sensitive, and inexpensive method for CBZ analysis in agricultural products. SERS has emerged as such a method.
The application of SERS to detect CBZ has been reported in the literature, but only in a few studies.34–39 Specifically, by using gold nanorods derivatized with a β-cyclodextrin derivative as SERS substrates, Strickland et al. detected CBZ with a detection limit of 50 μM.34 Ma et al. used gold colloid as SERS substrate to detect CBZ on tea leaves.35 The detection limit they achieved was 0.1 mg kg−1 (ppm). Furini et al. performed CBZ analysis with a detection limit as low as 0.02 ppm using an Ag colloidal SERS substrate.36 Chen et al. reported on using gold nanoparticles with an average size of 15 nm as SERS substrate for CBZ detection in Oolong tea. The detection limit they achieved was 100 μg kg−1 (ppb).37 Cheshari et al. reported that by using the composite Ag@SiO2-molecularly imprinted polymers (MIP) as SERS substrates, CBZ at concentrations as low as 10−9 M could be detected.38 Recently, Shen et al. (in 2021) combined on-chip thin layer chromatography (TLC) and SERS on diatomite chip for separation and detection of CBZ from orange juice and kale leaves.39 The authors showed that with this combination CBZ in orange juice and kale could be detected with a limit of detection (LOD) less than 2 ppm.
Experimental
Materials
Carbendazim in powder form was purchased from Sigma-Aldrich. Other chemicals such as silver nitrate (AgNO3, 99.8%), citric acid (C6H8O7, 99.5%), ascorbic acid (C6H8O6, 99.7%) and ethanol (C2H5OH, 99.7%) were purchased from Xilong Chemical Co., Ltd (Guangdong, China). The chemicals were used without further purification. Deionized (DI) water was used for all solution preparations.AgNFs preparation and characterization
The AgNFs were synthesized as follows. 170 mg of AgNO3 and 1.92 g of CiA were dispersed in 60 mL of a mixed solution of water and ethanol (with an ethanol/water ratio of 25/75, 50/50 and 75/25, respectively). Then 500 mg of AsA was added into the above mixture under continuous magnetic stirring. After 30 min of persistent stirring, the black precipitate was collected by centrifugation and washed with DI water and ethanol several times. Finally, the product was re-dispersed in 30 mL of DI water.The AgNFs were characterized using an S-4800 field-emission scanning electron microscope (Hitachi, Japan). Their structure was analyzed via X-ray diffraction (XRD) using an XRD EQUINOX 5000 diffractometer (Thermo Scientific, France). The optical absorption of AgNFs samples was analyzed by UV-Vis absorbance spectroscopy (Shimadzu UV1800, Japan) over a range 190–1100 nm.
Preparation of low concentration carbendazim samples
Carbendazim in powder form was dissolved in a mixture of methanol and water (at the ratio of 1![[thin space (1/6-em)]](https://www.rsc.org/images/entities/char_2009.gif) :1, v/v) to a concentration of 100 mg L−1 to produce the stock solution. Next, different concentrations of CBZ solutions from 0.01 to 50 mg L−1 were prepared by diluting this stock solution with methanol.
:1, v/v) to a concentration of 100 mg L−1 to produce the stock solution. Next, different concentrations of CBZ solutions from 0.01 to 50 mg L−1 were prepared by diluting this stock solution with methanol.
SERS measurements
Raman spectrum of CBZ powder and SERS spectra of CBZ solutions were recorded using portable Raman spectrometer model BWS475-785H (B&W Tek, Inc., USA) with 785 nm excitation laser. This spectrometer provides a Raman spectrum over the range of 65–2800 cm−1 with a spectral resolution of better than 3.5 cm−1. The laser spot size is 105 μm (for the objective lens magnification of 20×) and the maximum laser power is 420 mW.For collecting the SERS spectra of CBZ solutions, 20 μL of AgNFs colloid was mixed with 20 μL of CBZ solution followed by vortexing for 10 s. A volume (25 μL) of the resultant solution was then dripped onto a commercial aluminum foil with a diameter of 2 mm. The sample was then allowed to dry naturally in the air.
All spectra were collected by using BWSpec software version 4.10 (B&W Tek, Inc., USA) with build-in spectra processing functions included spectral smoothing and baseline correction. Before collecting the sample spectra, a dark scan must be taken in order to subtract the contribution or dark signal from the sensor itself. To ensure the uniformity, each sample was scanned at three randomly selected points with laser power of 33 mW (8% of maximum power). At each point three spectra were recorded with an acquisition time of 10 s and then the spectra were averaged. Origin version 8.0 (Electronic Arts Inc, USA) was used for data analysis.
Results and discussion
Fig. 1 shows the morphology of flower-like silver nanoparticles, or in other words, silver nanoflowers (AgNFs), which were obtained by adding 500 mg AsA to 60 mL solution of water and ethanol containing 170 mg AgNO3 and 1.92 g CiA at room temperature with a variable ethanol/water volume ratio of 0/100, 75/25, 50/50 and 75/25, respectively. Besides, Fig. 2 shows the AgNFs community formed when the ethanol/water ratio of the mixed solution is 75/25. First of all, it can be seen that the formed silver nanoparticles have a quasi-spherical shape, but with a very rough surface, which makes them look like rolls of wool. It is thanks to the abundance of sharp nano-edges and narrow gaps between the interlaced nanosheets that this structure has a lot of hot spots and as such can have very high Raman enhancement. It should be remarked that the wool roll morphology as shown in Fig. 1 of the synthesized AgNFs is mainly caused by the CiA with the chosen concentration. When preparing AgNFs by reducing AgNO3 with the reducing agent AsA in the presence of a structural directing agent, it was shown that the structural directing agents can be various organic acids, such as citric acid, oxalic acid, malic acid and others.40 Depending on the organic acid that was chosen as the structure-directing agent and its concentration, AgNFs with different surface roughnesses will be generated. The second point to be observed from Fig. 1 and 2 is that at each ratio of ethanol/water, the size of the AgNFs produced is quite uniform and this size decreases as the above ratio increases. More specifically, when AgNFs were prepared in a purely aqueous medium, their size was about 700 nm (Fig. 1a). But when AgNFs were synthesized in media with ethanol/water ratios of 25/75, 50/50 and 75/25, their sizes were about 500, 400 and 280 nm, respectively (Fig. 1b–d). In summary, by reducing AgNO3 with AsA in the presence of CiA at the chosen concentrations in a mixed ethanol/water medium, uniform AgNFs in the form of wool rolls will be obtained with size gradually decreased as the ethanol/water ratio increased. | ||
| Fig. 1 SEM images of AgNFs obtained by reducing AgNO3 with AsA in the presence of CiA in a mixed ethanol/water solution with volume ratios of 0/100 (fully aqueous) (a), 25/75 (b), 50/50 (c) and 75/25 (d), respectively. | ||
 | ||
| Fig. 2 SEM image showing the AgNFs community formed by reducing AgNO3 with AsA in the presence of CiA in a mixed ethanol/water solution with the 75/25 volume ratio. | ||
Fig. 3 shows the UV-Vis spectra of AgNFs suspended in water, which have been synthesized in solutions with different concentrations of ethanol. It can be seen that all spectra exhibit similar broad absorption bands ranging from 420 nm to the near-infrared (NIR) region despite the different sizes of the AgNFs. It is well known that the localized surface plasmon resonance (LSPR) properties of metal nanostructures are greatly influenced by their morphology.16,20 As observed on the SEM images, the surface of AgNFs is highly rough with many small Ag nanostructures. Therefore, the broad UV-Vis spectra of AgNFs are the result of many overlapping spectra of small Ag nanostructures.
 | ||
| Fig. 3 The UV-Visible absorption spectra of AgNFs suspended in water, which have been synthesized in ethanol–water mixture solutions with different concentrations of ethanol. | ||
The crystal structure and the phase composition of the representative obtained AgNFs were characterized by X-ray diffraction (XRD). Fig. 4 shows a typical XRD pattern of the as-prepared sample synthesized in the solution containing 75% ethanol (by volume). The diffraction peaks are assigned to the (111), (200), and (220) planes of a face-centered cubic (fcc) structure of Ag, respectively. These planes with sharp peaks indicate that the AgNFs are highly crystalline. No other impurity peaks were detected, indicating the high purity of the as-obtained samples.
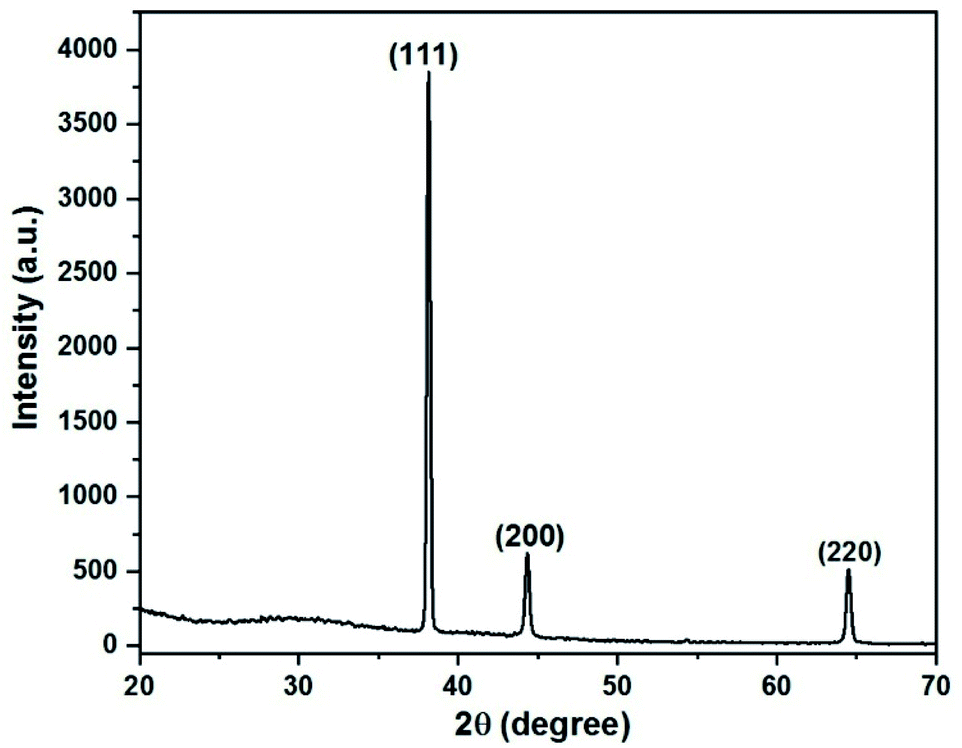 | ||
| Fig. 4 Typical XRD pattern of AgNFs that have been synthesized in a mixed ethanol/water solution with the 75/25 volume ratio. | ||
After synthesis, the wool roll-like AgNFs were first used as SERS substrates to record the spectra of rhodamine 6G (R6G) with the aim to evaluate the quality of the SERS substrates made from them. The first thing that we would like to determine is the magnitude of analytical enhancement factor (AEF) that these substrates can give as well as the dependence of AEF on the size of AgNFs. Fig. 5 shows the SERS spectra of R6G with concentrations less than 10−5 M recorded with SERS substrates made of colloidal AgNFs with sizes of 280 nm (Fig. 5a) and 700 nm (Fig. 5b), respectively. From Fig. 5 it can be seen that while the 280 nm silver wool rolls can detect R6G down to concentrations of 10−12 M, those with the 700 nm size can only detect it down to the concentration of 10−9 M. On the basis of recording Raman and SERS spectra of R6G, we were able to evaluate the AEF of SERS substrates made from wool-rolled AgNFs of different sizes. The evaluation was made based on the formula:41

 | ||
| Fig. 5 SERS spectra of R6G with different concentrations (equal to and less than 10−5 M), which were recorded with SERS substrates made from colloidal AgNFs with sizes of 280 nm (a) and 700 nm (b), respectively. | ||
The uniformity of the 280 nm AgNFs SERS substrate was tested by recording the SERS spectra of 10−10 M R6G at 10 different points on the same SERS substrate. The results showed that the obtained spectra are quite uniform as illustrated in Fig. 6. If the band at 1511 cm−1 is taken as representative for R6G, the calculations indicate that the relative standard deviation (RSD) in the intensities of this band at different points is only 6.52%.
 | ||
| Fig. 6 SERS spectra of 10−10 M R6G, which were recorded from 10 random points on the same 280 nm AgNFs substrate. | ||
The reproducibility of 280 nm AgNFs SERS substrates was also checked and the results are illustrated in Fig. 7. Fig. 7 shows the SERS spectra of 10−10 M R6G which were recorded using three SERS substrates that were assembled from 280 nm AgNFs synthesized in three different batches. As observed, the spectra are quite similar, with the relative standard deviation (RSD) of the intensity of the band at 1511 cm−1 being only 8.73%.
 | ||
| Fig. 7 SERS spectra of 10−10 M R6G, which were recorded using three SERS substrates that were assembled from 280 nm AgNFs fabricated in three different batches. | ||
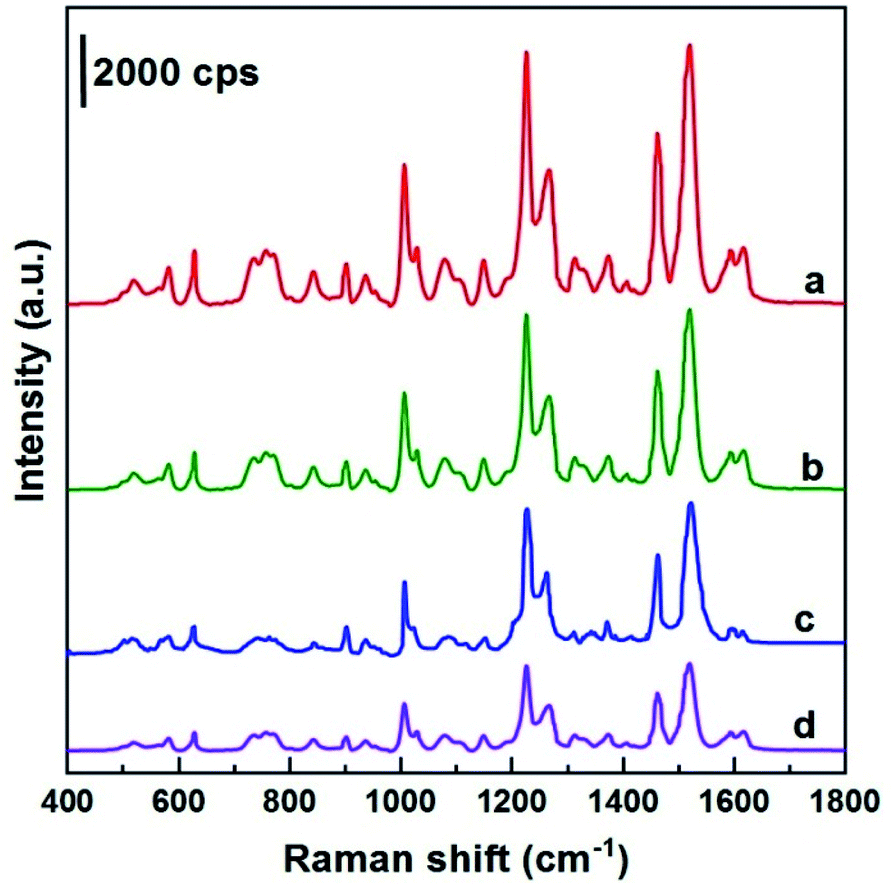
After assessing the quality of the SERS substrate made of wool roll-shaped AgNFs, these AgNFs were used to make the SERS substrates for CBZ detection. Fig. 8 shows the Raman spectrum of CBZ powder (curve (a)) and SERS spectrum of CBZ diluted to a concentration of 100 mg L−1, using the colloidal AgNFs that were prepared in an ethanol/water mixture with the volume ratio of 75/25 to assemble the SERS substrate (curve (b)). From Fig. 8 it can be seen that the Raman spectrum of CBZ (curve (a)) exhibits characteristic bands of 617 cm−1 (ring stretching and C–C bending), 723 cm−1 (C–C bending and C–O–CH3 bending), 960 cm−1 (C–H bending), 1018 cm−1 (C–N bending, C–C bending and C–O–CH3 stretching), 1260 cm−1 and 1270 cm−1 (C–H bending and N–H bending), and 1473 cm−1 (C–H bending and N–H bending). Meanwhile, the SERS spectrum of 100 mg L−1 CBZ (curve (b)) shows some differences compared with the Raman spectrum of CBZ powder. Specifically, some characteristic bands are slightly shifted, such as the band at 617 cm−1 being shifted forward to the position of 628 cm−1 while the bands at 1018, 1260 and 1473 cm−1 are shifted backward to the positions of 1007, 1228 and 1460 cm−1, respectively. In addition, in the SERS spectrum the intensity of the band at 1228 cm−1 becomes greater than that of the band at 1270 cm−1, in contrast to the Raman spectrum. Furthermore, the band at 1523 cm−1 becomes considerably tall. All of this is a consequence of chemical interactions between the CBZ molecules and the silver SERS substrate. We would like to emphasize that the CBZ SERS spectrum obtained in this work is identical to the CBZ SERS spectrum that Furini et al. reported in 2015.36 The assignment of major bands observed in the Raman and SERS spectra of CBZ to different vibration modes of the CBZ molecule is listed in Table 1.
 | ||
| Fig. 8 Raman spectrum of CBZ powder (a) and SERS spectrum of 100 mg L−1 CBZ solution adsorbed on the smallest size AgNFs SERS substrate (b). | ||
| Solid Raman (cm−1) | SERS (cm−1) | Assignment |
|---|---|---|
| 617 | 628 | Ring stretching and C–C bending |
| 723 | — | C–H wagging |
| 960 | — | C–H bending |
| 1018 | 1007 | C–N bending and C–C stretch and C–O–CH3 stretching |
| 1260 | 1228 | C–C stretch, C–H bending and N–H bending |
| 1270 | 1270 | C–H bending and N–H bending |
| 1473 | 1460 | N–H bending and C–H bending |
| — | 1523 | N–H bending and C–N stretch |
To investigate the effect of the size of AgNFs on the Raman signal enhancement ability of the SERS substrate, 100 mg L−1 (ppm) CBZ solution was simultaneously detected by SERS substrates made from colloidal AgNFs with different sizes. The results are illustrated in Fig. 9. From this figure it can be seen that the SERS substrate made of AgNFs with a smaller size will give the CBZ SERS spectrum in which the bands have higher intensity and better resolution. More specifically, Fig. 9 shows that the SERS substrate with 280 nm-AgNFs gives the CBZ spectrum with the highest band intensity (curve (a)). Then, with the increase of AgNFs size, the intensity of the CBZ bands gradually decreases (curves (b)–(d)). Note that 280 nm-AgNFs produced a spectrum of CBZ in which the intensities of the bands are about three times higher than that of 700 nm-AgNFs.
 | ||
| Fig. 9 SERS spectra of 100 mg L−1 CBZ solution adsorbed onto a SERS substrate made from colloidal AgNFs with different sizes: 280 nm (curve (a)), 400 nm (curve (b)), 500 nm (curve (c)), and 700 nm (curve (d)). | ||
Next, to test the CBZ detection ability of the synthesized wool roll-shaped AgNFs, we used 280 nm colloidal AgNFs to make SERS substrates for recording CBZ spectra with different concentrations ranging from 100 ppm to 0.01 ppm (4.2 × 10⁻⁸ M to 4.2 × 10⁻⁴ M) and the results are illustrated in Fig. 10. Fig. 10 shows that with the decrease in the CBZ concentration, the intensity of the main characteristic bands of the CBZ steadily decreases. This implies that the SERS substrates used to record CBZ spectra at different concentrations are almost identical. In other words, the AgNFs that have been synthesized in large quantities are quite uniform and perfectly suitable for subdividing into multiple SERS substrates for use in the quantitative analysis of different substances. In addition, from Fig. 10 we can see that with the prepared AgNFs SERS substrates, CBZ concentrations as low as 0.01 mg L−1 can be easily determined.
 | ||
| Fig. 10 SERS spectra of CBZ with concentrations ranging from 0.01 ppm to 100 ppm which were recorded using the 280 nm AgNFs SERS substrate. | ||
To represent CBZ in quantitative analysis, the band at 1523 cm−1 can be chosen since this is a single peak with relatively high intensity. The calibration curve, which represents the CBZ concentration in dependence on the intensity of the Raman band at 1523 cm−1, is shown in Fig. 11. As it can be seen, Fig. 11 shows a good linear relationship between the intensity of the 1523 cm−1 peak and the CBZ concentration in the region from 0.01 mg L−1 to 100 mg L−1. The regression equation is y = 18832 × logCCBZ + 38439 and R2 = 0.9902, where y is the SERS intensities of the band at 1523 cm−1 of CBZ, and CCBZ represents CBZ concentration. Note that each point in Fig. 11 is the result of averaging the five measurements at different points on the same sample. The error bars represent the standard deviations of five independent measurements. Furthermore, the limit of detection (LOD) of CBZ is 3.2 ppb (13.4 × 10⁻⁹ M), estimated by the signal-to-noise ratio of 3 (S/N = 3). These results indicate that wool roll-shaped AgNFs with the size of 280 nm can be used to quantitatively determine CBZ to concentrations at the ppb level.
 | ||
| Fig. 11 The calibration curve which represents the dependence of the intensity of the Raman band at 1523 cm−1 of CBZ on its concentration in the range of 0.1–100 ppm (expressed in the log scale). | ||
Conclusions
In conclusion, wool roll-shaped silver nanoflowers (AgNFs) of different sizes were synthesized at room temperature in a mixed ethanol/water solution by reducing AgNO3 with ascorbic acid in the presence of citric acid which acts as a structural directing agent. When using ethanol/water solution with ethanol concentration increased from 0 to 75% (volume fraction), the size of the silver wool rolls was reduced from 700 nm to 280 nm. Colloidal solutions of the aforementioned wool-roll AgNFs were used to make the SERS substrates for the detection of rhodamine 6G (R6G) and carbendazim (CBZ). The results showed that the smaller the wool-roll AgNFs, the higher the SERS activity. More specifically, while wool-roll AgNFs with the size of 280 nm give an analytical enhancement factor (AEF) of 5.4 × 10⁹, the same but with a size of 700 nm can only provide a AEF of 2.7 × 10⁶. The SERS spectrum of the CBZ at the same trace concentration as recorded by wool-roll AgNFs of smaller size also exhibits significantly higher band intensity and better resolution. The wool roll-shaped AgNFs with a size of 280 nm allowed CBZ to be detected down to a concentration of 0.01 ppm (4.2 × 10⁻⁸ M) with a detection limit of 3.2 ppb (13.4 × 10⁻⁹ M).Conflicts of interest
There are no conflicts to declare.Acknowledgements
This work was supported financially by the Vietnam National Foundation for Science and Technology Development (NAFOSTED) under Project 103.02-2020.14.Notes and references
- S. Nie and S. R. Emory, Science, 1997, 275, 1102 CrossRef CAS PubMed.
- H. Xu, E. J. Bjerneld, M. Käll and L. Börjesson, Phys. Rev. Lett., 1999, 83, 4357 CrossRef CAS.
- L. T. Q. Ngan, D. T. Cao, C. T. Anh and L. V. Vu, Int. J. Nanotechnol., 2015, 12, 358 CrossRef CAS.
- H. Tang, C. Zhu, G. Meng and N. Wu, J. Electrochem. Soc., 2018, 165, B3098 CrossRef CAS.
- T. C. Dao, T. Q. N. Luong, T. A. Cao and N. M. Kieu, Adv. Nat. Sci. Nanosci. Nanotechnol., 2019, 10, 025012 CrossRef CAS.
- P. R. Sajanlal and T. Pradeep, Nano Res., 2009, 2, 306 CrossRef CAS.
- H. B. Li, P. Liu, Y. Liang, J. Xiao and G. W. Yang, Nanoscale, 2012, 4, 5082 RSC.
- Y. Han, S. Liu, M. Han, J. Bao and Z. Dai, Cryst. Growth Des., 2009, 9, 3941 CrossRef CAS.
- A. Garcia-Leis, J. V. Garcia-Ramos and S. Sanchez-Cortes, J. Phys. Chem. C, 2013, 117, 7791 CrossRef CAS.
- L. Hong, Q. Li, H. Lin and Y. Li, Mater. Res. Bull., 2009, 44, 1201 CrossRef CAS.
- H. Liang, Z. Li, W. Wang, Y. Wu and H. Xu, Adv. Mater., 2009, 21, 4614 CrossRef CAS.
- B. K. Jena, B. K. Mishra and S. Bohidar, J. Phys. Chem. C, 2009, 113, 14753 CrossRef CAS.
- T. Liu, D. Li, D. Yang and M. Jiang, Langmuir, 2011, 27, 6211 CrossRef CAS PubMed.
- M. Zhang, A. Zhao, H. Sun, H. Guo, D. Wang, D. Li, Z. Gana and W. Tao, J. Mater. Chem., 2011, 21, 18817 RSC.
- H. Liang, Z. Li, Z. Wang, W. Wang, F. Rosei, D. Ma and H. Xu, Small, 2012, 8, 3400 CrossRef CAS PubMed.
- T. T. Nhung and S.-W. Lee, ACS Appl. Mater. Interfaces, 2014, 6, 21335 CrossRef CAS PubMed.
- J. Yang, B. Cao, H. Li and B. Liu, J. Nanoparticle Res., 2014, 16, 2651 CrossRef.
- C. M. Ajmal, K. P. Faseela, S. Singh and S. Baik, Sci. Rep., 2016, 6, 34894 CrossRef PubMed.
- Y. Lu, C.-Y. Zhang, D.-J. Zhang, R. Hao, Y.-W. Hao and Y.-Q. Liu, Chin. Chem. Lett., 2016, 27, 689 CrossRef CAS.
- Q. Chang, X. Shi, X. Liu, J. Tong, D. Liu and Z. Wang, Nanophotonics, 2017, 6, 1151 CAS.
- J. Huang, P. Liang, J. Xu, Y. Wu, W. Shen, B. Xu, D. Zhang, J. Xia and S. Zhuang, RSC Adv., 2017, 7, 49097 RSC.
- Y. Wu, P. Liang, Q. Dong, Y. Bai, Z. Yu, J. Huang, Y. Zhong, Y. Dai, D. Ni, H. Shu and C. U. Pittman Jr, Food Chem., 2017, 237, 974 CrossRef CAS PubMed.
- J. Tong, S. Li, C. Chen, Y. Fu, F. Cao, L. Niu, T. Zhai and X. Zhang, Polymers, 2019, 11, 619 CrossRef PubMed.
- H. Li, M. Wang, X. Shen, S. Liu, Y. Wang, Y. Li, Q. Wang and G. Che, J. Environ. Manage., 2019, 249, 109387 CrossRef CAS PubMed.
- A. D'Agostino, A. M. Giovannozzi, L. Mandrile, A. Sacco, A. M. Rossi and A. Taglietti, Talanta, 2020, 216, 120936 CrossRef PubMed.
- C. Fasolato, F. Domenici, S. Sennato, F. Mura, L. De Angelis, F. Luongo, F. Costantini, F. Bordi and P. Postorino, Appl. Phys. Lett., 2014, 105, 073105 CrossRef.
- F. Domenici, C. Fasolato, E. Mazzi, L. De Angelis, F. Brasili, F. Mura, P. Postorino and F. Bordi, Colloids Surf., A, 2016, 498, 168 CrossRef CAS.
- T. C. Dao and T. Q. N. Luong, RSC Adv., 2020, 10, 40940 RSC.
- P. Mazellier, E. Leroy, J. De Laat and B. Legube, Environ. Chem. Lett., 2003, 1, 68 CrossRef CAS.
- S. Singh, N. Singh, V. Kumar, S. Datta, A. B. Wani, D. Singh, K. Singh and J. Singh, Environ. Chem. Lett., 2016, 14, 317 CrossRef CAS.
- X. Deng, X. Chen, K. Lin, G. Ding and P. Yao, Food Anal. Methods, 2013, 6, 1576 CrossRef.
- Q. Subhani, Z. Huang, Z. Zhu and Y. Zhu, Talanta, 2013, 116, 127 CrossRef CAS PubMed.
- J. Dominguez-Alvarez, M. Mateos-Vivas, D. Garcia-Gomez, E. Rodriguez-Gonzalo and R. Carabias-Martinez, J. Chromatogr., A, 2013, 1278, 166 CrossRef CAS PubMed.
- A. D. Strickland and C. A. Batt, Anal. Chem., 2009, 81, 2895 CrossRef CAS PubMed.
- C.-H. Ma, J. Zhang, Y.-C. Hong, Y.-R. Wang and X. Chen, Chin. Chem. Lett., 2015, 26, 1455 CrossRef CAS.
- L. N. Furini, S. Sanchez-Cortes, I. López-Tocón, J. C. Otero, R. F. Arocad and C. J. L. Constantino, J. Raman Spectrosc., 2015, 46, 1095 CrossRef CAS.
- X. Chen, M. Lin, L. Sun, T. Xu, K. Lai, M. Huang and H. Lin, Food Chem., 2019, 293, 271 CrossRef CAS PubMed.
- E. C. Cheshari, X. Ren and X. Li, Int. J. Environ. Anal. Chem., 2020, 100, 1245 CrossRef CAS.
- Z. Shen, Q. Fan, Q. Yu, R. Wang, H. Wang and X. Kong, Spectrochim. Acta, Part A, 2021, 247, 119037 CrossRef CAS PubMed.
- C. Zhang, R. Hao, B. Zhao, Y. Fu, Y. Hao and Y. Liu, J. Mater. Sci., 2017, 52, 11391 CrossRef CAS.
- E. C. Le Ru and P. G. Etchegoin, MRS Bull., 2013, 38, 631 CrossRef.
| This journal is © The Royal Society of Chemistry 2022 |