
Synthesis, structure and photoluminescence properties of a novel color-tunable Si1.92Al0.08O1.08N1.92:Eu2+,Tb3+,Sm2+phosphor for ultraviolet white light-emitting diodes†
Yichao Wang,
Jianyan Ding,
Yanyan Li and
Yuhua Wang*
Key Laboratory for Special Function Materials and Structural Design of The Ministry of Education, School of Physical Science and Technology, Lanzhou University, Lanzhou, 730000, China. E-mail: wyh@lzu.edu.cn; Fax: +86-931-8913554; Tel: +86-931-8912772
First published on 13th October 2015
Abstract
A novel oxynitride phosphor Si1.92Al0.08O1.08N1.92:x%Eu2+,y%Tb3+,z%Sm2+ (o-sialon) was successfully synthesized through a high temperature solid-state reaction. The crystal structure, photoluminescence properties and thermal quenching properties have been measured and analyzed. The results indicate that the emission colors can be tuned from blue (0.1716, 0.1508) to green (0.3607, 0.5631) by changing the Eu2+/Tb3+ ratio and tuned from white (0.2377, 0.2991) to deep red (0.3573, 0.2231) by changing the Sm2+ concentration from 0 to 0.03% in Si1.92Al0.08O1.08N1.92:0.18%Eu2+,1%Tb3+,z%Sm2+. The energy transfer from Eu2+ to Tb3+ in Si1.92Al0.08O1.08N1.92:Eu2+,Tb3+ and the energy transfer from Eu2+/Tb3+ to Sm2+ in Si1.92Al0.08O1.08N1.92:Eu2+,Tb3+,Sm2+ have been studied. The energy transfer mechanism of Eu2+ to Tb3+ is demonstrated to be a dipole–dipole interaction. Their integrated emission intensities at 150 °C all remain at 90% of that measured at room temperature. The results indicate that the Si2−nAlnO1+nN2−n:x%Eu2+,y%Tb3+,z%Sm2+ phosphor is a very promising candidate for use as an ultraviolet white light-emitting diode phosphor.
1. Introduction
In the field of advanced lighting and display technology, white light-emitting diodes (WLEDs) have been attracting intense attention due to their high efficiency, compactness, long operational lifetime and energy savings.1–4 Until now, the commercial WLEDs were achieved by the combination of an InGaN chip with a Y3Al5O12:Ce3+ (YAG:Ce3+) phosphor. However, this kind of WLED exhibits a high correlated color temperature (CCT) and a poor color rendering index due to the lack of the red emission band.5–7 In order to overcome this problem, the method of blending tricolor (blue, green, red) phosphors upon the UV chips has been employed to realize warm-WLEDs. However, this method also suffers from the problem of low luminescence efficiency and color aberration due to emission reabsorption and different degradation rates of the three primary phosphors.8–10 It is an urgent task to develop novel single-phased multi-color-emitting phosphors with high chemical and thermal stability for UV WLEDs to avoid the abovementioned problems. A single-composition multi-color-emitting phosphor can be produced by co-doping sensitizers and activators into the same crystalline matrix, using the principle of energy transfer from the sensitizers to the activators, such as Ca6Y2Na2(PO4)6F2:Eu2+,Mn2+,11 La5Si2BO13:Ce3+,Mn2+,12 CaZr(PO4)2:Eu2+/Eu3+,13 Ca2NaSiO4F:Ce3+,Eu2+,Tb3+,14 and so on, but there is not an ideal commercial phosphor for this way, so finding new phosphors and investigating energy transfer between different rare earth ions are important things for single-composition multi-color-emitting phosphor.As far as the sensitizers and activators, the rare earth ions were used for them in most inorganic phosphors because of their abundant emission color.15–18 It is well known that the Eu2+ ions has broad excitation and emission bands with high efficiency due to their spin and orbit allowed 4f–5d electronic transitions.19 Moreover, the emission color of Eu2+ in different hosts has alterable emission peaks, depending on different crystal field splitting resulting from their surrounding ligands.20,21 The Tb3+ ion is regarded as a promising green activator for showing sharp lines at 486, 542, 582 and 619 nm due to 5D4 → 7F6, 5D4 → 7F5, 5D4 → 7F4 and 5D4 → 7F3 transitions, respectively. For many materials, in order to have intense Tb3+ emission in the phosphor, sensitizers such as Eu2+ and Ce3+ are needed, since the f–f transitions of Tb3+ ion arespin-forbidden.22,23 Moreover divalent Sm2+ has the 4f6 electron configuration, which can be excited into the 4f55d1 continuum under irradiation with UV and visible light. The Sm2+-doped phosphors often exhibits efficient deep red emission.24–26 Compared with other red emission ions (Eu3+, Mn2+, Pr3+) which are usually used for energy transfer, the Sm2+ often shows a more wide broadband excitation. This may make the Sm2+ a potential red emission ion for energy transfer.
As for hosts, nitrides and oxynitrides such as MAlSiN3 (M = Ca, Sr),27–29 MYSi4N7 (M = Sr, Ba),30,31 MSi2O2N2 (M = Ca, Sr, Ba),32,33 α-SiAlON,34,35 and β-SiAlON,36 are good candidates for host materials owing to several merits such as their high chemical, physical stability and low thermal quenching.37 In the oxynitride or nitride phosphors, β-sialon is well known as a great green phosphor, which has a special structure, derived from β-Si3N4 by equivalent substitution of Al–O for Si–N, and the activators are situated into the channel of c direction. The o-sialon is a common and excellent ceramic material in Si–Al–O–N phase diagram which has a similar structure with β-sialon.38 The structure is derived from Si2N2O by equivalent substitution of Al–O for Si–N, which can be written as Si2−nAlnO1+nN2−n. However, the luminescence properties of o-sialon have not been previously investigated. So we chose the o-sialon for the study and synthesize a series of novel oxynitride phosphors Si2−nAlnO1+nN2−n doped with Eu2+, Tb3+ and Sm2+. The crystal structure, thermal quenching and occupation situation of lanthanide ions for the o-sialon were investigated. Their luminescent properties under UV excitation and the energy transfer were studied.
2. Experimental
A series of Eu2+, Tb3+, Sm2+ singly and co-doped Si2−nAlnO1+nN2−n were synthesized by a solid state reaction. The starting materials employed are Si (A.R.), SiO2 (A.R.), Al(OH)3 (A.R.), Eu2O3 (99.99%), Tb4O7 (99.99%) and Sm2O3 (99.99%). The ingredients were well mixed and sintered in boron nitride (BN) crucibles at 1400 °C for 2 h and subsequently at 1550 °C for 4 h in a reducing atmosphere of 20% H2–80% N2.The phase structures of the obtained samples were characterized by powder X-ray diffraction (XRD) using a Rigaku diffractometer with Ni-filtered Cu Kα radiation. The photoluminescence (PL) and photoluminescence excitation (PLE) spectra were obtained by a FLS-920T fluorescence spectrophotometer equipped with Xe 900 (450 W xenon arc lamp) as the light source. The PL decay curves were measured by a FLS-920T fluorescence spectrophotometer with an nF900 ns Flashlamp as the light source. All the measurements were performed at room temperature. High-temperature luminescence intensity measurements were carried out by using an aluminum plaque with cartridge heaters; the temperature was measure by thermocouples inside the plaque and controlled by a standard TAP-02 high-temperature fluorescence controller.
3. Results and discussion
3.1 Phase identification and crystal structure
To evaluate the structural parameters of Si1.92Al0.08O1.08N1.92: structural refinement was carried out by the material studio program using the Rietveld method. As displayed in Fig. 1(a), the red solid line and black crosses represent the calculated and experimental patterns, respectively. The pink short vertical lines show the Bragg reflection positions of the calculated pattern. The difference between the experimental and calculated results is plotted by the blue line at the bottom. The structural parameters of Si1.96Al0.04N1.96O1.04 are used as the initial parameters in the Rietveld analysis.39 The resulting crystallographic data of Si1.92Al0.08O1.08N1.92 is summarized in Table 1. The atomic coordinates and site occupancy fraction (SOF) are presented in the ESI (Table S1†). All atomic positions and equivalent isotropic displacement parameters were refined converging to the residual factors Rwp = 13.27%, Rp = 9.17%. We can find that the Si1.92Al0.08O1.08N1.92 has orthorhombic crystal system (Cmc21(36) space group) which is similar to the crystal system of Si1.96Al0.04N1.96O1.04. | ||
| Fig. 1 (a) Rietveld refinement of the powder XRD profile of Si1.92Al0.08O1.08N1.92. (b) The crystal structure of Si1.92Al0.08O1.08N1.92 and the coordination environment of the activator ions. | ||
| Formula | Si1.92Al0.08O1.08N1.92 |
|---|---|
| Crystal system | Orthorhombic |
| Space group | Cmc21(36) |
| a/Å | 8.8901 |
| b/Å | 5.5002 |
| c/Å | 4.8545 |
| α/° | 90 |
| β/° | 90 |
| γ/° | 90 |
| Rwp | 13.27% |
| Rp | 9.17% |
As shown in Fig. 1(b), the Si1.92Al0.08O1.08N1.92 comprises a three-dimensional network structure of (Si, Al)(O, N)4 tetrahedra with a continuous and folded channel. The channel was formed by the corner shared connection and it is composed by six-membered ring arraying along the c direction. There are six sites on the six-membered ring. Two of which are only occupied by O2−, the other four can be occupied by O2− or N3−. When the rare earth ions are doped, the coordination environments of the cation sites are not appropriate for them to occupy, because Eu2+ (1.17 Å, CN = 6; 1.25 Å, CN = 8), Tb3+ (0.92 Å, CN = 6; 1.04 Å, CN = 8) and Sm2+ (0.96 Å, CN = 6; 1.27 Å, CN = 8) have a larger radius compared with Al3+ (0.39 Å, CN = 4) and Si4+ (1.17 Å, CN = 6), we think that the rare earth ions could not occupy any sites of cation ions (Al3+, Si4+) in the structure of o-sialon. We can not know the definite position of the rare earth ions in Si1.92Al0.08O1.08N1.92, however because the Si1.92Al0.08O1.08N1.92 have the similar structure composition of (Si, Al)(O, N)4 tetrahedra and the analogical channel composed by six-membered ring with β-sialon, we can obtain some enlightenment from the rare earth ions in β-sialon. Lin Gan et al. describe detailedly and demonstrate the position of Ce in β-SiAlON using an atom-resolved Cs-corrected scanning transmission electron microscope. The Ce3+ have two sites which are in the c-projected structural channels coordinated with six and nine N(O) atoms. We can reasonably infer that the positions of rare earth ions in Si1.92Al0.08O1.08N1.92 are also in the interspace or channel and there are several coordination environments around Eu2+ ions.
Fig. 2 shows the XRD patterns of the obtained Si1.92Al0.08O1.08N1.92:x%Eu2+ (0.09 ≤ x ≤ 0.27) and Si1.92Al0.08O1.08N1.92:18%Eu2+,1%Tb3+,0.03%Sm2+ phosphors. When the diffraction data are compared with the simulated patterns, it is found that all the positions and relative intensities are in good agreement with the calculated and no impurity phase is detected. The results show that there is no detectable impurity phase presented when doping Eu2+, Tb3+ and Sm2+ ions.
 | ||
| Fig. 2 The XRD patterns of the Si1.92Al0.08O1.08N1.92:x%Eu2+ (0.09 ≤ x ≤ 0.27) and Si1.92Al0.08O1.08N1.92:18%Eu2+,1%Tb3+,0.03%Sm2+ samples. | ||
3.2 Photoluminescent properties
 | ||
| Fig. 3 (a) The experimental data and Gaussian fitting of the emission spectrum Si1.92Al0.08O1.08N1.92:0.18%Eu2+ monitored at 340 nm. (b) The emission spectra of Si2−nAlnO1+nN2−n:0.18%Eu2+ (z = 0.032, 0.048, 0.064, 0.08). (b) The excitation spectra of Si1.92Al0.08O1.08N1.92:0.18%Eu2+ monitored at different emissions (400 nm, 450 nm, 500 nm). (c) The emission spectra of Si1.92Al0.08O1.08N1.92:0.18%Eu2+ under different excitation wavelengths (300 nm, 320 nm, 340 nm, 360 nm, 380 nm, 400 nm). | ||
In order to further demonstrate there are different luminescent centers for Si1.92Al0.08O1.08N1.92:Eu2+, the excitation spectra monitored at different wavelengths and emission spectra of Si1.92Al0.08O1.08N1.92:0.18%Eu2+ are shown in Fig. 3(b) and (c). When monitoring different emission peaks, we can observe different excitation peaks, and by changing the excitation wavelengths, the shapes of the emission spectra have different peak patterns. The results further prove that the Si1.92Al0.08O1.08N1.92 have more than one position for Eu2+ to occupy.
The influence of the Eu2+ concentration on the luminescent properties was investigated by varying the Eu2+ concentration between 0.09% and 0.4%. The emission spectra of Si1.92Al0.08O1.08N1.92 with varied Eu2+ concentrations under excitation at 340 nm are given in Fig. 4. As the concentration of Eu2+ increased, the luminescence intensity increased and reached a maximum at x = 0.007. When the Eu2+ concentration exceeded 0.007, concentration quenching occurred. Meanwhile, the emission peak positions of the Si1.92Al0.08O1.08N1.92:xEu2+ phosphors shift from 427 nm to 458 nm as the Eu2+ concentration increases. The red shift of the emission peak can be ascribed to two reasons. First, when the Eu2+ concentration was changed, the shapes of emission spectra are different. So we infer that the intensity of three sites have inequable change degree relative to the same variation of Eu2+ concentration, which can make different peak positions. Second, from the Fig. 2, we observe that the shift toward largeangle of the diffraction position was happened with the increasing of Eu2+. Due to the Bragg equation, the lattice constant become smaller with the increasing of Eu2+. The red-shifting behavior of the emission band can be explained in terms of the Eu2+ ions experiencing a strengthening of the crystal field strength caused by increasing Eu2+ concentration due to the shrinkage of the lattice.
 | ||
| Fig. 4 The emission spectra of Si1.92Al0.08O1.08N1.92:x%Eu2+ (0.09 ≤ x ≤ 0.4). The inset shows the relationship between the emission intensity or the emission peak of Eu2+ ions and the doped Eu2+ content. | ||
 | ||
| Fig. 5 Emission spectra (right) and excitation spectra (left) of Si1.92Al0.08O1.08N1.92:0.18%Eu2+ (a), Si1.92Al0.08O1.08N1.92:1%Tb3+ (b), Si1.92Al0.08O1.08N1.92:0.18%Eu2+,1%Tb3+ (c), Si1.92Al0.08O1.08N1.92:0.03%Sm2+ (d), and Si1.92Al0.08O1.08N1.92:0.18%Eu2+,1%Tb3+,0.0045%Sm2+ (e) samples. | ||
A considerable spectral overlap between the PL spectrum of Si1.92Al0.08O1.08N1.92:0.18%Eu2+ and the PLE spectrum of Si1.92Al0.08O1.08N1.92:1%Tb3+ were observed. This implies that the energy transfer from Eu2+ to Tb3+ would be highly expected in Eu2+ and Tb3+ co-doped Si1.92Al0.08O1.08N1.92. Fig. 5(c) shows the PL and PLE spectra of Si1.92Al0.08O1.08N1.92:0.18%Eu2+,1%Tb3+. At the excitation of 340 nm, the phosphor shows blue emission of the Eu2+ ions and green emission of the Tb3+ ions. Monitored at 542 nm, the excitation spectrum shows a broad band, which has a similar shape with the PLE spectrum of Si1.92Al0.08O1.08N1.92:0.18%Eu2+. This indicates the occurrence of an energy transfer from Eu2+ to Tb3+, and the doped of Eu2+ enhanced the efficient of Tb3+ under the excitation at 340 nm.
Fig. 5(d) displays the excitation and emission spectra of Si1.92Al0.08O1.08N1.92:0.03%Sm2+. The emission spectrum under 340 nm excitation of Sm2+ doped Si1.92Al0.08O1.08N1.92 shows the sharp emission lines at 680 nm, 710 nm and 730 nm of Sm2+ ions overlapped on the weak broad emission between 600 and 750 nm, the sharp emission can be attributed to 5D0 → 7Fj (j = 0, 1, 2) transition and the broad band can be attributed to 5d → 4f transition of Sm2+. When monitored at 680 nm the excitation spectrum shows a wide range from 250 nm to 600 nm consisting of two broad bands with maxima at 360 and 470 nm, respectively, the bands can be attributed to transitions from the 4f6 ground state to the 4f55d1 excited states of Sm2+. It can be find that the excitation spectrum of Si1.92Al0.08O1.08N1.92:0.03%Sm2+ has an obvious spectral overlap with the emission spectrum of Si1.92Al0.08O1.08N1.92:0.18%Eu2+ and Si1.92Al0.08O1.08N1.92:1%Tb3+. This implies that the energy transfer from Eu2+, Tb3+ to Sm2+ maybe happened in the Eu2+, Tb3+ and Sm2+co-doped Si1.92Al0.08O1.08N1.92. Fig. 5(e) shows the excitation and emission spectra of Si1.92Al0.08O1.08N1.92:0.18%Eu2+,1%Tb3+,0.0045%Sm2+, which also have a wide broad band excitation from 250 to 600 nm monitoring at 680 nm. Comparing with the Si1.92Al0.08O1.08N1.92:Sm2+, it has a stronger absorption at 250–400 nm and the shape of this range is alike to the excitation spectra of Si1.92Al0.08O1.08N1.92:0.18%Eu2+,1%Tb3+. So we infer that the energy transfer could happen from Eu2+/Tb3+ to Sm2+.
In order to further understand the energy transfer between the Eu2+, Tb3+ and Sm2+ ions. A series of Si1.92Al0.08O1.08N1.92:0.18%Eu2+,y%Tb3+,z%Sm2+ samples were prepared for the investigation. Fig. 6(a) shows the emission spectra of Si1.92Al0.08O1.08N1.92:0.18%Eu2+,y%Tb3+ (0 ≤ y ≤ 1) and the variation of the emission intensity of Eu2+ and Tb3+ ions excited at 340 nm. The Eu2+ content was fixed at 0.18% which is the optimal content, while the Tb3+ content changes from 0 to 1%. As can be seen, the intensity of the emission spectra of the Eu2+ ions decreases monotonically with an increase in the Tb3+ doping content, whereas the intensity of the Tb3+ emission obviously increases. In addition, the emission peak positions have a blue shift with the increasing of Tb3+ because of the different energy transfer efficiencies for the three lattice site. These demonstrate the existence of the energy transfer from Eu2+ to Tb3+. Fig. 6(b) shows the emission spectra of Si1.92Al0.08O1.08N1.92:0.18%Eu2+,1%Tb3+,z%Sm2+ (0 ≤ z ≤ 0.03) and the variation of the emission intensity of Eu2+, Tb3+ and Sm2+ ions excited at 340 nm. As can be seen, the intensity of the emission spectra of the Eu2+ ions and Tb3+ decreases monotonically and the intensity of the Sm2+ emission spectra obviously increases with the increasing of Sm2+concentration. This proves that the energy transfer from Eu2+or/and Tb3+to Sm2+ is existent.
 | ||
| Fig. 6 (a) The emission spectra of Si1.92Al0.08O1.08N1.92:0.18%Eu2+,y%Tb3+ (0 ≤ y ≤ 1). The inset shows the relationship between the emission intensity of Eu2+ and Tb3+ ions and the doped Tb3+ content. (b) The emission spectra of Si1.92Al0.08O1.08N1.92:0.18%Eu2+,1%Tb3+,z%Sm2+ (0 ≤ z ≤ 0.03). The inset shows the relationship between the emission intensity of Eu2+, Tb3+ and Sm2+ ions and the doped Sm2+ content. | ||
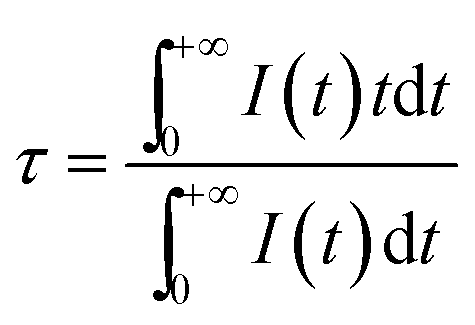
To provide further evidence of the phenomenon that the energy transfer from the Eu2+ to the Tb3+ ions and Eu2+/Tb3+to the Sm2+ ions occurs in the Si1.92Al0.08O1.08N1.92 host, some fluorescence decay curves were measured. Fig. 7(a) shows the PL decay curves of Eu2+ in the Si1.92Al0.08O1.08N1.92:0.18%Eu2+,y%Tb3+ (0 ≤ y ≤ 1). Fig. 7(b) and (c) shows the PL decay curves of Eu2+ and Tb3+ in the Si1.92Al0.08O1.08N1.92:0.18%Eu2+,1%Tb3+,z%Sm2+ (0 ≤ z ≤ 0.03) samples. The fluorescence of them all tends to be a non-exponential function with increasing the Tb3+ or Sm2+ concentration. The decay process of these samples are characterized by an average lifetime, τ, which can be calculated using eqn (1)42,43 as follows:
 | (1) |
 | ||
| Fig. 7 (a) Decay curves of Eu2+ in Si1.92Al0.08O1.08N1.92:0.18%Eu2+,y%Tb3+ (0 ≤ y ≤ 1) displayed on a logarithmic intensity scale (excited at 340 nm, monitored at 440 nm). (b) Decay curves of Eu2+ in Si1.92Al0.08O1.08N1.92:0.18%Eu2+,1%Tb3+,z%Sm2+ (0 ≤ z ≤ 0.03) displayed on a logarithmic intensity scale (excited at 340 nm, monitored at 440 nm). (c) Decay curves of Tb3+ in Si1.92Al0.08O1.08N1.92:0.18%Eu2+,1%Tb3+,z%Sm2+ (0 ≤ z ≤ 0.03) displayed on a logarithmic intensity scale (excited at 340 nm, monitored at 542 nm). (d) The dependence of I0/I of Eu2+ on C6/3, C8/3 and C10/3 in Si1.92Al0.08O1.08N1.92:0.18%Eu2+,y%Tb3+ (0 ≤ y ≤ 1). | ||
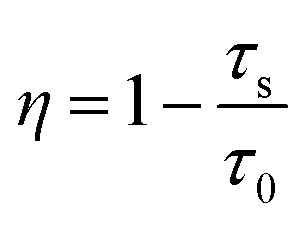
Energy transfer efficiency η between the Eu2+ and Tb3+ ions was also obtained from the decay lifetime by using the eqn (2):43–45
 | (2) |
The τ and τ0 are the lifetimes of sensitizer (Eu2+) ion with and without the presence of activator (Tb3+). The η are calculated to be 0, 0.032, 0.041, 0.063, 0.096 and 0.126 with y = 0, 0.05, 0.4, 0.55, 0.85 and 0.1. In general, energy transfer from the sensitizer to the activator in a phosphor may take place via a multipolar interaction or an exchange interaction. This can be evaluated according to the Dexter's theories,46–48 as given in the following eqn (3):
| η0/η ∝ Cn/3 | (3) |
| τ0/τ ∝ Cn/3 | (4) |
As shown in Fig. 7(d), this clearly indicates a better fitting result for C6/3 compared with the others through the linear fitting. This indicates that the dipole–dipole interaction is mainly responsible for the energy transfer from the Eu2+ to the Tb3+ ions.
The corresponding energy levels scheme and energy transfer in the Si1.92Al0.08O1.08N1.92:0.18%Eu2+,y%Tb3+,z%Sm2+ upon excitation with UV radiation is illustrated in Fig. 8. The energy transfer behavior between Eu2+, Tb3+ and Sm2+ ions can be ascribed to the similar value of energy level of the excited 5d state of Eu2+, the 5Dj (j = 3, 4) of Tb3+ions, and the excited 5d state of Sm2+. The energy transfer process can be divided into four parts. The first part is the excitation and the emission of Eu2+. When the Eu2+ ions are excited by the UV light, the electron is pumped to the 5d level, and then it relaxes to the lowest 5d crystal field splitting state, and then a blue emission appears owing to the transition from 5d to 4f level.
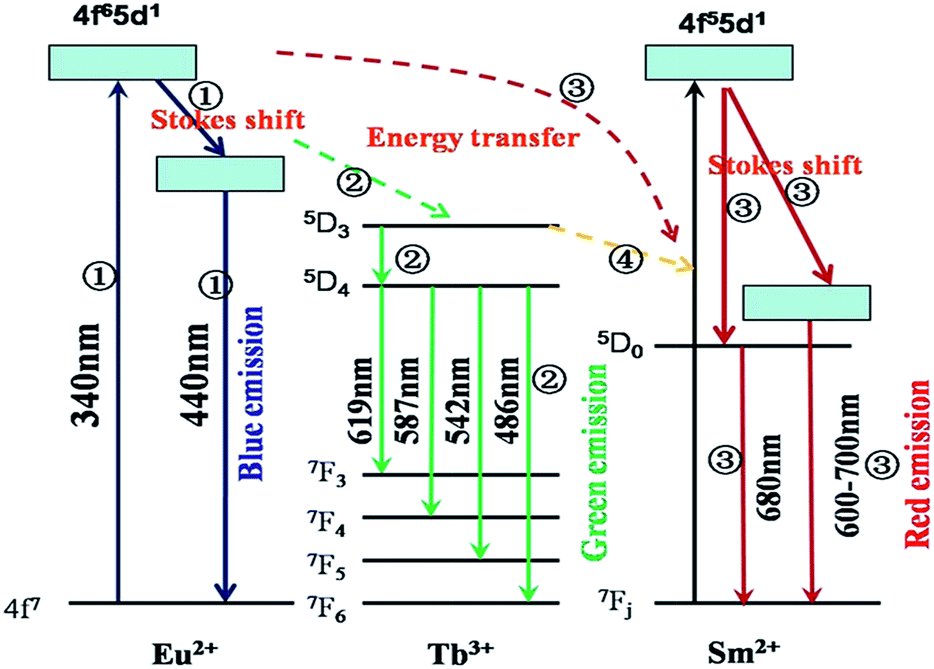 | ||
| Fig. 8 The energy level diagram and the energy transition schematic diagram of Eu2+, Tb3+ and Sm2+ in Si1.92Al0.08O1.08N1.92:Eu2+,Tb3+,Sm2+. | ||
The second part is the energy transfer from Eu2+ to Tb3+. An energy transfer process takes place from the 5d state of Eu2+ to 5D3 of Tb3+, which relaxes to levels 5D4 later. Then the excited Tb3+ relaxes to the 7Fj (j = 3, 4, 5, 6) levels non-radioactively and gives the green characteristic emission of Tb3+. The third part is the energy transfer from Eu2+ to Sm2+. An energy transfer process takes place from the 5d state of Eu2+ to 5d state of Sm2+, and then it relaxes to the lowest 5d crystal field splitting state or the 5D0 of Sm2+. And then the sharp emission of 5D0 → 7F0 occurs with the weak broad band 5d → 4f emission. The fourth part is the energy transfer from Tb3+ to Sm2+. An energy transfer process takes place from 5D3 or 5D4 of Tb3+ to 5d of Sm2+, and then it gives the emission processes of Sm2+ similar to the third part.
3.3 Temperature-dependent PL properties
Thermal quenching is one of the important technological parameters for phosphors used in UV WLEDs. Fig. 9(a) shows the temperature dependence of luminescence for Si1.92Al0.08O1.08N1.92:0.18%Eu2+ under 340 nm excitation. The emission intensity is about 92% at 150 °C, and 84% at 250 °C. The shape of the emission spectra shows a blue-shift with increasing temperature due to the thermally active phonon assisted excitation from a lower energy sublevel to a high energy sublevel in the excited state of Eu2+. As shown in Fig. 9(b), at higher temperatures, electrons at lower excited levels (M(2)) could jump to higher excited levels (M(1)), assisted by thermal phonons. This makes the result that when increasing temperature the blue shift of emission peak takes place. The energy transfer from M(2) to M(1) can occur by non-radiative relaxation. The temperature dependence of the integrated emission intensity of Si1.92Al0.08O1.08N1.92:0.18%Eu2+,1%Tb3+,0.003%Sm2+ is presented in the Fig. 9(c). The integrated emission intensity at 150 and 250 °C remains about 90% and 78%. It can be noted that the emission intensity of Sm2+ increases for 580–670 nm wavelength. The phenomenon also appeared in the β-sialon:Sm2+ and can be rationalized in terms of the energy transfer from 5D0 to 4f55d1.49 As shown in Fig. 9(d), in Si1.92Al0.08O1.08N1.92:0.18%Eu2+,1%Tb3+,0.003%Sm2+ sample, the 4f55d1 state is located at higher energy than the 5D0 state, so at higher temperatures, electrons at lower excited levels (5D0) could jump to higher excited levels (4f55d1), resulting in the increase of intensity of Sm2+ from 600 nm to 670 nm in the range of 25–150 °C.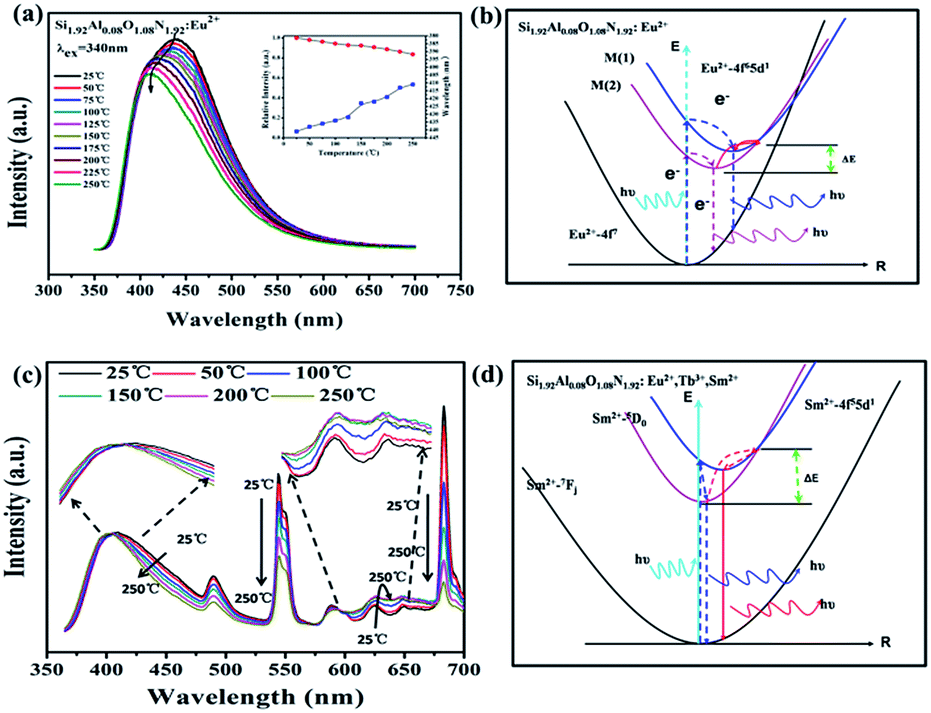 | ||
| Fig. 9 (a) Temperature dependence of emission intensity of Si1.92Al0.08O1.08N1.92:0.18%Eu2+. (b) The schematic configurational coordinate diagrams that present possible mechanisms of temperature-dependent emission for Si1.92Al0.08O1.08N1.92:0.18%Eu2+. (c) Temperature dependence of emission intensity of decay curves of Eu2+ in Si1.92Al0.08O1.08N1.92:0.18%Eu2+,1%Tb3+,0.003%Sm2+. (d) The schematic configurational coordinate diagrams that present possible mechanisms of temperature-dependent emission for Si1.92Al0.08O1.08N1.92:0.18%Eu2+,1%Tb3+,0.003%Sm2+. | ||
3.4 CIE coordinates and quantum efficiency of Si1.92Al0.08O1.08N1.92:Eu2+,Tb3+,Sm2+
Fig. 10 shows the variation of the Commission International deL'Eclairage (CIE) chromaticity coordinates of the Si1.92Al0.08O1.08N1.92:0.18%Eu2+ (1%Tb3+ or 0.03%Sm2+), Si1.92Al0.08O1.08N1.92:0.18%Eu2+,y%Tb3+ and Si1.92Al0.08O1.08N1.92:0.18%Eu2+,1%Tb3+,z%Sm2+ under excitation at 365 nm. The CIE coordinates are calculated and summarized in the ESI (Table S2†). The results indicate that we can get blue green red and even white emission light and the emission light can be modulated from blue to green with increasing the doping content of Tb3+ ions. And the Sm2+ can add the red compositions in the Si1.92Al0.08O1.08N1.92:0.18%Eu2+,1%Tb3+, making the colors of samples change from white to deep red. So the color can be tunable in a wide range for the Si1.92Al0.08O1.08N1.92:18%Eu2+,y%Tb3+,z%Sm2+. For an evaluation of the luminescence efficiency, the QEs of our phosphors are estimated. The QE of Si1.92Al0.08O1.08N1.92:0.18%Eu2+ under 340 nm is measured to be 59.5% at room temperature and the QE of Si1.92Al0.08O1.08N1.92:0.18%Eu2+,1%Tb3+,0.003%Sm2+ under 340 nm is measured to be 32.8%. | ||
| Fig. 10 CIE chromaticity diagram for Si1.92Al0.08O1.08N1.92:x%Eu2+,y%Tb3+,z%Sm2+ excited at 340 nm. | ||
4. Conclusions
In summary, A novel oxynitride phosphors Si2−nAlnO1+nN2−n:x%Eu2+,y%Tb3+,z%Sm2+ was synthesized successfully via a solid state reaction and the crystal structure was refined. There are three different crystalline sites for the lanthanide ions. The Eu2+, Tb3+ and Sm2+ singly-doped Si1.92Al0.08O1.08N1.92 respectively show a blue, a green and a deep red emission. It was demonstrated that the energy transfer from Eu2+ to Tb3+, Eu2+ to Sm2+ and Tb3+ to Sm2+ are subsistent in the Si2−nAlnO1+nN2−n:x%Eu2+,y%Tb3+,z%Sm2+. The change of the color for Si2−nAlnO1+nN2−n:x%Eu2+,y%Tb3+,z%Sm2+ in a wide range was successfully realized through the energy transfer. The thermal stabilities of them have a great performance, the blue shift and the increasing of the emission intensity along with the rising of temperature were also investigated. In conclusion, the novel color-tunable Si2−nAlnO1+nN2−n:x%Eu2+,y%Tb3+,z%Sm2+ phosphors are expected to have promising applications in UV WLEDs.Acknowledgements
We acknowledge the financial support from the National Science Foundation under grant No. 51202099 and grant No. 51372105, and the Doctoral Program of Higher Education under grant No. 20120211130003, and the State Key Laboratory on Integrated Optoelectronics under grant No. IOSKL2013KF15.Notes and references
- R. J. Xie, N. Hirosaki, M. Mitomo, K. Sakuma and N. Kiumra, Appl. Phys. Lett., 2006, 89, 241103 CrossRef PubMed.
- J. S. Kim, P. E. Jeon, J. C. Choi and H. L. Park, Appl. Phys. Lett., 2004, 84, 2931 CrossRef CAS PubMed.
- W. B. Im, Y. I. Kim, N. N. Fellows, H. Masui, G. A. Hirata, S. P. Den and B. R. Seshadri, Appl. Phys. Lett., 2008, 93, 091905 CrossRef PubMed.
- Z. Y. Mao and D. Wang, J. Inorg. Chem., 2010, 49, 4922 CrossRef CAS PubMed.
- C. Hecht, F. Stadler, P. J. Schmidt, J. S. A. der Guenne, V. Baumann and W. Schnick, Chem. Mater., 2009, 21, 1595 CrossRef CAS.
- Z. G. Xia, R. S. Liu, K. W. Huang and V. Drozd, J. Mater. Chem., 2012, 22, 15183 RSC.
- W. Z. Lv, Y. C. Jia, Q. Zhao, M. M. Jiao, B. Q. Shao, W. Lu and H. P. You, Adv. Opt. Mater., 2014, 2, 183 CrossRef PubMed.
- N. Guo, H. You, Y. Song, M. Yang, K. Liu, Y. Zheng, Y. Huang and H. Zhang, J. Mater. Chem., 2010, 20, 9061 RSC.
- W. R. Liu, C. H. Huang, C. W. Yeh, J. C. Tsai, Y. C. Chiu, Y. T. Yeh and R. S. Liu, Inorg. Chem., 2012, 51, 9636 CrossRef CAS PubMed.
- W. Lu, Y. C. Jia, Q. Zhao, W. Z. Lv and H. P. You, Chem. Commun., 2014, 50, 2635 RSC.
- N. Guo, H. P. You, C. Z. Jia, R. Z. O. Yang and D. H. Wu, Dalton Trans., 2014, 43, 12373 RSC.
- H. K. Liu, L. B. Liao and Z. G. Xia, RSC Adv., 2014, 4, 7288 RSC.
- J. C. Zhang, Y. Z. Long, H. D. Zhang, B. Sun, W. P. Han and X. Y. Sun, J. Mater. Chem. C, 2014, 2, 312 RSC.
- M. M. Jiao, Y. C. Jia, W. Lu, W. Z. Lü, Q. Zhao, B. Q. Shaoand and H. P. You, J. Mater. Chem. C, 2014, 2, 4304 RSC.
- L. Wu, Y. Zhang, M. Gui, P. Lu, L. Zhao, S. Tian, Y. Konga and J. Xu, J. Mater. Chem., 2012, 22, 6463 RSC.
- S. Zhang, H. Liang and C. Liu, J. Phys. Chem. C, 2013, 117, 2216 CAS.
- D. Kang, H. S. Yoo, S. H. Jung, H. Kim and D. Y. Jeon, J. Phys. Chem. C, 2011, 115, 24334 CAS.
- G. Zhu, S. Xin, Y. Wen, Q. Wang, M. Que and Y. Wang, RSC Adv., 2013, 3, 9311 RSC.
- D. Jia, R. S. Meltzer and W. M. Yen, Appl. Phys. Lett., 2002, 80, 1535 CrossRef CAS PubMed.
- K. A. Denault, Z. Chenga, J. Brgocha, S. P. DenBaars and R. Seshadri, J. Mater. Chem. C, 2013, 1, 7339 RSC.
- G. Zhang, J. Wang, Y. Chen and Q. Su, Opt. Lett., 2010, 35, 2382 CrossRef CAS PubMed.
- M. Jiao, N. Guo, W. Lü, Y. Jia, W. Lv, Q. Zhao, B. Shao and H. You, Inorg. Chem., 2013, 52, 10340 CrossRef CAS PubMed.
- N. Guo, Y. Song, H. You, G. Jia, M. Yang, K. Liu, Y. Zheng, Y. Huang and H. Zhang, Eur. J. Inorg. Chem., 2010, 4636 CrossRef CAS PubMed.
- N. R. J. Poolton, A. J. J. Bos and P. Dorenbos, J. Phys.: Condens. Matter, 2012, 24, 225502 CrossRef CAS PubMed.
- J. Y. Wang, Y. L. Huang and Y. D. Li, J. Am. Ceram. Soc., 2011, 95, 1494 Search PubMed.
- C. Kulshreshtha, S. H. Cho, Y. S. Jung and K. S. Sohn, J. Electrochem. Soc., 2007, 154, J86 CrossRef CAS PubMed.
- K. Uheda, N. Hirosaki, Y. Yamamoto, A. Naito, T. Nakajima and H. Yamamoto, Electrochem. Solid-State Lett., 2006, 9, H22 CrossRef CAS PubMed.
- H. Watanabe, H. Wada, K. Seki, M. Itou and N. Kijima, J. Electrochem. Soc., 2008, 155, F31 CrossRef CAS PubMed.
- X. Piao, K. Machida, T. Horikawa, H. Hanzawa, Y. Shimomura and N. Kijima, Chem. Mater., 2007, 19, 4592 CrossRef CAS.
- Y. Q. Li, C. M. Fang, G. de With and H. T. Hintzen, J. Solid State Chem., 2004, 171, 4687 CrossRef PubMed.
- Y. Q. Li, G. de With and H. T. Hintzen, J. Alloys Compd., 2004, 385, 1–11 CrossRef CAS PubMed.
- R. S. Liu, Y. H. Liu, N. C. Bagkar and S. F. Hua, Appl. Phys. Lett., 2007, 91, 061119 CrossRef PubMed.
- Y. Q. Li, A. C. A. Delsing, G. de With and H. T. Hintzen, Chem. Mater., 2005, 17, 3242 CrossRef CAS.
- T. Suehiro, N. Hirosaki, R. J. Xie and M. Mitomo, Chem. Mater., 2005, 17, 308–314 CrossRef CAS.
- K. Sakuma, N. Hirosaki, R. J. Xie, Y. Yamamoto and T. Suehiro, Mater. Lett., 2007, 61, 547 CrossRef CAS PubMed.
- R. J. Xie, K. Kimoto, T. Sekiguchi, Y. Yamamoto, T. Suehiro, M. Mitomo and N. Hirosaki, Appl. Phys. Lett., 2005, 86, 211905 CrossRef PubMed.
- R. J. Xie and N. Hirosaki, Sci. Technol. Adv. Mater., 2007, 8(7), 588–600 CrossRef CAS PubMed.
- T. Ekstrom, P.-O. Olsson and M. Holmstrom, J. Eur. Ceram. Soc., 1993, 12, 165 CrossRef.
- O. Lindqvist, J. Sjoberg, S. Hull and R. Pompe, Acta Crystallogr., Sect. B: Struct. Sci., 1991, 47, 672 CrossRef.
- H. You, X. Wu, H. Cui and G. Hong, J. Lumin., 2003, 104, 223 CrossRef CAS.
- Y. Song, N. Guo and H. You, Eur. J. Inorg. Chem., 2011, 2327 CrossRef CAS PubMed.
- N. Guo, Y. Song, H. You, G. Jia, M. Yang, K. Liu, Y. Zheng, Y. Huang and H. Zhang, Eur. J. Inorg. Chem., 2010, 4636 CrossRef CAS PubMed.
- F. Lahoz, I. R. Martin, J. Mendez-Ramos and P. J. Nunez, Chem. Phys., 2004, 120, 6180–6190 CAS.
- P. Paulose, G. Jose, V. Thomas, N. Unnikrishnan and M. J. Warrier, Phys. Chem. Solids, 2003, 64, 841–846 CrossRef CAS.
- K. H. Kwon, W. B. Im, H. S. Jang, H. S. Yoo and D. Y. Jeon, Inorg. Chem., 2009, 48, 11525–11532 CrossRef CAS PubMed.
- D. L. Dexter and J. H. Schulman, J. Chem. Phys., 1954, 22, 1063 CrossRef CAS PubMed.
- G. Blasse, Philips Res. Rep., 1969, 24, 131–144 CAS.
- P. L. Li, Z. J. Wang, Z. P. Yang and Q. L. Guo, J. Mater. Chem. C, 2014, 2, 7823 RSC.
- Z. G. Yang, Z. Y. Zhao, M. D. Que and Y. H. Wang, Opt. Mater., 2013, 01, 024 Search PubMed.
Footnote |
| † Electronic supplementary information (ESI) available. See DOI: 10.1039/c5ra16603a |
| This journal is © The Royal Society of Chemistry 2015 |