Polyhedral oligomeric silsesquioxane as a recyclable soft template to synthesize mesoporous polymeric carbon nitride with enhanced photocatalytic hydrogen evolution†
Zhiwei
Liang
,
Lei
Liu
*,
Xiaojia
Zhuang
,
Zicheng
Tang
,
Haiping
Li
 * and
Wenbing
Kang
 *
*
National Engineering Research Center for Colloidal Materials, School of Chemistry and Chemical Engineering, Shandong University, Jinan, Shandong 250100, China
First published on 13th November 2020
Abstract
Recyclable template synthesis of polymeric carbon nitride (CN) is rarely reported. Herein, for the first time, octamethyl polyhedral oligomeric silsesquioxane (mPOSS) was used as a recyclable soft template to prepare mesoporous CN with increased specific surface area, photoabsorption, charge separation efficiency, and photocatalytic H2 evolution rate which is ∼4.5 times that of the bulk CN. mPOSS exhibits high stability and recoverability. This work opens an avenue for recyclable template synthesis of mesoporous CN and may advance its industrial application.
Energy and environmental issues induced by industrialization and rapid population growth have become great challenges facing human beings. Largely inspired by the wisdom of nature, semiconductor photocatalysis has been regarded as a promising technology to solve these issues, for which appropriate photocatalysts play the pivotal role.1 Among a large library of photocatalysts explored, melon-type polymeric carbon nitride (simply marked as CN) has attracted tremendous attention due to its outstanding optical properties, facile synthesis, non-toxicity, extraordinary physicochemical stability,2 and applicable energy band structures (with a conduction band edge and valence band edge of ∼−1.2 V and 1.5 V (vs. SHE), respectively)3 for various photocatalytic reactions, such as degradation of organic pollutants,4 water splitting,5 and reduction of CO2.6 However, the performance of pristine CN is still limited by its low specific surface area (SB), weak visible light absorption, and fast recombination of photogenerated charge carriers.7
Creation of mesopores in CN is one of the most effective ways to simultaneously increase the SB, the optical absorption, and the charge separation efficiency.2,8,9 The templating method is used the most in reported work to prepare mesoporous CN,7 and templates reported can be classified into hard templates and soft templates. Hard templates mainly include various mesoporous silica10–12 and calcium carbonate13 which must be removed from products by acid etching14 to achieve mesopores, while soft templates involve a few surfactants15 and block copolymers16 which are decomposed in the calcination process to form mesopores. Hitherto, both hard and soft templates reported are unrecyclable, which will substantially increase the synthetic cost of mesoporous CN and prevent their industrial production, let alone that waste fluids from the elimination of hard templates may give rise to environmental pollution17 and soft templates can lead to detrimental carbon doping in resultant mesoporous CN.7 Therefore, it is significant at present to develop recyclable and completely removable templates for cost-effective synthesis of mesoporous CN photocatalysts.
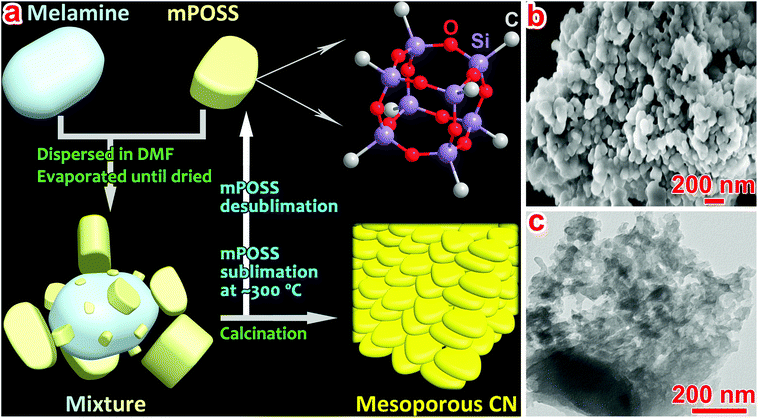
Herein, we, for the first time, report a recyclable soft template, octamethyl polyhedral oligomeric silsesquioxane (mPOSS) that can be used to prepare mesopore-rich CN (denoted as M-CN, Fig. 1a) which exhibits enlarged SB and enhanced photoabsorption, charge separation, and photocatalytic H2 evolution. mPOSS possesses a well-defined cage-like molecular structure (Fig. S2†) and comprises irregular particles with sizes from several tens of nanometers to several micrometers (Fig. S3†). When mixed with melamine in DMF and dried by evaporation at 80 °C (S1.2†), melamine blocks could be loaded with small mPOSS particles and encompassed by large particles (Fig. 1a and S4†), as clearly revealed by the energy dispersive X-ray spectroscopy (EDS) spectra and elemental mapping images (Fig. S5†). Fourier-transform infrared (FT-IR) spectra (Fig. S6 and Table S1†) indicate that the molecular structures of melamine and mPOSS are quite stable in the mixing process and hydrogen bonds may form between melamine and mPOSS. Upon calcining the melamine/mPOSS mixture, mPOSS with a sublimation temperature of ∼300 °C18 acts as the blocking agent to restrain the fusion of melamine and relevant intermediate (e.g., melam) particles, resulting in generation of abundant mesopores in M-CN (Fig. 1a). Survey X-ray photoelectron spectroscopy (XPS) spectra, Si 2p core-level XPS spectra and thermogravimetric analysis indicate residue of a little silica (<5 wt%) in the product (Fig. S7–S9†) which can be completely removed (Fig. S8†) by etching in a 4 M NH4HF2 solution (S1.2†). SEM and TEM images of M-CN indeed show lots of pores among aggregated and partially fused small sheet-like particles (Fig. 1b and c), in comparison with those of the bulk CN with few pores (Fig. S10†).
 | ||
| Fig. 1 (a) Schematic illustration of the synthesis and structures of precursors and M-CN; and (b) SEM and (c) TEM images of M-CN. | ||
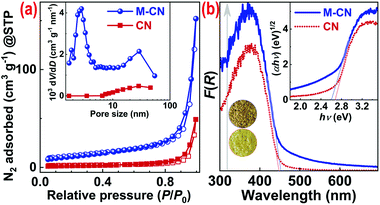
The pore structure of M-CN was further investigated by N2 sorption isotherm tests. As shown in Fig. 2a, the isotherms of both CN and M-CN exhibit typical type-IV isotherms featuring type-H3 hysteresis loops, indicating the existence of slit-like mesopores formed by stacking of nanosheets.19 As expected, M-CN possesses much larger SB and pore volume (35.5 m2 g−1 and 0.091 cm3 g−1) than the bulk CN (8.4 m2 g−1 and 0.018 cm3 g−1). The pore-size distribution curve of M-CN shows a wide peak at 10–50 nm and a strong peak at 2–4 nm (see the inset in Fig. 2a), which can be ascribed to the mesopores produced in the sublimation process of mPOSS with different sizes and shapes, in agreement with the SEM and TEM analysis.
X-ray diffraction (XRD) patterns of M-CN and CN (Fig. S11†) are similar and show two diffraction peaks at ∼13.2° and 27.3°, corresponding to the (210) and (002) planes of melon-type CN with a layered orthorhombic structure,20,21 respectively. Their interlayer distance is determined as 0.32 nm, according to the (002) peak position. Their FT-IR spectra (Fig. S12†) both show typical absorption bands of melon-type CN, i.e., the absorption bands at 3172, 1830–850, and 810 cm−1, ascribed to the N–H stretching vibration, C![[double bond, length as m-dash]](https://www.rsc.org/images/entities/char_e001.gif) N/C–N stretching vibrations in heptazine rings, and the characteristic breathing mode of the heptazine rings, respectively.22 Moreover, the C 1s and N 1s core-level XPS spectra of CN and M-CN are also similar. In the C 1s spectra (Fig. S13†), peaks at binding energies of 284.6, 286.5, 288.3, and 293.5 eV are assigned to adventitious carbon contaminants,23 π–π* of the adventitious carbon rings,24 N
N/C–N stretching vibrations in heptazine rings, and the characteristic breathing mode of the heptazine rings, respectively.22 Moreover, the C 1s and N 1s core-level XPS spectra of CN and M-CN are also similar. In the C 1s spectra (Fig. S13†), peaks at binding energies of 284.6, 286.5, 288.3, and 293.5 eV are assigned to adventitious carbon contaminants,23 π–π* of the adventitious carbon rings,24 N![[double bond, length as m-dash]](https://www.rsc.org/images/entities/char_e001.gif) C–N bonds, and π excitation of the heptazine rings,25 respectively. In the N 1s spectra (Fig. S14†), peaks centered at 398.5, 400.1, 401.2, and 404.0 eV are attributed to nitrogen in C–N
C–N bonds, and π excitation of the heptazine rings,25 respectively. In the N 1s spectra (Fig. S14†), peaks centered at 398.5, 400.1, 401.2, and 404.0 eV are attributed to nitrogen in C–N![[double bond, length as m-dash]](https://www.rsc.org/images/entities/char_e001.gif) C, N–H, and N–(C)3 bonds, and π excitation, respectively.26,27 Elemental analysis (Table S2†) indicates that the N/C molar ratios of M-CN and CN are both 1.50 (the theoretical value of melon-type CN). These results demonstrate that the generation of massive mesopores in M-CN did not induce detectable variation of the molecular framework, compared with the bulk CN.
C, N–H, and N–(C)3 bonds, and π excitation, respectively.26,27 Elemental analysis (Table S2†) indicates that the N/C molar ratios of M-CN and CN are both 1.50 (the theoretical value of melon-type CN). These results demonstrate that the generation of massive mesopores in M-CN did not induce detectable variation of the molecular framework, compared with the bulk CN.
The optical absorption performance of CN and M-CN was investigated by UV-vis diffuse reflectance spectroscopy (DRS). As shown in Fig. 2b, M-CN exhibits higher light-harvesting capability than CN across the whole optical spectrum, which should result from the multiple reflections of incident light in the massive mesopores23 in M-CN. The multiple reflections also induce a slight redshift17 of the absorption edge of M-CN (446 nm) in comparison with that of CN (453 nm) (Fig. 2b). Tauc plots indicate that the indirect bandgaps (Eg)28 of CN and M-CN are ∼2.67 and 2.60 eV, respectively (see the inset in Fig. 2b), that is, the Eg of M-CN is a little narrower. The remarkably enhanced optical absorption of M-CN can also be reflected by its darker color than that of CN (insets in Fig. 2b).
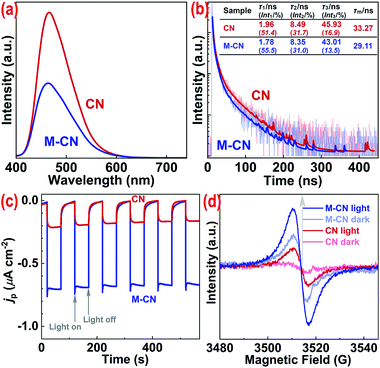
The charge separation and transfer performance of the samples was also investigated. As shown in Fig. 3a, photoluminescence (PL) spectra of both CN and M-CN show one peak at ∼466 nm, roughly corresponding to their bandgap (∼2.66 eV) emission. Then the lowered PL intensity of M-CN, compared with that of CN, suggests the decreased recombination efficiency of photogenerated charge carriers.17 Fluorescence lifetimes of the samples were further measured by time-resolved fluorescence spectroscopy. As shown in Fig. 3b, the lifetimes (τ1, τ2, and τ3), achieved by fitting the decay curves to a triple exponential model29 (S1.3†), and the mean lifetime ( where Inti is the percentage of corresponding τi) of M-CN are all shorter than those of CN (see the inset table in Fig. 3b), indicative of rapid transfer of photogenerated electrons and/or holes, decreasing their direct radiative recombination,30 and subsequent non-radiative energy transition of them.31 Moreover, M-CN exhibits ∼3.8-fold stronger cathodic photocurrent density than CN (Fig. 3c), also revealing much faster charge separation for M-CN.32 The enhanced charge separation for M-CN arises from its abundant mesoporous structure that shortens the distance and time for the charge carrier transfer from the bulk to the surface.17
Room-temperature electron paramagnetic resonance (EPR) spectroscopy was conducted to roughly characterize electronic structures of the samples (Fig. 3d). Both CN and M-CN show one single Lorentzian line centering at g of 2.0039 in the dark and under light irradiation, corresponding to sp2-caron in the heptazine rings.33 M-CN exhibits a stronger EPR signal than CN in the dark because of its much larger SB,34 and the irradiation induced EPR signal enhancement for M-CM is prominently higher than that for CN (Fig. 4d), because the higher photoabsorption performance of M-CN results in generation of more photoexcited holes and electrons,35i.e., greater delocalized electron density than that of CN. The high delocalized electron density favors the charge transfer (i.e., high conductivity) and the photocatalytic performance improvement.
Energy band levels of the samples were roughly confirmed. Mott–Schottky plots indicate that both CN and M-CN are n-type semiconductors and their flat-band potentials are −1.11 and −1.25 V (vs. SHE), respectively (Fig. S15†). Their flat-band potentials are approximately equal to their conduction band (CB) minimum (ECB).36 Then, the valence band (VB) maximum (EVB = Eg + ECB) of CN and M-CN is calculated as 1.56 and 1.33 V, respectively. VB-XPS spectra were recorded to determine the energy difference between Fermi levels (Ef) and EVB. As shown in Fig. S16,† the (EVB − Ef) values of CN and M-CN are determined as 2.52 and 2.51 eV (or V), respectively, i.e. their Ef of −0.96 and −1.18 V (vs. SHE). The schematic diagram of energy band levels of the samples is shown in Fig. S17,† and apparently, the ECB of M-CN is higher than that of CN, which means higher reducibility of photogenerated electrons for M-CN,37 favorable for H2 evolution from water splitting.
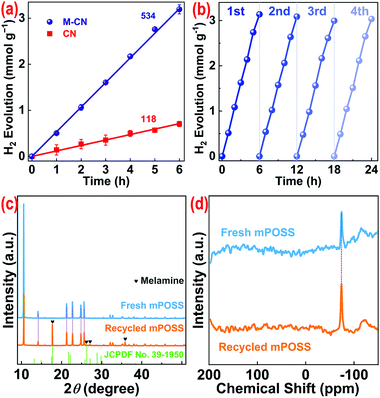
The photocatalytic performance of the samples was evaluated via the photocatalytic H2 evolution reaction. When using triethanolamine (10 vol%) as the electron donor and Pt as the cocatalyst for H2 evolution on CN and M-CN under visible light irradiation, the optimal Pt loading amount is 3 wt% (Fig. S18†). The H2 evolution rate (rH) of M-CN can reach 534 μmol g−1 h−1, that is almost 4.5 times that of CN (118 μmol g−1 h−1) (Fig. 4a), and is comparable to those of most reported template-synthesized mesoporous CN (Table S3†). The turnover number (TON) of M-CN, relative to Pt, reaches ∼21 after 6 hours with a turnover frequency (TOF) of 3.5 h−1. The SB normalized rH of M-CN (15.0 μmol m−2 h−1) is only ∼7% higher than that of CN (14.0 μmol m−2 h−1), suggesting that SB is the key factor influencing the photocatalytic activity. The apparent quantum efficiency of M-CN was calculated to be ∼2.0% at 420 nm (Fig. S19†). After four consecutive H2 production runs, M-CN does not exhibit an obvious photoactivity decrease (Fig. 4b), and the XRD pattern, the FT-IR spectrum, and SEM and TEM images of M-CN after the cycling experiment (Fig. S20†) are similar to those before, revealing the high chemical stability of M-CN. In addition, M-CN with silica residue (before etched with NH4HF2) exhibits similar rH to M-CN (Fig. S21†), indicative of the negligible effect of residual silica on the photocatalytic performance. Omitting the etching process for template removal benefits much the industrial production.
The sublimed mPOSS could be desublimed on the quartz tube wall (close to the outlet) in the tube furnace, signifying that the simple condensation is an effective way to recycle the mPOSS. The XRD pattern of recycled mPOSS is similar to that of fresh mPOSS38 except several observable weak peaks belonging to monoclinic melamine (JCPDS no. 39-1950) (Fig. 4c) coming from the sublimation of feedstock (i.e., melamine) on calcination. The FT-IR spectrum of the recycled mPOSS also shows similar absorption bands to those of the fresh one, apart from the weak absorption bands of melamine (Fig. S22†). Furthermore, 29Si nuclear magnetic resonance (NMR) spectroscopy was performed to characterize the structure of mPOSS. As shown in Fig. 4d, there is only one distinct peak at −74.1 ppm assigned to Si atoms in the cubelike (T3) product39 for both recycled and fresh mPOSS. The SEM image of the recycled mPOSS also shows particles with various shapes and sizes (Fig. S23†), just like that of fresh mPOSS (Fig. S3†). These demonstrate that mPOSS is structurally stable during calcination and condensation processes and is recyclable for M-CN preparation.
Conclusions
In summary, a recyclable soft template, mPOSS is first used to prepare mesopore-rich M-CN with enlarged SB and enhanced optical absorption, charge separation, and thus photocatalytic H2 evolution. The H2 evolution rate of M-CN can reach 4.5-fold that of the bulk CN under visible-light irradiation and its chemical stability is satisfactory. This work opens an avenue for recyclable template synthesis of mesoporous CN and favors the industrial production of the photocatalyst.Conflicts of interest
There are no conflicts to declare.Acknowledgements
This research is supported by the Department of Science & Technology of Shandong Province (Grant 2019JZZY020229).References
- L. Jiang, X. Yuan, G. Zeng, J. Liang, Z. Wu and H. Wang, Environ. Sci.: Nano, 2018, 5, 599–615 RSC.
- N. Tian, H. Huang, X. Du, F. Dong and Y. Zhang, J. Mater. Chem. A, 2019, 7, 11584–11612 RSC.
- X. Wang, K. Maeda, A. Thomas, K. Takanabe, G. Xin, J. M. Carlsson, K. Domen and M. Antonietti, Nat. Mater., 2009, 8, 76–80 CrossRef CAS.
- Z. Liang, Y. Xia, G. Ba, H. Li, Q. Deng and W. Hou, J. Mater. Chem. A, 2019, 7, 25824–25829 RSC.
- S. Yu, J. Li, Y. Zhang, M. Li, F. Dong, T. Zhang and H. Huang, Nano Energy, 2018, 50, 383–392 CrossRef CAS.
- F. Li, D. Zhang and Q. Xiang, Chem. Commun., 2020, 56, 2443–2446 RSC.
- Z. Yang, Y. Zhang and Z. Schnepp, J. Mater. Chem. A, 2015, 3, 14081–14092 RSC.
- N. Tian, Y. Zhang, X. Li, K. Xiao, X. Du, F. Dong, G. I. N. Waterhouse, T. Zhang and H. Huang, Nano Energy, 2017, 38, 72–81 CrossRef CAS.
- C. Liu, H. Huang, L. Ye, S. Yu, N. Tian, X. Du, T. Zhang and Y. Zhang, Nano Energy, 2017, 41, 738–748 CrossRef CAS.
- X. Jin, V. V. Balasubramanian, S. T. Selvan, D. P. Sawant, M. A. Chari, G. Q. Lu and A. Vinu, Angew. Chem., Int. Ed., 2009, 48, 7884–7887 CrossRef CAS.
- Y.-S. Jun, W. H. Hong, M. Antonietti and A. Thomas, Adv. Mater., 2009, 21, 4270–4274 CrossRef CAS.
- X. Li, A. F. Masters and T. Maschmeyer, ChemCatChem, 2015, 7, 121–126 CrossRef CAS.
- J. Wang, C. Zhang, Y. Shen, Z. Zhou, J. Yu, Y. Li, W. Wei, S. Liu and Y. Zhang, J. Mater. Chem. A, 2015, 3, 5126–5131 RSC.
- W. Iqbal, B. Yang, X. Zhao, M. Rauf, M. Waqas, Y. Gong, J. Zhang and Y. Mao, Catal. Sci. Technol., 2018, 8, 4576–4599 RSC.
- Y. Wang, X. Wang, M. Antonietti and Y. Zhang, ChemSusChem, 2010, 3, 435–439 CrossRef CAS.
- H. Yan, Chem. Commun., 2012, 48, 3430–3432 RSC.
- W. Iqbal, C. Dong, M. Xing, X. Tan and J. Zhang, Catal. Sci. Technol., 2017, 7, 1726–1734 RSC.
- K. J. Shea and D. A. Loy, Chem. Mater., 2001, 13, 3306–3319 CrossRef CAS.
- S. Liu, J. Chen, D. Xu, X. Zhang and M. Shen, J. Mater. Res., 2018, 33, 1391–1400 CrossRef CAS.
- Z.-A. Lan, G. Zhang and X. Wang, Appl. Catal., B, 2016, 192, 116–125 CrossRef CAS.
- F. Fina, S. K. Callear, G. M. Carins and J. T. S. Irvine, Chem. Mater., 2015, 27, 2612–2618 CrossRef CAS.
- G. Ba, Z. Liang, H. Li, Q. Deng, N. Du and W. Hou, Chem. Eng. J., 2020, 380, 122535 CrossRef CAS.
- Y. Zheng, L. Lin, X. Ye, F. Guo and X. Wang, Angew. Chem., Int. Ed., 2014, 53, 11926–11930 CrossRef CAS.
- D. L. Yu, J. L. He, Z. Y. Liu, B. Xu, D. C. Li and Y. J. Tian, J. Mater. Sci., 2008, 43, 689–695 CrossRef CAS.
- K. He, J. Xie, Z.-Q. Liu, N. Li, X. Chen, J. Hu and X. Li, J. Mater. Chem. A, 2018, 6, 13110–13122 RSC.
- Q. Han, B. Wang, J. Gao, Z. Cheng, Y. Zhao, Z. Zhang and L. Qu, ACS Nano, 2016, 10, 2745–2751 CrossRef CAS.
- C.-M. Zhu, A. Gao, Y. Wang and Y. Liu, Chem. Commun., 2014, 50, 13889–13892 RSC.
- V. R. Battula, S. Kumar, D. K. Chauhan, S. Samanta and K. Kailasam, Appl. Catal., B, 2019, 244, 313–319 CrossRef CAS.
- R. Godin, Y. Wang, M. A. Zwijnenburg, J. Tang and J. R. Durrant, J. Am. Chem. Soc., 2017, 139, 5216–5224 CrossRef CAS.
- L. Ke, P. Li, X. Wu, S. Jiang, M. Luo, Y. Liu, Z. Le, C. Sun and S. Song, Appl. Catal., B, 2017, 205, 319–326 CrossRef CAS.
- S. Cao, Y. Li, B. Zhu, M. Jaroniec and J. Yu, J. Catal., 2017, 349, 208–217 CrossRef CAS.
- Y. Wang, X. Liu, J. Liu, B. Han, X. Hu, F. Yang, Z. Xu, Y. Li, S. Jia, Z. Li and Y. Zhao, Angew. Chem., Int. Ed., 2018, 57, 5765–5771 CrossRef CAS.
- G. Zhang, M. Zhang, X. Ye, X. Qiu, S. Lin and X. Wang, Adv. Mater., 2014, 26, 805–809 CrossRef CAS.
- G. Zhang, J. Zhang, M. Zhang and X. Wang, J. Mater. Chem., 2012, 22, 8083–8091 RSC.
- W. Ho, Z. Zhang, M. Xu, X. Zhang, X. Wang and Y. Huang, Appl. Catal., B, 2015, 179, 106–112 CrossRef CAS.
- G. Zhang, Z.-A. Lan, L. Lin, S. Lin and X. Wang, Chem. Sci., 2016, 7, 3062–3066 RSC.
- C. Liu, Y. Zhang, F. Dong, A. H. Reshak, L. Ye, N. Pinna, C. Zeng, T. Zhang and H. Huang, Appl. Catal., B, 2017, 203, 465–474 CrossRef CAS.
- A. Fina, D. Tabuani, A. Frache and G. Camino, Polymer, 2005, 46, 7855–7866 CrossRef CAS.
- J. Vince, B. Orel, A. Vilčnik, M. Fir, A. Šurca Vuk, V. Jovanovski and B. Simončič, Langmuir, 2006, 22, 6489–6497 CrossRef CAS.
Footnote |
| † Electronic supplementary information (ESI) available: Experimental section, molecular structure of mPOSS, SEM images and EDS spectra, XRD patterns, partial XPS and FT-IR spectra, TGA curves, Mott–Schottky plots, VB-XPS spectra, schematic diagram of energy band structures, and partial photocatalytic data of samples. See DOI: 10.1039/d0se01388a |
| This journal is © The Royal Society of Chemistry 2021 |


