 Open Access Article
Cylindrical shaped ZnO combined Cu catalysts for the hydrogenation of CO2 to methanol
Hong Lei ,
Ruheng Zheng,
Yeping Liu,
Jiacheng Gao,
Xiang Chen and
Xiaoliang Feng*
College of Chemical and Material Engineering, Quzhou University, Quzhou 324000, China. E-mail: 28826589@qq.com; Fax: +86-570-8015112; Tel: +86-570-8026546
First published on 3rd May 2019
Abstract
Hydrogenation of CO2 to chemicals is of great importance in the reduction of greenhouse gas emission. And the interaction and/or the boundary between Cu and ZnO played a crucial role in the performance of the Cu–ZnO catalyst for CO2 hydrogenation to methanol. In this work, cylindrical shaped ZnO was first synthesized via controlled hydrothermal precipitation of Zn(CO2CH3)2·2H2O, and Cu was further deposited on ZnO via in situ reduction in aqueous solution. Characterizations indicated that the crystallization degree of ZnO decreased with the increasing content of Cu, while the exposed surface area of Cu exhibited a volcano shaped curve. It was found that the cylindrical shaped ZnO combined Cu catalysts were active for the hydrogenation of CO2, and the space time yield of methanol reached 0.50 g-MeOH (g-cat h)−1 at H2/CO2 = 3, 240 °C, 3.0 MPa, and 0.54 mol (g-cat h)−1, but the methanol selectivity decreases with the reduction of the (002) polar plane of ZnO. The conversion of CO2 and methanol selectivity were discussed with the detected exposed Cu surface area and the number of oxygen vacancies.
1. Introduction
The Paris Agreement, that dealing with greenhouse gas emission mitigation, was negotiated by representatives of 195 countries at the end of 2015. 194 members had signed and ratified the treaty in 2016. Among the greenhouse gases, the concentration of CO2 in the atmosphere increased from 280 ppm in 1750 to 400 ppm in 2015. For this reason, an approach for efficient reduction of CO2 has attracted the attention of scientists all over the world.1–3 CO2 recycling is one of the promising ways that will not only reduce CO2 concentration but also produce some valuable chemicals like methanol, which is a key chemical feedstock and an alternative fuel.4,5In published works, it was popularly accepted that Cu/ZnO-based catalysts were active for the hydrogenation of CO2 to methanol,6–11 and the activity of Cu-based catalysts depended mainly on the dispersion of Cu. However, the latest achievements disclosed that the interfacial area between Cu and ZnO played a crucial role for the activity and stability of the Cu/ZnO catalyst in methanol synthesis.12–14 Cu/ZnO catalysts are usually prepared by co-precipitation using precipitation agents containing sodium,8–11,15–18 while Kondrat et al. pointed out that residual sodium ions were a potential catalyst poison.19 Therefore, the development of novel and effective techniques for preparing Cu/ZnO-based catalysts is of great importance.
Karelovic et al. found that Cu/ZnO catalysts prepared by combustion exhibited higher activity than those prepared via conventional coprecipitation methods, and the activity related to the contact between Cu and ZnO.20 Valant et al.21 reported that the activity of Cu/ZnO for methanol production changed with the content of Zn showed a volcano-like profile. Similar studies also confirmed that synergetic effect between Cu and ZnO could be responsible for the catalytic activity of Cu/ZnO catalysts in the synthesis of methanol from CO2 hydrogenation.7,9,22–28 Tsang et al.7 disclosed that morphology of ZnO had a significant effect on its interaction with Cu in the hydrogenation of CO2 to methanol. Plate-like ZnO showed a strong interaction with Cu, which leaded to high selectivity of methanol. Previous work in our laboratory also found that filament-like ZnO supported Cu catalyst was highly active for CO2 hydrogenation,11 which might be attributed to that filament-like ZnO possessed large polar plane, and the interaction between Cu and ZnO was strong. At the same time, Khanna et al.29 developed a wet chemical reduction method to prepare nanosized Cu particles, in which a reduction reaction occured between Cu2+ and reducing agent. This method is simple, easy in control and can prepare metallic Cu without further reduction.
In this work, cylindrical shaped ZnO was synthesized via controlled hydrothermal precipitation of Zn(CO2CH3)2·2H2O, and Cu was further deposited on ZnO via the in situ reduction of Cu2+ with L-ascorbic acid in aqueous solution. The physicochemical properties of prepared Cu/ZnO were characterized by X-ray diffraction (XRD), scanning electron microscope (SEM), N2 adsorption, N2O chemisorption techniques, Raman spectra, X-ray photoelectron spectroscopy (XPS), H2 and CO2 chemisorption, H2-TPD, and CO2-TPD techniques. The relationship between the physiochemical properties of Cu/ZnO and its performance in hydrogenation of CO2 was discussed.
2. Experimental section
2.1. Synthesis of cylindrical shaped ZnO
12.00 g of Zn(CO2CH3)2·2H2O (Aladdin, 99.99%) was dissolved in deionized water (240 mL), and then 7.32 g of diethylenetriamine (Aladdin, 99%) was added under vigorous stirring. After diethylenetriamine was dissolved, the solution was transferred into a 500 mL polytetrafluoroethylene-lined autoclave and kept at 97 °C for 24 h, and then cooled to room temperature. The precipitate was filtered and washed thoroughly with deionized water to remove excess precursor and dried at 60 °C for 12 h, and further calcined in air at 450 °C for 2 h.2.2. Synthesis of Cu
20 mmol of Cu(CO2CH3)2·H2O (Alfa Aesar, 99.9%) was dissolved in 50 mL of deionized water. The resulting solution was heated to 70 °C in an oil bath with magnetic stirring. A 60 mL of L-ascorbic acid (Alfa Aesar, ≥99%) aqueous solution (1.0 M) was added dropwise into the flask to reduce Cu2+ under vigorous stirring. The black precipitate was filtered and washed with ethanol, dried in vacuum at 60 °C for 12 h and stored in desiccator (in N2).2.3. Deposition of Cu on ZnO
Cu(CO2CH3)2·H2O aqueous solution was prepared by dissolving 20 mmol of Cu(CO2CH3)2·H2O in 50 mL of deionized water and then the as-prepared cylindrical shaped ZnO (10 mmol) was added. The resulting suspension solution was heated to 70 °C in an oil bath with magnetic stirring. A 60 mL of L-ascorbic acid aqueous solution (1.0 M) was added dropwise into the flask to reduce Cu2+ under vigorous stirring. After reaction, the black precipitate was filtered and washed with ethanol. The solid was dried in vacuum at 60 °C for 12 h and stored in desiccator (in N2). The prepared catalyst was designated as CZ-2. CZ-1, CZ-3 and CZ-4 were also prepared in the same procedure (L-ascorbic acid/Cu2+ = 3, molar ratio) with different copper acetate amount, in which 1, 3 and 4 mean Cu/Zn molar ratio. For comparison, the Cu/ZnO catalyst (with a Cu/Zn atomic ratio of 2) was prepared by carbonate coprecipitation.11 After hydrogen reduction at 270 °C for 2 h, the catalyst was identified as CA-CC.2.4. Characterization
The composition of prepared catalysts was examined by inductively coupled plasma-atomic emission spectrometry (ICP, Plasma-Spec-II spectrometer), and the actual copper content in prepared catalysts was confirmed and summarized in Table 1.| Catalysts | Cu/(Cu + Zn)a (mol%) | SBET (m2 g-cat−1) | dCu (nm) | SCub (m2 g-cat−1) | |||||||||||||||||||||||||||||||||||||||||||||||||||||||||||||||||||||||||||||||||||||||||||||||
|---|---|---|---|---|---|---|---|---|---|---|---|---|---|---|---|---|---|---|---|---|---|---|---|---|---|---|---|---|---|---|---|---|---|---|---|---|---|---|---|---|---|---|---|---|---|---|---|---|---|---|---|---|---|---|---|---|---|---|---|---|---|---|---|---|---|---|---|---|---|---|---|---|---|---|---|---|---|---|---|---|---|---|---|---|---|---|---|---|---|---|---|---|---|---|---|---|---|---|---|
| a Determined by ICP method.b Determined by N2O chemisorption method. | |||||||||||||||||||||||||||||||||||||||||||||||||||||||||||||||||||||||||||||||||||||||||||||||||||
| ZnO | 0 | 7.8 | — | — | |||||||||||||||||||||||||||||||||||||||||||||||||||||||||||||||||||||||||||||||||||||||||||||||
| CZ-1 | 49.2 | 23.7 | 9.6 | 8.2 | |||||||||||||||||||||||||||||||||||||||||||||||||||||||||||||||||||||||||||||||||||||||||||||||
| CZ-2 | 66.3 | 35.5 | 7.3 | 12.3 | |||||||||||||||||||||||||||||||||||||||||||||||||||||||||||||||||||||||||||||||||||||||||||||||
| CZ-3 | 74.4 | 26.3 | 13.2 | 9.6 | |||||||||||||||||||||||||||||||||||||||||||||||||||||||||||||||||||||||||||||||||||||||||||||||
| CZ-4 | 79.6 | 21.2 | 14.1 | 7.4 | |||||||||||||||||||||||||||||||||||||||||||||||||||||||||||||||||||||||||||||||||||||||||||||||
| CZ-CC | 66.9 | 38.8 | 10.5 | 10.9 | |||||||||||||||||||||||||||||||||||||||||||||||||||||||||||||||||||||||||||||||||||||||||||||||
| Cu | 100.0 | 3.3 | 67.1 | 3.1 | |||||||||||||||||||||||||||||||||||||||||||||||||||||||||||||||||||||||||||||||||||||||||||||||
XRD analysis was carried out on a Rigaku D/MAX-2500 diffractometer with a scanning angle of 15–85° by Cu Kα radiation. SEM images of these catalysts were obtained using Leo Series VP 1430 microscope operated at 10 kV. After samples were pretreated at 250 °C for 4 h in vacuum, N2 adsorption was measured at −196 °C using an ASAP 2010 analyzer. Surface area was calculated according to the BET method, which used 0.164 nm2 as the cross-sectional area of the nitrogen molecule. The metallic copper surface areas (SCu) were measured using a N2O chemisorption method as described elsewhere.30 The surface area of copper was calculated by assuming that the surface density of atomic copper was 1.46 × 10¹⁹ Cu atoms per m2 and molar stoichiometry of N2O/Cu was 0.5. Raman analysis was performed on a Jobin Yvon Labram HR800 spectrometer. XPS measurement was performed using a Mg Kα ray as excitation source (hν = 1253.6 eV) on a PerkinElmer PHI 5000C system. Surface contamination of C 1s peak (284.6 eV) was used as internal standard calibration binding energy.
H2 (or CO2) chemisorption measurements were performed at 30 °C using a Micromeritics Autochem 2920 II apparatus. 0.30 g of the catalyst was loaded between two quartz wool balls into a quartz U-shaped tube reactor. The measurements were carried out by pulses injection (0.551 mL) of 10% H2/Ar (or 10% CO2/He) until saturation. Chemisorbed and physisorbed H2 (or CO2) consumption was monitored by a thermal conductivity detector (TCD), which was denoted Atotal. The sample was then degassed with Ar (or He) for 10 min to evacuate physisorbed H2 (or CO2). Physisorbed H2 (or CO2) consumption was measured by another series of H2 (or CO2) pulses under the same conditions, which was denoted Aphys. The chemisorbed H2 (or CO2) was calculated as follows:
| Achem = Atotal − Aphys |
H2 or CO2 temperature-programmed desorption (H2-TPD or CO2-TPD) of catalysts were performed on Micromeritics Autochem 2920 II apparatus. H2 or CO2 stream was introduced for adsorption (30 min) at room temperature. After adsorption, the samples were flushed with Ar (H2-TPD) or He (CO2-TPD) stream (30 mL min−1) for 30 min to remove weakly adsorbed H2 or CO2, and then they were heated from 20 to 700 °C at a rate of 10 °C min−1. The desorbed H2 or CO2 was detected by TCD.
2.5. Catalyst reactions
The activity of the catalyst was tested in a continuously flowing fixed-bed reactor (MRCS8004). 1.0 g of the catalyst diluted with quartz sand (both in 20–40 mesh) was charged into a stainless steel tubular reactor. Then, CO2 (99.9%) and H2 (99.9%) was introduced. The reaction conditions used in the activity test were 240 °C, 3.0 MPa, 0.54 mol (g-cat h)−1 and molar feed composition of CO2/H2 = 1/3. All post reactor lines and valves were heated to 150 °C to prevent product condensation. The products were analyzed online by gas chromatography (Agilent 6820). Methanol was measured by a flame ionization detector with a Porapak-Q column and other gaseous products were analyzed by a thermal conductivity detector with a Carbosieve column. The conversion and selectivity values were calculated as the average of three different analyses performed after 2 hours of flow operation.3. Results and discussion
3.1. Structure of the catalysts
Cu content in prepared catalysts was determined in ICP and summarized in Table 1. The real content of Cu was quite close to the theoretical values, indicating that the composition of CZ catalysts via in situ chemical reduction could be precisely controlled.Fig. 1a shows the XRD patterns of cylindrical shaped ZnO prepared by the hydrothermal synthesis method and Cu obtained with chemical reduction method. All diffraction peaks of ZnO could be ascribed to wurtzite ZnO, and no other impurity peaks was observed. These results indicated that mainly well crystallized ZnO was formed in the hydrothermal reaction. It can be found that the diffraction lines of Cu appeared at 2θ = 43.1° and 50.2°. These data confirmed that the Cu2+ was reduced to metallic Cu by L-ascorbic acid in the aqueous solution.
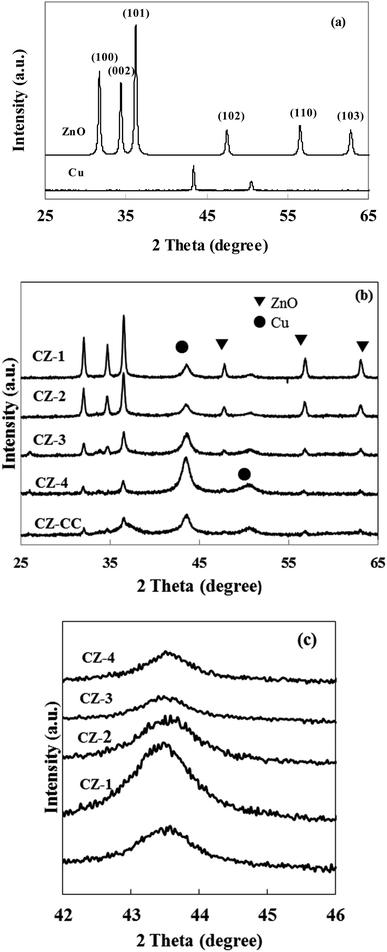 | ||
| Fig. 1 XRD patterns of cylindrical shaped ZnO, Cu and CZ catalysts. (a) Cylindrical shaped ZnO and Cu; (b) CZ catalysts; (c) Cu (111). | ||
Fig. 1b and c show the XRD patterns of CZ catalysts with different Cu/ZnO molar ratios obtained by in situ reduction reaction and carbonate coprecipitation. The diffraction peak of Cu (111) was weakened and broadened when Cu/Zn molar ratio was less than 2, which implied that crystallite size of Cu was small. In contrast, the diffraction peaks of Cu enhanced when the molar ratio Cu/Zn increased to 4, which meant that the crystallite size of Cu would be large. Similar phenomena were also reported by Lee et al.31 The average crystallite size of Cu was calculated using Scherrer's equation and summarized in Table 1. It can be found that the crystallite size of Cu was 67.1, 9.6, 7.3, 13.2, 14.1 and 10.5 nm in Cu, CZ-1, CZ-2, CZ-3, CZ-4 and CZ-CC, respectively, which indicated that ZnO could promote the dispersion of Cu. Another interesting observation was that the diffraction intensity of ZnO decreased gradually with the increase of Cu content. The diffraction peak of polar (002) plane of ZnO disappeared and only wide and weak diffraction peaks of nonpolar (001) and (101) planes were observed over CZ-4, which suggested that the polarity and crystallite size of ZnO decreased with the increase of Cu content. The diffraction peak of (002) plane of ZnO over CZ-CC was also weak, which suggested that the polarity of ZnO was also weak. Zhu et al.32 found that plate-like ZnO possessed mostly polar (002) faces contained more oxygen vacancies, while rod-like ZnO had mostly nonpolar (101) faces contained less oxygen vacancies.
Fig. 2a shows the SEM image of ZnO sample prepared by controlled hydrothermal precipitation of Zn(CO2CH3)2·2H2O. The diameter of cylindrical shaped ZnO is about 7 μm. Fig. 2b is the image of Cu prepared by chemical reduction method. It reveals that the shape of Cu is sphere-like with diameter of 3 μm. Interestingly, when ZnO was used as carrier for heterogeneous nucleation and growth of Cu, different shapes of Cu were observed, ranging from sphere to irregular shape (Fig. 2c–e). The result demonstrates that there is strong interaction between Cu and ZnO. The particle sizes of Cu over CZ catalysts are also smaller than pure Cu, implying that ZnO can promote the dispersion of Cu.
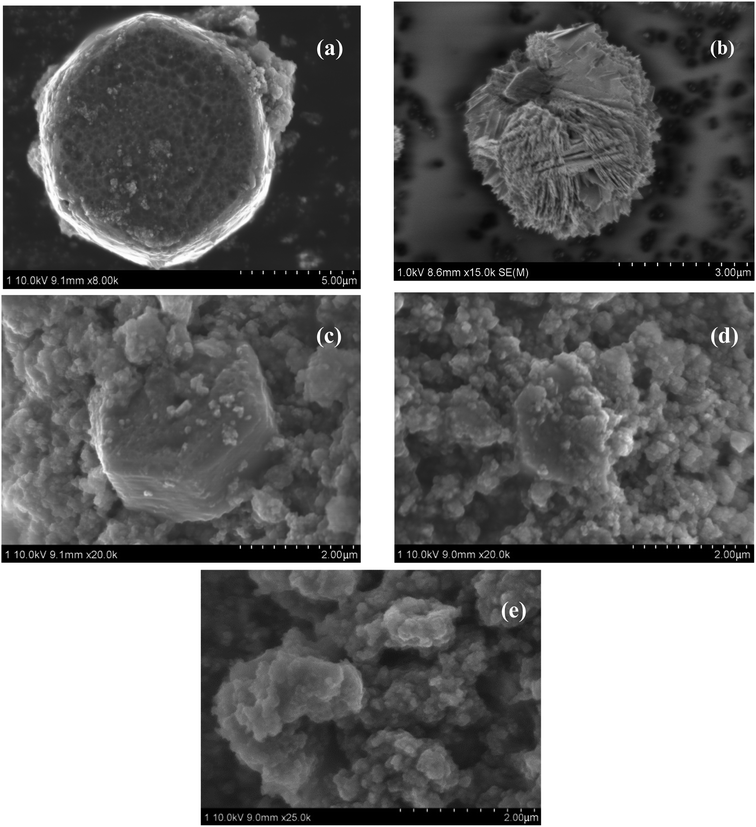 | ||
| Fig. 2 SEM images of cylindrical shaped ZnO, Cu and CZ catalysts. (a) Cylindrical shaped ZnO; (b) Cu; (c) CZ-1; (d) CZ-2; (e) CZ-4. | ||
Fig. 2c–e are the images of CZ-1, CZ-2 and CZ-4 prepared by a in situ chemical reduction reaction. An increase in Cu content leaded to a change in particle size of Cu. The minimum particle size was obtained for CZ-2, and then an increase in particle size of Cu appeared for CZ-4. This result was in accordance with the result of XRD. Furthermore, it can be seen from Fig. 2c–e that the particle size of cylindrical shaped ZnO decreased with the increase in the Cu content and ZnO was coated with large amount of Cu over CZ-4. The result also correlated well with the result of XRD.
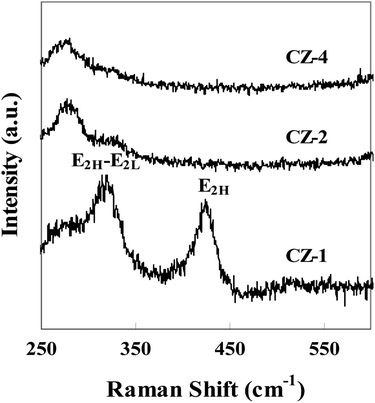
Fig. 3 shows Raman spectra of catalysts with different copper loading. The Raman shift at around 323 cm−1 belonged to the E2H–E2L phonon mode of ZnO, and another peak at around 428 cm−1 was attributed to the high frequency optical phonon mode (E2H) of ZnO.33 The characteristic peaks of Raman spectra indicated that ZnO was in the form of wurtzite structure. Fig. 3 also confirmed that the position, width and intensity of E2H–E2L and E2H peaks changed obviously with the increasing content of Cu. The position of peak shifted to low wave number, width of peak broadened and its intensity became small, which indicated that Cu contacted strongly with ZnO.33,34
The BET surface area and exposed Cu surface area in pure Cu, ZnO and CZ catalysts were summarized in Table 1. The exposed Cu surface area of CZ catalysts was higher than that of pure Cu, which indicated that ZnO could dispersed Cu. It can be also found that surface area of Cu/ZnO catalyst prepared by in situ chemical reduction reaction passed its maximum (35.5 m2 g-cat−1, in CZ-2) and then decreased slightly with the increasing content of Cu, and the detected surface area of exposed Cu exhibited in a similar tendency. However, both BET surface area and exposed Cu surface area reduced progressively with high Cu loadings, which could be due to copper agglomeration at Cu/Zn molar ratio > 2. CZ-2 had the largest BET surface area (35.5 m2 g-cat−1) and the largest exposed Cu surface area (12.3 m2 g-cat−1). These results showed that the Cu/Zn ratio could influence the BET surface area and exposed Cu surface area. It can be also found from Table 1 that CZ-2 prepared by in situ chemical reduction reaction has larger exposed Cu surface areas than that obtained by carbonate coprecipitation, which correlated well with Cu crystallite size.
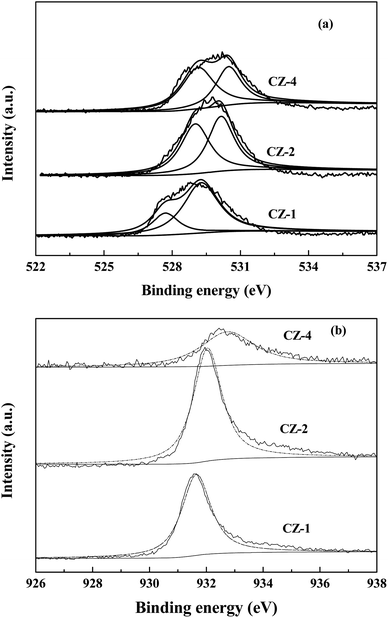
Fig. 4 shows the XPS date of CZ-1, CZ-2 and CZ-4 catalysts obtained by in situ chemical reduction reaction. Fig. 4a reveals that the binding energy value of O 1s for CZ-1 (528.9 eV) is lower than that of CZ-2 (529.7 eV) and CZ-4 (530.2 eV), implying that electrons are easier to be excited from ZnO over CZ-1 and ZnO over CZ-1 has more oxygen vacancies.11 From Fig. 4a, it is found that O 1s XPS band can be decomposed into low binding energy peak and high binding energy peak, which are attributed to lattice oxygen (Olatt) and oxygen vacancies (Ovac), respectively.35,36 With the increase of copper content, the Ovac/Olatt molar ratio decreases gradually. The result indicates that CZ-1 has more oxygen vacancies. The binding energy value of Cu 2p3/2 of CZ catalysts is shown in Fig. 4b. It can be found that the binding energy value of Cu 2p3/2 of CZ-1 is lower than that of CZ-2 and CZ-4 catalysts. The [O] terminated polar (002) facet is known to be electron richer than those of nonpolar facets (i.e. 100) that contain equal number of cations and anions.7 The XRD result has demonstrated that reflection of polar (002) facet of ZnO reduces with the increase of Cu content, implying that electrons are easier to transfer from ZnO over CZ-1 to Cu.
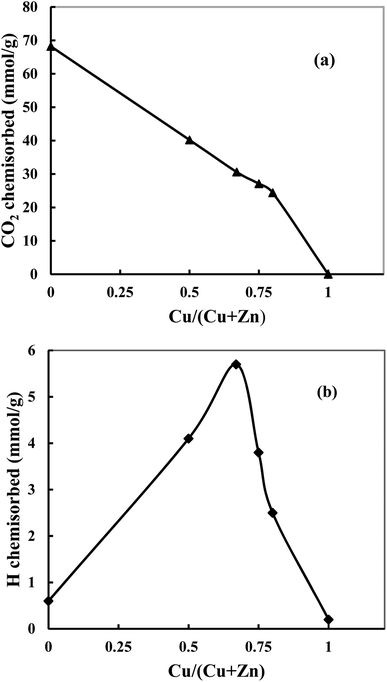
Fig. 5a shows that when the Cu content increases, the amount of chemisorbed CO2 decreases, and bare Cu does not adsorb CO2. The observation indicates that adsorbed CO2 amount is inversely proportional to the Cu content since the addition of Cu decreases the basicity of the catalyst and therefore is not in favor of the adsorption of acidic CO2. However, this decrease is slower than what can be expected from a linear trend (Fig. 5a, dotted lines). This indicates that the basicity of ZnO in catalysts has been increased with increase of Cu content, which is in agreement with the amount of oxygen vacancies (the Lewis basicity is increased in the absence of vacancies). Hydrogen chemisorption experiments are shown in Fig. 5b. It can be found that hydrogen is weakly chemisorbed on pure Cu since Cu is known to quickly decompose and recombine hydrogen.37 However, ZnO can adsorb atomic H through hydrogen spillover,21,38 which leads a strong adsorption. When the ZnO content increases, a volcano-type profile is observed showing a maximum of chemisorbed hydrogen for CZ-2. This shape is characteristic of a synergetic effect where the combination of Cu and Zn permits a significant increase of adsorbed hydrogen. This evolution matches exposed Cu surface area. The investigation of CO2 and H2 chemisorption suggests that both Cu and ZnO are active sites.
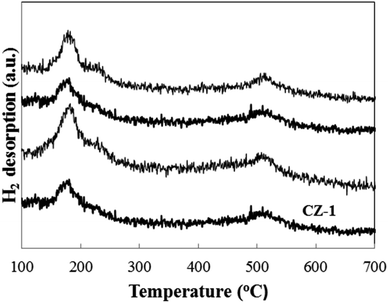
Fig. 6 shows the H2-TPD patterns of CZ-1, CZ-2 and CZ-4 catalysts obtained by in situ chemical reduction reaction. For comparison, the CZ-CC catalyst obtained by carbonate coprecipitation was also investigated. It is found that all samples display a H2 desorption peak in the range of 120–300 °C, which is assigned to the desorption of atomic hydrogen adsorbed on the surface of metallic Cu sites.39 Another strong H2 desorption peak located in the range of 450–600 °C is also discovered for all samples. It represents the desorption of strongly-adsorbed hydrogen on the ZnO surface through spillover from Cu to ZnO.39 From Fig. 6, it is found that the maximum H2 desorption amount is obtained for CZ-2 with increase in Cu content. Under the same Cu/Zn molar ratio, the H2 desorption amount CZ-2 is larger than that over CZ-CC. This result matches exposed Cu surface area.
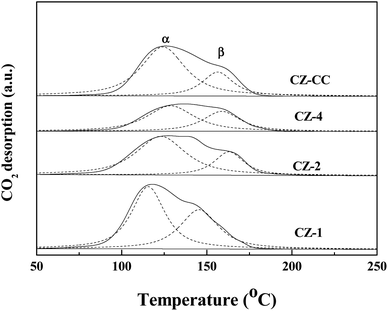
Fig. 7 shows the CO2 desorption profiles of CZ-1, CZ-2, CZ-4 and CZ-CC catalysts. From CO2-TPD results, it can be observed that all profiles can be deconvoluted into two Gaussian peaks, which can be assigned to the weakly-adsorbed CO2 on the weak basic sites and strongly-adsorbed CO2 on the strong basic sites, respectively. The CO2 adsorption capacity order of CZ catalysts as follows: CZ-1 > CZ-CC > CZ-2 > CZ-4. The result indicates that the addition of Cu decreases the basicity of the catalyst. CZ-CC has stronger basicity than CZ-2 under the same ZnO content, which can be attributed to fewer oxygen vacancies.
3.2. Catalytic performance
The catalytic activity and selectivity of these catalysts for CO2 hydrogenation to methanol are summarized in Table 2. Methanol and CO are the only carbon-containing products under the reaction conditions. It can be seen that the conversion of CO2 increased with increasing Cu/Zn molar ratio from 0 to 2. However, when the Cu content was increased further, the conversion of CO2 decreased. If bare Cu was used, no CO2 conversion was observed. These results indicated that bare Cu did not adsorbed CO2. CZ-2 catalyst exhibited the best activity for CO2 hydrogenation with a 17.8% conversion of CO2. The calculated space time yield (STY) of CZ-2 reached maximum of 0.50 g-MeOH (g-cat h)−1, while STY decreased to 0.18 g-MeOH (g-cat h)−1 over CZ-4. The conversion of CO2 and STY decreased to 13.2% and 0.28 g-MeOH (g-cat h)−1 over CZ-CC. Under the same reaction conditions, STY was 0.24 g-MeOH (g-cat h)−1 over the CZ catalyst prepared by conventional carbonate co-precipitation method.11 Gao et al.39 reported that STY was 0.34 g-MeOH (g-cat h)−1 over the Cu/ZnO/Al2O3 prepared by the co-precipitation method (reaction conditions: H2/CO2 = 3, T = 250 °C, P = 5.0 MPa, GHSV = 0.54 mol (g-cat h)−1). As well known, for Cu-based catalysts, a larger exposed Cu surface area results in a higher catalytic activity.40,41 The amount of chemisorbed hydrogen increases with increase of exposed Cu surface area, which leads to higher CO2 conversion. At the same time, the results of N2O chemisorption measurements suggested that the exposed Cu surface area increased firstly and then decreased with the increase of Cu content. CZ-2 catalyst exhibited the largest exposed Cu surface area.| Catalysts | CO2 conversion (%) | CH3OH selectivity (%) | STY (g-MeOH (g-cat h)−1) | TOF of CH3OH ×103 (s−1) | |||||||||||||||||||||||||||||||||||||||||||||||||||||||||||||||||||||||||||||||||||||||||||||||
|---|---|---|---|---|---|---|---|---|---|---|---|---|---|---|---|---|---|---|---|---|---|---|---|---|---|---|---|---|---|---|---|---|---|---|---|---|---|---|---|---|---|---|---|---|---|---|---|---|---|---|---|---|---|---|---|---|---|---|---|---|---|---|---|---|---|---|---|---|---|---|---|---|---|---|---|---|---|---|---|---|---|---|---|---|---|---|---|---|---|---|---|---|---|---|---|---|---|---|---|
| a Reaction conditions: H2/CO2 = 3, T = 240 °C, P = 3.0 MPa, GHSV = 0.54 mol (g-cat h)−1. | |||||||||||||||||||||||||||||||||||||||||||||||||||||||||||||||||||||||||||||||||||||||||||||||||||
| ZnO | 0.2 | 91.2 | 0.01 | — | |||||||||||||||||||||||||||||||||||||||||||||||||||||||||||||||||||||||||||||||||||||||||||||||
| CZ-1 | 11.9 | 71.5 | 0.37 | 17.0 | |||||||||||||||||||||||||||||||||||||||||||||||||||||||||||||||||||||||||||||||||||||||||||||||
| CZ-2 | 17.8 | 64.7 | 0.50 | 15.4 | |||||||||||||||||||||||||||||||||||||||||||||||||||||||||||||||||||||||||||||||||||||||||||||||
| CZ-3 | 12.6 | 54.2 | 0.30 | 11.7 | |||||||||||||||||||||||||||||||||||||||||||||||||||||||||||||||||||||||||||||||||||||||||||||||
| CZ-4 | 8.7 | 48.3 | 0.18 | 9.4 | |||||||||||||||||||||||||||||||||||||||||||||||||||||||||||||||||||||||||||||||||||||||||||||||
| CZ-CC | 13.2 | 49.9 | 0.28 | 9.5 | |||||||||||||||||||||||||||||||||||||||||||||||||||||||||||||||||||||||||||||||||||||||||||||||
| Cu | 0.0 | 0.0 | 0.00 | 0.0 | |||||||||||||||||||||||||||||||||||||||||||||||||||||||||||||||||||||||||||||||||||||||||||||||
Furthermore, it is noteworthy that a remarkable decrease in methanol selectivity can be observed with the increase in Cu content. The value of methanol selectivity over CZ-4 was 48.3%, which decreased by about 47% relative to ZnO (91.2%). This result was consistent with the reduction of oxygen vacancies. Hydrogen was spilled on ZnO and ZnOx (oxygen vacancies) by hydrogen spillover phenomenon9 where CO2 was adsorbed. We supposed that atomic H adsorbed on ZnO reacted with CO2 to produce CO, while atomic H adsorbed on ZnOx reacted with CO2 to synthesize methanol.
Table 2 shows the effect of Cu loading on TOF value of methanol over CZ catalyst. The TOF value of methanol decreased with the increase of Cu/Zn molar ratio. These results indicated that the CZ catalyst was a structural sensitive catalyst for methanol synthesis from CO2 hydrogenation. Tsang et al.7 proposed that Cu/ZnO catalyst had double active centers: one was Cu, and another was the oxygen vacancy on the interface of the Cu–Zn. In our experiment, the increase of Cu loading led to the decrease of TOF value of methanol, which was attributed to reduction of oxygen vacancy between Cu–Zn interface leading to the decrease of methanol selectivity. In view of the above, we presented that the mechanism of CO2 hydrogenation over Cu/ZnO catalysts could be described as follows: firstly, the hydrogen was adsorbed on the Cu surface and dissociated into hydrogen atoms. Secondly, hydrogen atoms arrived at the ZnO and ZnOx surface on the interface of Cu–Zn by hydrogen spillover effect to react with CO2 adsorbed on ZnO and ZnOx. Finally, methanol was generated on ZnOx through a series of intermediate, and CO was produced on ZnO.
The most efficient CZ-2 catalyst was selected for a stability test, and the result was presented in Fig. 8. The conversion of CO2 and the selectivity of methanol decreased slightly during the continuous 100 h, indicating that the CZ catalysts prepared by in situ chemical reduction reaction involved impregnation of cylindrical shaped ZnO with Cu2+ aqueous solution had a stable catalytic performance for CO2 hydrogenation to methanol.
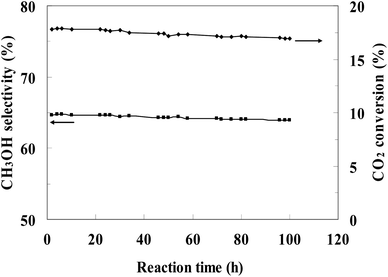 | ||
| Fig. 8 Stability of CZ-2 for the CO2 hydrogenation process. (Reaction conditions: H2/CO2 = 3, T = 240 °C, P = 3.0 MPa, GHSV = 0.54 mol (g-cat h)−1). | ||
4. Conclusions
The cylindrical shaped ZnO was synthesized by hydrothermal process. Four Cu/ZnO catalysts were prepared via in situ chemical reduction reaction between Cu2+ and L-ascorbic acid involved impregnation of cylindrical shaped ZnO with Cu2+ aqueous solution. For comparison, the catalyst prepared by carbonate coprecipitation was also synthesized. The physicochemical properties and catalytic activity of the catalysts are strongly influenced by the Cu content. With the increase in Cu/Zn molar ratio, the BET surface area and exposed Cu surface area exhibited a volcanic shaped curve, and the polarity of ZnO decreased. The CZ-2 catalyst had the highest exposed Cu surface area and more oxygen vacancies, which exhibited an optimum catalytic activity. This observation indicates that the CO2 conversion is correlated with the amount of chemisorbed hydrogen. The methanol selectivity decreased with reduction of oxygen vacancies in ZnO, which suggested that active sites for methanol and CO were different, and oxygen vacancies were active sites for methanol. No activity for methanol was observed on pure Cu, which showed clearly that the Cu–Zn synergy had a very critical role in the methanol formation. CZ-2 catalyst exhibited the superior catalytic performance than CZ-CC obtained by conventional coprecipitation method. This method is a promising way for preparation of highly effective Cu/ZnO catalysts.Conflicts of interest
There are no conflicts to declare.Acknowledgements
This work was financially supported by Basic Public Welfare Research Project of Zhejiang (grant number LGG18B020003), Science and Technology Project of Quzhou (grant number 2016Y005), National College Students Innovation Project of China (grant number 201711488017).References
- A. Goeppert, M. Czaun, J. P. Jones, G. K. S. Prakash and G. A. Olah, Chem. Soc. Rev., 2014, 43, 7995–8048 RSC.
- H. B. Song, N. Zhang, C. Y. Zhong, Z. Liu, M. Xiao and H. J. Gai, New J. Chem., 2017, 41, 9170–9177 RSC.
- P. De Luna, R. Q. Bermudez, C. T. Dinh, M. B. Ross, O. S. Bushuyev, P. Todorović, T. Regier, S. O. Kelley, P. d. Yang and E. H. Sargent, Nat. Catal., 2018, 1, 103–110 CrossRef.
- G. T. Zeng, J. Qiu, Z. Li, P. Pavaskar and S. B. Cronin, ACS Catal., 2014, 4, 3512–3516 CrossRef CAS.
- G. O. Olah, A. Goeppert and G. K. S. Prakash, J. Org. Chem., 2009, 74, 487–498 CrossRef CAS.
- X. M. Guo, D. S. Mao, G. Z. Lu, S. Wang and G. S. Wu, Catal. Commun., 2011, 12, 1095–1098 CrossRef CAS.
- F. L. Liao, Y. Q. Huang, J. W. Ge, W. R. Zheng, K. Tedsree, P. Collie, X. L. Hong and S. C. Tsang, Angew. Chem., 2011, 123, 2210–2213 CrossRef.
- P. Gao, F. Li, F. K. Xiao, N. Zhao, N. N. Sun, W. Wei, L. S. Zhong and Y. H. Sun, Catal. Sci. Technol., 2012, 2, 1447–1454 RSC.
- Y. Jiang, H. Y. Yang, P. Gao, X. P. Li, J. M. Zhang, H. J. Liu, H. Wang, W. Wei and Y. H. Sun, J. CO2 Util., 2018, 26, 642–651 CrossRef CAS.
- F. Arena, G. Mezzatesta, G. Zafarana, G. Trunfio, F. Frusteri and L. Spadaro, J. Catal., 2013, 300, 141–151 CrossRef CAS.
- H. Lei, R. F. Nie, G. Q. Wu and Z. Y. Hou, Fuel, 2015, 154, 161–166 CrossRef CAS.
- S. Kuld, M. Thorhauge, H. Falsig, C. F. Elkjær, S. Helveg, I. Chorkendorff and J. Sehested, Science, 2016, 352, 969–974 CrossRef CAS.
- S. Kattel, P. J. Ramírez, J. G. Chen, J. A. Rodriguez and P. Liu, Science, 2017, 355, 1296–1299 CrossRef CAS PubMed.
- S. Kuld, C. Conradsen, P. G. Moses, I. Chorkendorff and J. Sehested, Angew. Chem., Int. Ed., 2014, 53, 5941–5945 CrossRef CAS PubMed.
- F. Frusteri, M. Cordaro, C. Cannilla and G. Bonura, Appl. Catal., B, 2015, 162, 57–65 CrossRef CAS.
- F. Arena, K. Barbera, G. Italiano, G. Bonura, L. Spadaro and F. Frusteri, J. Catal., 2007, 249, 185–194 CrossRef CAS.
- N. Mota, R. Guil-Lopez, B. G. Pawelec, J. L. G. Fierro and R. M. Navarro, RSC Adv., 2018, 8, 20619–20629 RSC.
- H. Jeong, C. H. Cho and T. H. Kim, React. Kinet., Mech. Catal., 2012, 106, 435–443 CrossRef CAS.
- S. A. Kondrat, P. J. Smith, P. P. Wells, P. A. Chater, J. H. Carter, D. J. Morgan, E. M. Fiordaliso, J. B. Wagner, T. E. Davies, L. Lu, J. K. Bartley, S. H. Taylor, M. S. Spencer, C. J. Kiely, G. J. Kelly, C. W. Park, M. J. Rosseinsky and G. J. Hutchings, Nature, 2016, 531, 83–87 CrossRef CAS.
- A. Karelovic, A. Bargibant, C. Fernández and P. Ruiz, Catal. Today, 2012, 197, 109–118 CrossRef CAS.
- A. Le Valant, C. Comminges, C. Tisseraud, C. Canaff, L. Pinard and Y. Pouilloux, J. Catal., 2015, 324, 41–49 CrossRef CAS.
- T. Witoon, T. Permsirivanich, W. Donphai, A. Jaree and M. Chareonpanich, Fuel Process. Technol., 2013, 116, 72–78 CrossRef CAS.
- J. Schumann, M. Eichelbaum, T. Lunkenbein, N. Thomas, M. C. Á. Galvan, R. Schlögl and M. Behrens, ACS Catal., 2015, 5, 3260–3270 CrossRef CAS.
- A. A. Khassin, V. V. Pelipenko, T. P. Minyukova, V. I. Zaikovskii, D. I. Kochubey and T. M. Yurieva, Catal. Today, 2006, 112, 143–147 CrossRef CAS.
- M. Kurtz, N. Bauer, C. Büscher, H. Wilmer, O. Hinrichsen, R. Becker, S. Rabe, K. Merz, M. Driess, R. A. Fischer and M. Muhler, Catal. Lett., 2004, 92, 49–52 CrossRef CAS.
- M. Peter, M. B. Fichtl, H. Ruland, S. Kaluza, M. Muhler and O. Hinrichse, Chem. Eng. J., 2012, 203, 480–491 CrossRef CAS.
- S. D. Senanayake, P. J. Ramírez, I. Waluyo, S. Kundu, K. Mudiyanselage, Z. Y. Liu, Z. Liu, S. Axnanda, D. J. Stacchiola, J. Evans and J. A. Rodriguez, J. Phys. Chem. C, 2016, 120, 1778–1784 CrossRef CAS.
- M. B. Fichtl, J. Schumann, I. Kasatkin, N. Jacobsen, M. Behrens, R. Schlögl, M. Muhler and O. Hinrichsen, Angew. Chem., Int. Ed., 2014, 53, 7043–7047 CrossRef CAS.
- P. K. Khanna, T. S. Kale, M. Shaikh, N. K. Rao and C. V. V. Satyanarayana, Mater. Chem. Phys., 2008, 110, 21–25 CrossRef CAS.
- G. C. Chinchen, C. M. Hay, H. D. Vandervell and K. C. Waugh, J. Catal., 1987, 103, 79–86 CrossRef CAS.
- S. Lee, K. Schneider, J. Schumann, A. Mogalicherla, P. Pfeifer and R. Dittmeyer, Chem. Eng. Sci., 2015, 138, 194–202 CrossRef CAS.
- G. R. Li, T. Hu, G. L. Pan, T. Y. Yan, X. P. Gao and H. Y. Zhu, J. Phys. Chem. C, 2008, 112, 11859–11864 CrossRef CAS.
- J. Iqbal, N. Safdar, T. Jan, M. Ismail, S. S. Hussain, A. Mahmood, S. Shahzad and Q. Mansoor, J. Mater. Sci. Technol., 2015, 31, 300–304 CrossRef CAS.
- Y. G. Lin, Y. K. Hsu, S. Y. Chen, L. C. Chen and K. H. Chen, J. Mater. Chem., 2011, 21, 324–326 RSC.
- M. Chen, X. Wang, Y. Yu, Z. Pei, X. Bai, C. Sun, R. Huang and L. Wen, Appl. Surf. Sci., 2000, 158, 134–140 CrossRef CAS.
- J. C. Fan and J. B. Goodenough, J. Appl. Phys., 1977, 48, 3524–3531 CrossRef CAS.
- J. Pritchard, T. Catterick and R. K. Gupta, Surf. Sci., 1975, 53, 1–20 CrossRef CAS.
- M. S. Spencer, Top. Catal., 1999, 8, 259–266 CrossRef CAS.
- P. Gao, F. Li, N. Zhao, F. K. Xiao, W. Wei, L. S. Zhong and Y. H. Sun, Appl. Catal., A, 2013, 468, 442–452 CrossRef CAS.
- L. C. Wang, Q. Liu, M. Chen, Y. M. Liu, Y. Cao, H. Y. He and K. N. Fan, J. Phys. Chem. C, 2007, 111, 16549–16557 CrossRef CAS.
- H. Lei, Z. Y. Hou and J. W. Xie, Fuel, 2016, 164, 191–199 CrossRef CAS.
| This journal is © The Royal Society of Chemistry 2019 |

