 Open Access Article
Creative Commons Attribution 3.0 Unported Licence
Measurement and modeling of the adsorption isotherms of CH4 and C2H6 on shale samples
Chao Li,
Ligong Li and
Tianhe Kang *
*
Key Laboratory of In-situ Property-improving Mining of Ministry of Education, College of Mining Engineering, Taiyuan University of Technology, Taiyuan, Shanxi, China 030024. E-mail: kangtianhe@126.com; Tel: +86-351-6014627
First published on 3rd May 2019
Abstract
CH4 and C2H6 are two common components in shale gas. Adsorption isotherms of CH4, C2H6, and their binary mixtures on shale samples are significant for understanding the fundamental mechanisms of shale gas storage and the recovery of shale resources from shale reservoirs. In this study, the thermogravimetric method is applied to obtain the adsorption isotherms of CH4, C2H6 and their binary mixtures on two typical shale core samples. A simplified local density theory/Peng–Robinson equation of state (SLD-PR EOS) model is then applied to calculate the adsorption of CH4 and C2H6 on shale, and the efficiency of the SLD-PR EOS model is thus evaluated. The results show that C2H6 exhibits a higher adsorption capacity than CH4 on shale samples, indicating the greater affinity of C2H6 to organic shale. As the molar fraction of C2H6 increases in the CH4/C2H6 mixtures, the adsorption capacity of the gas mixtures increases, indicating the preferential adsorption of C2H6 on shale. Based on the predicted results from the SLD-PR EOS model, a reasonable agreement has been achieved with the measured adsorption isotherms of CH4 and C2H6, validating the reliability of the SLD-PR EOS model for predicting adsorption isotherms of CH4 and C2H6 on shale samples. In addition, the SLD-PR EOS model is more accurate in predicting the adsorption of CH4 on shale than that of C2H6. This study is expected to inspire a new strategy for predicting the adsorption of hydrocarbons on shale and to provide a basic understanding of competitive adsorption of gas mixtures in shale reservoirs.
1. Introduction
Shale gas has been widely accepted as an important energy resource in recent years. Shale gas reservoirs possess some unique characteristics, such as extremely low permeability, rendering shale gas quite difficult to recover from such reservoirs. Compared to the conventional reservoirs, shale reservoirs generally have some unique characteristics, such as high organic content, which leads to more adsorption of hydrocarbons on shale.1 Understanding the adsorption behavior of shale gas is significant for estimating shale gas-in-place and the fundamental mechanisms of shale gas recovery.2In recent years, the adsorption behavior of shale hydrocarbons has been extensively investigated. CH4 is the most abundant gas component in shale gas, which has been paid significant attention in the previous studies.3–8 Thermogravimetric analysis and the volumetric method are two commonly used approaches for measuring the adsorption isotherms of CH4 on shale.9–14 It is found that the thermogravimetric analysis method can measure the weight difference down to 1 μg; thereby, the thermogravimetric analysis method is more accurate than the volumetric method in determining the amount of adsorption on shale. Besides CH4, C2H6 also takes an important proportion in shale gas. CH4 and C2H6 generally show different adsorption capacity on shale rocks, the so-called competitive adsorption.15 Using thermogravimetric analysis method, Wang et al.15 measured the sorption isotherms of CH4 and C2H6 on shale and reveal the competitive adsorption behavior between both components on shale samples. However, their measurements were only conducted at temperature up to 333.15 K, which is not practical to shale reservoir conditions. Furthermore, to the best of our knowledge, studies regarding to C2H6 adsorption on shale is still scarce.
Extensive mathematical adsorption models have been proposed to match the adsorption of shale hydrocarbons on shale samples, including Langmuir model, the Brunauer–Emmett–Teller (BET) model, Dubinin–Astakhov (D–A), and Dubinin–Radushkevich (D–R) models.16,17 Compared to the Langmuir model and Brunauer–Emmett–Teller (BET) model, Dubinin–Astakhov (D–A) and Dubinin–Radushkevich (D–R) models are more accurate because they specifically consider the heterogeneous and hierarchical structures of shale cores.18,19 However, these aforementioned adsorption models are only a mathematical matching process without any physical meaning. Simplified local density (SLD) theory has been recently proposed to model the adsorption of hydrocarbons on shale; such model is more accurate than the conventional models due to its consideration of the pore surface–fluid interactions.20 In addition, most of the modeling works are conducted only for the CH4 adsorption, with less studies performed for C2H6. Here, one of the main motivations behind our efforts is to validate the SLD-PR EOS model in describing adsorption of light hydrocarbons, i.e., CH4 and C2H6, on shale samples.
In this paper, the excess adsorption isotherms of CH4 and C2H6 and their binary gas mixtures are measured on two typical shale core samples using the thermogravimetric method. The adsorption of gas mixtures is compared with the adsorption of pure gases to reveal the occurrence of competitive adsorption under the shale reservoir conditions. The SLD-PR EOS model is then applied to predict the adsorption of gases on the shale samples and the effectiveness of the SLD-PR EOS model is then evaluated. The main objectives in this study are to understand the mechanisms of adsorption behavior of CH4 and C2H6 on shale samples and to evaluate the validity of SLD-PR EOS model in describing adsorption behavior of CH4 and C2H6 on shale. As a comprehensive study on gas adsorption behavior, the SLD-PR EOS model is the first time to be applied to model the adsorption isotherms of C2H6.
2. Experimental section
2.1 Materials
The gases, i.e., CH4 and C2H6, used in this study have the purities of 99.90 wt% and 99.95 wt%, respectively. Thus, the uncertainty in the measurements is not caused from the impurity of gases. Two typical shale samples are retrieved from the depth of 1356 and 1437 m in the Longmaxi formation in the Sichuan Basin of China, where the reservoir temperature is approximately 343.15 K. In order to avoid the moisture in the air, the shale core samples are crushed into small particles and sealed in the zip-locked bags.2.2 Characterization of shale core samples
In this work, the two shale samples are characterized to obtain the total organic carbon (TOC) and pore size distribution. TOC content is measured by a combustion elemental tester. First, H2SO4 is added into the shale particles to form a solution; O2 is then used to sparged the solution to remove the purgeable inorganic and organic carbon. The non-purgeable organic carbon is formed by CO2 in a combustion tube, which is then detected and used for the calculation of TOC content. The measured TOC content for each shale core sample is shown in Table 1.| Core sample | TOC content (wt%) | Dominate pore size (nm) | Specific surface area (m2 g−1) |
|---|---|---|---|
| #1 | 2.12 | 4.15 | 20.15 |
| #2 | 2.53 | 3.00 | 25.32 |
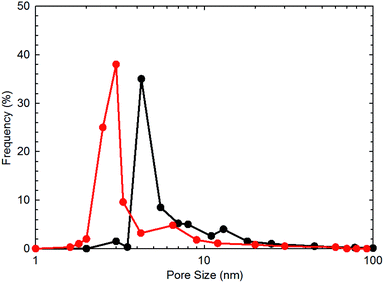
To obtain the specific surface area and pore size distribution of the shale core samples, N2 adsorption/desorption tests are adopted. The gas sorption analyzer (Quantachrome, USA) is used for conducting the measurements by measuring the N2 adsorption/desorption at 77.0 K. The specific surface area is computed with the BET equation.16 The BET surface area for each shale sample are obtained with an accuracy of ±0.5%. The results of the BET surface area for each shale sample are shown in Table 1. Fig. 1 presents the measured pore size distribution for the two shale core samples. As shown in this figure, the two shale cores possess pores with the pore size falling in the nanoscale range. In addition, the dominant pore size for the two shale cores are 4.23 and 3.00 nm, respectively.
2.3 Measurements of adsorption isotherms
Adsorption isotherms of CH4 and C2H6 are measured by using an Intelligent Gravimetric Analyser (Nanjing Haohai Science Instruments and Apparatuses Limited Company, China). Fig. 2 presents the schematic diagram of the experimental setup for measuring adsorption isotherms of CH4 and C2H6. Before the isothermal measurements, the shale core particles are placed at 385.15 K and vacuumed for 12 hours for dehydration. The Gravimetric Analyser employs the thermogravimetric analysis approach for the measurement; this means the adsorption amount is obtained by calculating the weight change of shale sample. The mass of the empty sample container, mc, and its volume, vc, are first measured at the experimental temperature. The mass of shale sample, ms, and the sample volume, vs, are then measured by placing the shale sample into the adsorption chamber. Then, the adsorption chamber is filled with the adsorbent gas, i.e., CH4 and C2H6 after vacuuming the sample chamber for 12 h at the experimental temperature. The pressure in the sample chamber increases gradually to the experimental value. Then, the apparent weight, Δm, is measured at the given pressure and temperature until it reached stabilization,2| Δm = mc + ms + ma − (vc + vs + va)ρb | (1) |
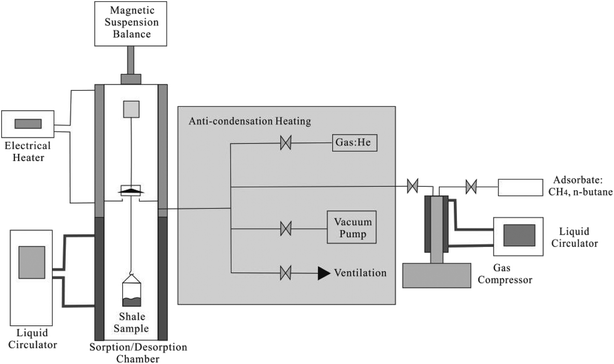 | ||
| Fig. 2 The schematic diagram of the experimental setup for measuring adsorption isotherms of CH4 and C2H6. | ||
The adsorbed mass can be calculated by,
| ma = Δm − mc − ms + (vc + vs + va)ρb | (2) |
Then the excess adsorbed mass, me, can be calculated as,
| me = ma − ρbva = Δm − mc − ms + (vc + vs)ρb | (3) |
3. Simplified local density/Peng–Robinson equation of state (SLD-PR EOS) model
The SLD-PR EOS model21 is applied to describe the CH4 and C2H6 adsorption on both shale core samples, while carbon-slit pores are employed to simulate the organic pores appeared in the shale samples. The SLD-PR EOS model can accurately calculate the fluid adsorption in nanopores by considering the fluid–fluid and fluid–solid surface interactions. Within the framework of the SLD-PR EOS model, the equation of state of CH4 and C2H6 employed the local-density approximation in obtaining the configurational energy of the adsorbed CH4 and C2H6. It is noted that the adsorbed CH4 and C2H6 distribute in-homogeneously in nanopores.22 Compared to molecular simulations, SLD/PR-EOS model considerably decreases the cost of computation.Generally, three main assumptions are used in the SLD-PR EOS model,22
(1) Chemical potential of fluid at any point in nanopores is identical to the bulk chemical potential near the solid surface;
(2) Chemical potential of fluid in nanopores is the summation of fluid–fluid and fluid–surface potentials at adsorption equilibrium;
(3) Chemical potential from fluid-surface at any point is not influenced by molecules around this point.
At adsorption equilibrium, the chemical potential of CH4 and C2H6 at the position z is calculated by the potential summation due to the fluid–fluid and fluid–surface interactions; it equals to the chemical potential of CH4 and C2H6 in bulk.
| μ(z) = μff(z) + μfs(z) = μbulk | (4) |
The bulk chemical potential of CH4 and C2H6 is expressed as a function of fugacity,
 | (5) |
 | (6) |
The chemical potential of CH4 and C2H6 in nanopore from the CH4–solid surface interaction is calculated as,21
| μfs(z) = NA[Ψfs(z) + Ψfs(L − z)] | (7) |
 | (8) |
Substituting eqn (6)–(8) into eqn (4), the criterion for adsorption equilibrium is expressed as,
 | (9) |
The PR-EOS is used to calculate CH4–CH4 and C2H6–C2H6 interactions. The PR EOS can be given as a function of density (ρ),
 | (10) |
 | (11) |
 | (12) |
The α(T) term in eqn (11) is given with the following expression.25
| α(T) = exp[(A + BTr)(1 − TrC+Dω+Eω2)] | (13) |
In the PR-EOS, the fugacity of bulk CH4 and C2H6 are calculated as,
 | (14) |
 | (15) |
In the PR EOS, covolume parameter b affects the local density of adsorbed CH4 and C2H6.22 To improve the predictive capacity of pure CH4 and C2H6 on carbon surface, Fitzgerald (2005)27 modified the covolume parameter b. To consider the repulsive interactions of the adsorbed CH4 and C2H6 at high pressure conditions, covolume parameter b is modified as,27
| bads = b(1 + Λb) | (16) |
 | (17) |
Density distribution of CH4 and C2H6 in nanopores can then be calculated by combining eqn (4) through (17). Within the SLD/PR-EOS model, the excess adsorption of CH4 and C2H6 is calculated as,
 | (18) |
The average density (ρave) of CH4 and C2H6 in nanopores is expressed as,
 | (19) |
The SLD model applies the equation of state for CH4 and C2H6, which has been simplified with a local-density approximation in obtaining the configuration energy of the adsorbed CH4 and C2H6. The local-density approximation simplified the calculation for the long-range physical interactions, which is the difference from the conventional molecular simulation methods. This simplification renders the SLD model more efficient than the molecular simulation methods in calculating the confined fluid properties in nanopores, while it could be less accurate in describing some more complex molecules compared to the molecular simulation methods.
4. Results and discussion
4.1 Adsorption isotherms of CH4 and C2H6 on shale samples
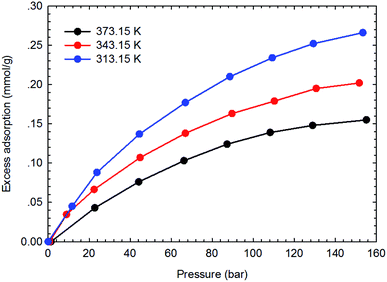
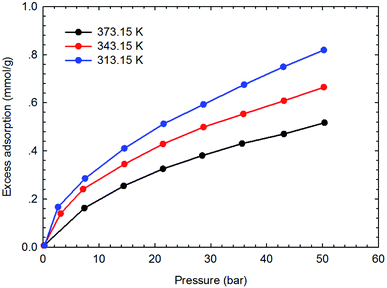
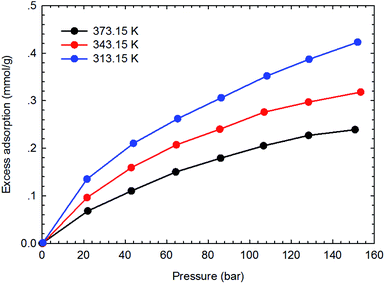
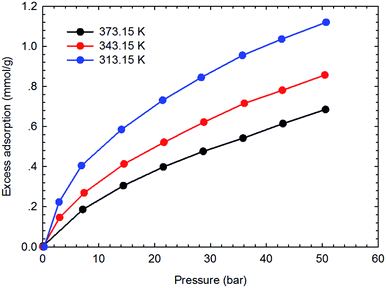
Fig. 3–6 present the measured adsorption isotherms of CH4 and C2H6 on the two typical shale samples. It is observed that adsorption of CH4 and C2H6 is expected to be influenced by the system pressure and temperature; specifically, adsorption of CH4 and C2H6 increases as pressure increases but decreases as temperature increases. As for the same shale sample, C2H6 adsorption is significantly higher than that of CH4 at the same temperature and pressure conditions, indicating the more affinity of C2H6 to the organic shale. Compared with the shale sample #1, adsorption of CH4 and C2H4 on the shale sample #2 is much higher. Based on the characterization results for the two shale samples, the specific surface area and the total organic carbon content of shale sample #2 is significantly higher than that of the shale sample #1. The adsorption capacity of hydrocarbons on solid surface correlates with the physical properties of solid, such as surface area, and mineral-composition heterogeneity etc.27 Possibly, it is the main reason why the adsorption of CH4 and C2H6 on the shale sample #2 is stronger than that on the shale sample #1.4.2 Competitive adsorption of CH4 and C2H6 on shale samples
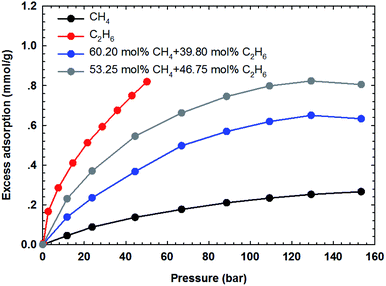
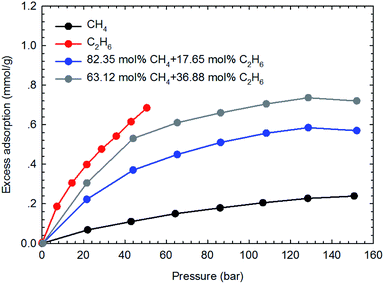
The adsorption isotherms of the binary gas mixtures of CH4–C2H6 are measured on the two shale samples. In this work, four different gas compositions, i.e., 60.20–39.80 mol%, 53.25–46.75 mol%, 82.35–17.65 mol%, and 63.12–36.88 mol% for CH4–C2H6 mixtures, are selected. The manner for isotherm measurements are conducted similarly to that adopted for the pure components. Fig. 7 and 8 show the measured adsorption isotherms for these gas mixtures. As for the two shale samples, the total excess adsorption of CH4–C2H6 mixtures increases as the molar concentration of C2H6 increases in the gas mixtures. It is possibly caused by the competitive adsorption between CH4 and C2H6 on the organic shale surface; C2H6 exhibits the preferential adsorption over CH4 on shale surface, resulting in a higher adsorption than CH4 but lower than C2H6. Additionally, we observe the maximum excess adsorption loading at about 130 bar for the four gas mixtures, while it tends to decrease beyond this pressure. However, this behavior is an exception for the pure gas adsorption isotherm under the studied conditions. The adsorption difference between gas mixtures and pure gases may be resulted from the interactions between two hydrocarbon species in the adsorption phase as well as in the free-gas phase.4.3 SLD-PR EOS model for representing the adsorption of CH4 and C2H6
The SLD-PR EOS model is applied to predict the adsorption of CH4 and C2H6 on shale samples, which are then applied to match the measured adsorption data. Specifically, two key parameters, i.e., fluid-pore surface interaction energy (εfs/k) and covolume correction parameter (Ab), are adjusted in the SLD-PR EOS model to fit the measured excess adsorption. Table 2 shows the adjusted parameters in the SLD-PR EOS model. Fig. 9–12 present the comparison results between the measured excess adsorption and the predicted excess adsorption of CH4 and C2H6 from the SLD-PR EOS model. We observe that the SLD-PR EOS model can reasonably represent the measured excess CH4 and C2H6 adsorption on the two shale samples. In addition, compared to CH4, we observe that the SLD-PR EOS model is less accurate for predicting C2H6 adsorption.| Gas sample | Core sample | Temperature (K) | L (nm) | εfs/k (K) | Ab | A (m2 g−1) |
|---|---|---|---|---|---|---|
| CH4 | #1 | 313.15 | 4.15 | 51.2 | 0.026 | 20.15 |
| 343.15 | 4.15 | 54.5 | 0.055 | 20.15 | ||
| 373.15 | 4.15 | 57.6 | 0.051 | 20.15 | ||
| #2 | 313.15 | 3.00 | 63.2 | 0.132 | 25.32 | |
| 343.15 | 3.00 | 66.3 | 0.136 | 25.32 | ||
| 373.15 | 3.00 | 64.5 | 0.127 | 25.32 | ||
| C2H6 | #1 | 313.15 | 4.15 | 53.5 | 0.035 | 20.15 |
| 343.15 | 4.15 | 56.8 | 0.056 | 20.15 | ||
| 373.15 | 4.15 | 59.3 | 0.032 | 20.15 | ||
| #2 | 313.15 | 3.00 | 67.1 | 0.125 | 25.32 | |
| 343.15 | 3.00 | 68.5 | 0.121 | 25.32 | ||
| 373.15 | 3.00 | 67.2 | 0.120 | 25.32 |
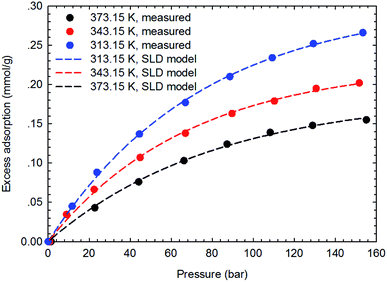 | ||
| Fig. 9 Curve fitting results with the measured excess adsorption of CH4 on the shale sample #1 using SLD-PR EOS model. | ||
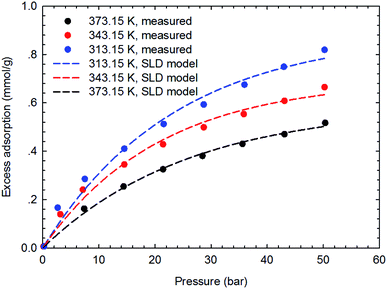 | ||
| Fig. 10 Curve fitting results with the measured excess adsorption of C2H6 on the shale sample #1 using SLD-PR EOS model. | ||
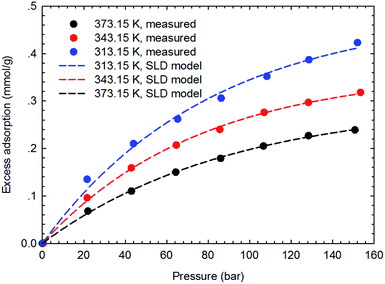 | ||
| Fig. 11 Curve fitting results with the measured excess adsorption of CH4 on the shale sample #2 using SLD-PR EOS model. | ||
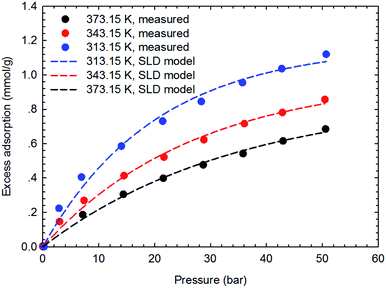 | ||
| Fig. 12 Curve fitting results with the measured excess adsorption of C2H6 on the shale sample #2 using SLD-PR EOS model. | ||
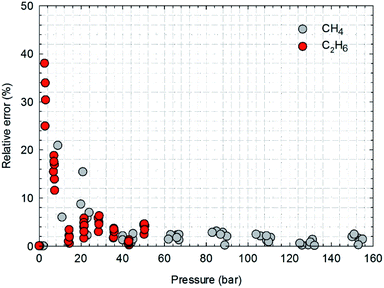
Based on the comparison results, the absolute relative error of the calculated adsorption of CH4 and C2H6 are calculated from the measured excess adsorption. The absolute relative error is calculated as,
 | (20) |
Fig. 13 presents the calculated absolute relative error for CH4 and C2H6 at various pressure conditions. We observe a higher absolute relative error at lower pressures for both CH4 and C2H6, which, specially, can be as high as 40% for C2H6, while the absolute relative error decreases as pressure increases. It suggests the SLD-PR EOS model is not accurate in predicting adsorption of CH4 and C2H6 on shale samples at low pressure conditions. In addition, compared with CH4, a much higher absolute relative error is observed for C2H6, indicating that the SLD-PR EOS model may not be suitable for the prediction of the adsorption of heavier hydrocarbon species.
5. Conclusions
In this work, the excess adsorption isotherms of CH4, C2H6 and their binary gas mixtures are measured on two typical shale core samples using thermogravimetric method. The adsorption of gas mixtures is compared with that of pure gases to reveal the behavior of competitive adsorption under the shale reservoir conditions. The SLD-PR EOS model is then applied for predicting the adsorption of CH4 and C2H6 on both shale samples to evaluate its efficiency in predicting the adsorption of shale hydrocarbons. The detailed conclusions can be drawn as below:(•) C2H6 has higher adsorption capacity than CH4 on the two shale samples under the same conditions; it suggests the more affinity of C2H6 on the organic shale;
(•) As observed from the measured adsorption isotherms of CH4–C2H6 mixtures, as the molar fraction of C2H6 in CH4–C2H6 mixtures increases, adsorption of the gas mixture increases, indicating the preferential adsorption of C2H6 on shale.
(•) Based on the predicted results from the SLD-PR EOS model, a reasonable agreement has been achieved with the measured adsorption isotherms, indicating the accuracy of the SLD-PR EOS model in predicting the gas adsorption on shale samples. In addition, compared with C2H4, the SLD-PR EOS model is more accurate in predicting adsorption of CH4 on shale.
This study proposes the SLD-PR EOS model for the prediction of gas adsorption on shale samples; in addition, it may provide a basic understanding of the competitive adsorption of hydrocarbons in shale reservoirs. To our knowledge, the adsorption measurements of gas mixtures on typical shale samples are presented for the first time. However, future works should be supplemented to our study. Besides CH4 and C2H6, some other heavier hydrocarbons, such as nC3H8, nC4H10, may also be an important component in shale gas. Thereby, future works are suggested to measure the adsorption/desorption isotherms of the heavier hydrocarbons on shale. In addition, in our work, we measure the adsorption of C2H6 at pressures as high as 60 bar based on the saturated vapor pressure of C2H6 at given temperature. New experimental setups should be designed to achieve the adsorption measurement at pressures as close as the shale reservoir conditions.
Conflicts of interest
There are no conflicts to declare.Acknowledgements
The authors acknowledge the financial support from the National Science Foundation of China [Grant No. U1810102] to T. Kang.References
- Y. Liu, Z. Jin and H. A. Li, Comparison of Peng-Robinson equation of state with capillary pressure model with engineering density-functional theory in describing the phase behavior of confined hydrocarbons, SPE J., 2018, 23(05), 1784–1797 CrossRef CAS.
- C. R. Clarkson and R. M. Bustin, Geological controls on coalbed methane reservoir capacity and gas content, Int. J. Coal Geol., 1998, 38(1–2), 3–26 Search PubMed.
- X. Cui and R. M. Bustin, Volumetric strain associated with methane desorption and its impact on coalbed gas production from deep coal seams, AAPG Bull., 2005, 89(9), 1181–1202 CrossRef CAS.
- P. J. Crosdale, B. B. Beamish and M. Valix, Coalbed methane sorption related to coal composition, Int. J. Coal Geol., 1998, 35(1–4), 147–158 CrossRef CAS.
- A. Busch, Y. Gensterblum and B. M. Krooss, Methane and CO2 sorption and desorption measurements on dry Argonne premium coals: pure components and mixtures, Int. J. Coal Geol., 2003, 55(2–4), 205–224 CrossRef CAS.
- A. Busch, Y. Gensterblum, B. M. Krooss and N. Siemons, Investigation of high-pressure selective adsorption/desorption behaviour of CO2 and CH4 on coals: An experimental study, Int. J. Coal Geol., 2006, 66(1–2), 53–68 CrossRef CAS.
- J. Q. Shi and S. Durucan, A bidisperse pore diffusion model for methane displacement desorption in coal by CO2 injection, Fuel, 2003, 82(10), 1219–1229 CrossRef CAS.
- Y. Liu, H. Li, Y. Tian and Z. Jin, Determination of absolute adsorption/desorption isotherms of CH4 and n-C4H10 on shale from a nanopore-scale Perspective, Fuel, 2018, 218, 67–77 CrossRef CAS.
- S. Cavenati, C. A. Grande and A. E. Rodrigues, Adsorption equilibrium of methane, carbon dioxide, and nitrogen on zeolite 13X at high pressures, J. Chem. Eng. Data, 2004, 49(4), 1095–1101 CrossRef CAS.
- J. H. Levy, S. J. Day and J. S. Killingley, Methane capacities of Bowen Basin coals related to coal properties, Fuel, 1997, 75(9), 813–819 CrossRef.
- B. M. Krooss, F. Van Bergen, Y. Gensterblum, N. Siemos, H. J. M. Pagnier and P. David, High-pressure methane and carbon dioxide adsorption on dry and moisture-equilibrated Pennsylvanian coals, Int. J. Coal Geol., 2002, 51(2), 69–92 CrossRef CAS.
- J. S. Bae and S. K. Bhatia, High-pressure adsorption of methane and carbon dioxide on coal, Energy Fuels, 2006, 20(6), 2599–2607 CrossRef CAS.
- T. C. Ruppel, C. T. Grein and D. Bienstock, Adsorption of methane on dry coal at elevated pressure, Fuel, 1974, 53(3), 152–162 CrossRef CAS.
- S. Ottiger, R. Pini, G. Storti and M. Mazzotti, Adsorption of pure carbon dioxide and methane on dry coal from the Sulcis Coal Province (SW Sardinia, Italy), Environ. Prog., 2006, 25(4), 355–364 CrossRef CAS.
- Y. Wang, T. T. Tsotsis and K. Jessen, Competitive sorption of methane/ethane mixtures on shale: measurements and modeling, Ind. Eng. Chem. Res., 2015, 54, 12178–12195 Search PubMed.
- S. Brunauer, P. H. Emmett and E. Teller, Adsorption of gases in multimolecular layers, J. Am. Chem. Soc., 1938, 60, 309–319 CrossRef CAS.
- P. M. Mathias, R. Kumar, J. D. Moyer, J. M. Schork, S. R. Srinivasan, S. R. Auvil and O. Talu, Correlation of Multicomponent Gas Adsorption by the Dual-Site Langmuir Model. Application to Nitrogen/Oxygen Adsorption on 5A-Zeolite, Ind. Eng. Chem. Res., 1996, 35(7), 2477–2483 CrossRef CAS.
- A. O. Dada, A. P. Olalekan, A. M. Olatunya and O. Dada, Langmuir, Freundlich, Temkin and Dubinin-Radushkevich Isotherms Studies of Equilibrium Sorption of Zn2+ Unto Phosphoric Acid Modified Rice Husk, IOSR J. Appl. Chem., 2012, 3(1), 38–45 CrossRef.
- S. Ozawa, S. Kusumi and Y. Ogino, Physical adsorption of gases at high pressure. IV. An improvement of the Dubinin-Astakhov adsorption equation, J. Colloid Interface Sci., 1976, 56(1), 83–91 CrossRef CAS.
- Y. Liu, J. Hou and C. Wang, Absolute adsorption of CH4 on shale with the simplified local density theory, SPE J., 2019 Search PubMed , preprint..
- B. Rangarajan, C. T. Lira and R. Subramanian, Simplified local density model for adsorption over large pressure ranges, AIChE J., 1995, 41(4), 838–845 CrossRef CAS.
- S. A. Mohammad, J. S. Chen, R. L. Robinson Jr and K. A. M. Gasem, Generalized simplified local-density/Peng-Robinson model for adsorption of pure and mixed gases on coals, Energy Fuels, 2009, 23, 6259–6271 CrossRef CAS.
- X. Huang, T. Li, H. Gao, J. Zhao and C. Wang, Comparison of SO2 with CO2 for recovering shale resources using low-field nuclear magnetic resonance, Fuel, 2019, 245, 563–569 CrossRef CAS.
- S. A. Mohammad, A. Arumugam, R. L. Robinson Jr and K. A. M. Gasem, High-pressure adsorption of pure gases on coals and activated carbon: measurements and modeling, Energy Fuels, 2011, 26(1), 536–548 CrossRef.
- K. A. M. Gasem, W. Gao, Z. Pan and R. L. Robinson, A modified temperature for the Peng-Robinson equation of state, Fluid Phase Equilib., 2001, 181(1), 113–125 CrossRef CAS.
- J. H. Chen, D. S. H. Wong, C. S. Tan, R. Subramanian, C. T. Lira and M. Orth, Adsorption and desorption of carbon dioxide onto and from activated carbon at high pressures, Ind. Eng. Chem. Res., 1997, 36(7), 2808–2815 CrossRef CAS.
- J. E. Fitzgerald, Adsorption of pure and multi-component gases of importance to enhanced coalbed methane recovery: measurements and simplified local-density modeling, PhD dissertation, Klahoma State University, Stillwater, OK, 2005 Search PubMed.
| This journal is © The Royal Society of Chemistry 2019 |

