 Open Access Article
Investigating the reliability and interpretability of machine learning frameworks for chemical retrosynthesis†
Friedrich
Hastedt
 *a,
Rowan M.
Bailey
 b,
Klaus
Hellgardt
 a,
Sophia N.
Yaliraki
 b,
Ehecatl Antonio
del Rio Chanona
 *a and
Dongda
Zhang
 *c
*c
aDepartment of Chemical Engineering, Imperial College London, London, SW7 2AZ, UK. E-mail: friedrich.hastedt18@ic.ac.uk; k.hellgardt@imperial.ac.uk; a.del-rio-chanona@imperial.ac.uk
bDepartment of Chemistry, Imperial College London, London, W12 7TA, UK. E-mail: r.bailey22@imperial.ac.uk; s.yaliraki@imperial.ac.uk
cDepartment of Chemical Engineering, University of Manchester, Manchester, M13 9PL, UK. E-mail: dongda.zhang@manchester.ac.uk
First published on 23rd May 2024
Abstract
Machine learning models for chemical retrosynthesis have attracted substantial interest in recent years. Unaddressed challenges, particularly the absence of robust evaluation metrics for performance comparison, and the lack of black-box interpretability, obscure model limitations and impede progress in the field. We present an automated benchmarking pipeline designed for effective model performance comparisons. With an emphasis on user-friendly design, we aim to streamline accessibility and facilitate utilisation within the research community. Additionally, we suggest and perform a new interpretability study to uncover the degree of chemical understanding acquired by retrosynthesis models. Our results reveal that frameworks based on chemical reaction rules yield the most diverse, chemically valid, and feasible reactions, whereas purely data-driven frameworks suffer from unfeasible and invalid predictions. The interpretability study emphasises that incorporating reaction rules not only enhances model performance but also improves interpretability. For simple molecules, we show that Graph Neural Networks identify relevant functional groups in the product molecule, offering model interpretability. Sequence-to-sequence Transformers are not found to provide such an explanation. As the molecule and reaction mechanism grow more complex, both data-driven models propose unfeasible disconnections without offering a chemical rationale. We stress the importance of incorporating chemically meaningful descriptors within deep-learning models. Our study provides valuable guidance for the future development of retrosynthesis frameworks.
1 Introduction
The discovery of novel organic molecules to fight and treat diseases is a major challenge in the pharmaceutical domain. As the number of potential drugs is increasing exponentially, computational techniques such as predictive modelling1,2 and reaction optimisation3 are in high demand. Nevertheless, the journey from discovering a drug to its production at a large scale is long and costly. Traditionally, synthesis pathways are discovered by identifying single reaction steps – in a backwards fashion – until suitable precursors are found. This approach is formally known as retrosynthesis.4 The curation of synthesis routes through retrosynthesis generally depends on the experience and preference of the chemist. Due to the vast size of the chemical space, manual synthesis planning is time-intensive, challenging, and mostly suboptimal.5 Therefore, researchers have focused on developing computational tools that can aid the selection process.6In fact, it was Corey et al.7 in 1972 that formulated the idea of encoding reaction- and selectivity rules and heuristics into a machine-readable format to perform retrosynthesis in an automated fashion. His pioneering work on computer-aided synthesis planning (CASP) gave rise to the development of well-known retrosynthesis systems such as Merck's SYNTHIA (formerly Chematica)8 or SYNLMA.9 These algorithms are known as rule-based expert systems, since they rely on prior knowledge provided by a human. Unfortunately, expert systems exhibit limitations in terms of their confined scope and scalability concerning novel molecules and reaction types.10 To overcome the limitations associated with rule-based systems, Segler and Waller11 proposed to learn directly from the reaction data by leveraging machine learning (ML). Without relying on pre-defined selectivity rules and heuristics, their model identified the “best” reaction rule (template) by learning directly from the data. Their approach demonstrated a significant improvement over existing rule-based systems on a small case study of 103 rules.11 Since their publication in 2017, more than 30 ML-based (single-step‡) retrosynthesis frameworks have been developed. In spite of these numbers, there are still various aspects that require attention before the frameworks can be considered fully functional. In their review, Coley et al.12 described the four fundamental building blocks of retrosynthesis, which collectively form a comprehensive framework: (i) an algorithm that decomposes a molecular target into reactants, known as single-step retrosynthesis. (ii) A database encompassing building blocks that act as starting materials of the synthesis route. (iii) A multi-step algorithm,13 that makes multiple calls to a single-step model to construct several synthesis routes in a tree fashion. (iv) A scoring metric (e.g. molecular accessibility14,15), which guides the multi-step synthesis planning.16 Whilst building blocks (ii–iv) ensure the construction of synthesis routes, it is the single-step model (i) that defines the critical reaction chemistry.
One of the central concerns emphasised in the literature for single-step models5,17 pertains to the absence of standardised evaluation metrics essential for enabling meaningful comparisons across various architectures. The most popular evaluation metric, known as the top-k accuracy, is perceived as misleading.17,18 This is because the metric does not test for the ability to propose novel and/or feasible reactions. Instead, it biasedly rewards the effective recall of reactions contained within the database. Additionally, Coley et al.12 highlights the lack of interpretability within retrosynthesis frameworks. These black-box models generate predictions without offering any underlying reasoning or explanations.5 This brings forth a critical question: how can chemists place their trust in or even learn from such models19 when they are not provided with evidence of their reliability and a measure of their interpretability?
This paper attempts to address existing challenges for single-step frameworks. The contribution can be summarised as follows:
(1) An automated benchmarking pipeline for consistent evaluation: We develop a benchmarking procedure that allows for a confident comparison between the performance of different retrosynthesis architectures. We envision the pipeline to replace the top-k accuracy as an evaluation metric. The code is provided in open-source and user-friendly design, encouraging researchers to test their algorithms.
(2) Evaluation and comparison of state-of-the-art (SOTA) frameworks: We show that frameworks based on reaction knowledge extracted from the literature provide the most diverse and feasible reaction chemistry. On the other hand, prominent deep-learning architectures such as the Transformer and Graph Neural Networks (GNNs) struggle with invalid and unfeasible predictions.
(3) Uncovering the black-box for retrosynthesis: Through the case study, we identify the need for better featurisation for both the Transformer and GNN models. In particular, the GNN model would benefit from chemically meaningful features instilling first-principle knowledge.
(4) Guidance for future research direction: Our findings are tailored to enable scientists, who may or may not be acquainted with this research area to discern the strengths and limitations of existing ML-driven frameworks. By doing so, we aim to facilitate the adoption of these algorithms within their respective domains and encourage the development of new methods by the scientific community.
The remainder of this paper is structured as follows: first, in Section 2.1, the reader is provided with the relevant background for single-step retrosynthesis frameworks. The methodologies for the benchmarking pipeline and interpretability study are outlined in Sections 2.2 & 2.3, respectively. Thereafter, the results of the benchmarking and interpretability studies are presented in Sections 3.1 & 3.3, respectively. The paper concludes with an outlook of what future research could entail (Section 4).
2 Overview and methodology
2.1 Background
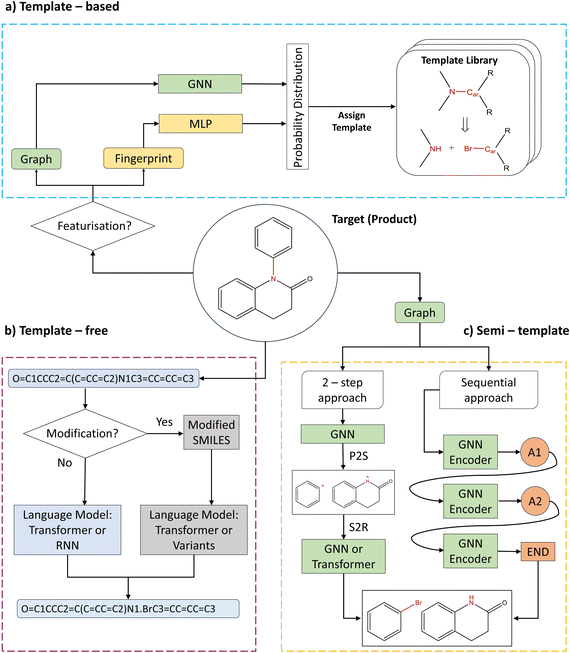
Single-step retrosynthesis frameworks can be classified into three major categories: (i) template-based, (ii) template-free, and (iii) semi-template frameworks. Fig. 1 provides a visual abstraction of each category. Generally, the differences between categories boil down to the inclusion or exclusion of reaction templates. Fig. 1a shows an example of a reaction template. One can compare a reaction template to a rule, which provides information about bond formation and breakage in the reaction centre. Formally, a reaction centre is defined as the atoms and bonds that participate in electron rearrangement during the reaction.10 Frameworks that employ templates to perform chemical retrosynthesis belong to the template-based category. Since templates are either manually curated or automatically extracted from existing literature,20 they inherently distil chemical (expert) knowledge within the model. On the other hand, models can learn from reaction data directly without the use of pre-defined rules in the form of templates. These models belong to the template-free category as shown in Fig. 1b. Finally, semi-template models are data-driven models that necessitate information from reaction templates to train the model (but not during inference). This information is provided in the form of atom mapping. Atom mapping can be seen as a dictionary, that for each atom in the reactants, defines the matching atom in the product (target) molecules. Utilising atom mapping, one can extract the sequence of atom and bond transformations during a reaction computationally. Thus, semi-template models address the prediction of the transformation sequence.5 Since reaction templates are curated from atom mapping, semi-template and template-based models share a certain degree of knowledge, thus giving rise to the naming convention. Within this paper, an algorithm utilising exact atom mapping is categorised as semi-template.In this section, we do not aim to provide a complete review of existing literature on retrosynthesis and/or molecular featurisation. The reader is referred to Zhong et al.5 for a comprehensive analysis of the current state of literature or to the ESI (Table S1†) for a short summary. Moreover, the reader is referred to Wigh et al.21 for an excellent introduction to (machine-readable) molecular representation. Instead, we focus on key developments and discuss the benchmarked algorithms in greater detail.
 out of an existing pool, known as the template library.20 Any given template
  in the library is defined by molecular subgraphs
  and
and  (where i ∈ {1, 2, 3, …, N}, N = #reactants) within the product and reactant molecules, respectively:
 | (1) |
The subgraph patterns  and
and  can include a varying number of atoms within the molecule. The main task of any template-based model is to rank all templates within the library to match the most relevant template to a given product (the target molecule).
In 2017, Segler and Waller11 devised the first deep-learning model to rank templates by probability given a product and thereby perform retrosynthesis. Effectively, their model (Neuralysm) is performing a multiclass classification over the entire template library. Neuralysm acted as a proof-of-concept approach to the community outperforming the previously state-of-the-art expert-based systems by a great margin. However, the approach of ranking templates through a softmax classifier (and similar models, see ESI Table S1 – Direct Template Selection†) comes with a significant shortcoming: For template libraries of large size, the model has to distribute likelihoods between all templates in the compiled library, rendering the task very challenging. To overcome this issue, two different approaches have been proposed. First, Dai et al.22 realised that the template relevance classification task can be reformulated into a joint conditional probability prediction. Utilising this reformulation and a prior template applicability check, their model (Graph Logic Network – GLN) only assigns a selected number of templates a probability > 0. Second, Seidl et al.23 departed from the template classification problem and instead utilised a modern Hopfield Network in their model (MHNReact) to match/retrieve structurally similar templates to the product molecule. Opposed to the aforementioned models, Chen and Jung24 argued that chemical reactions take place due to the presence of local functional groups and moieties. Rather than classifying templates based on the entire molecule, the model (LocalRetro) assigns local templates to an atom/bond in the molecule.
All template-based frameworks share the same advantage, that is their inherent interpretability. While the deep-learning architectures employed by the framework are not easily interpretable, the predicted output is, i.e., the template itself. In other words, once a template is chosen by the framework, the end-user can check for its precedent in the literature along with the proposed reaction mechanisms and conditions.
Schwaller et al.27 and Karpov et al.28 introduced the popular Transformer29 for forward/retrosynthesis which was seen to improve drastically over the LSTM for the top-k accuracy evaluation metric. Irwin et al.30 investigated the combined effects of pre-training and augmentation31 for retrosynthesis in their Chemformer framework. On the other hand, Kim et al.32 introduced a second Transformer for forward synthesis prediction to check that the retrosynthesis prediction is “cycle-consistent”, i.e., if the predicted product by the forward model matches the initial target molecule. Introducing an additional latent variable z ∈ ![[Doublestruck R]](https://www.rsc.org/images/entities/char_e175.gif) K,33 their model (TiedTransformer) reduces both the rate of invalid SMILES generation with a larger degree of diverse predictions.
K,33 their model (TiedTransformer) reduces both the rate of invalid SMILES generation with a larger degree of diverse predictions.
Departing from SMILES, researchers proposed to leverage information about the graph structure of the molecule. Generally, a molecular graph G is defined by its collection of nodes N (atoms) with features X, edges E (bonds) with features E and connectivity A, which is known as the adjacency matrix. Seo et al.34 augmented the attention mechanism within the Transformer by constructing attention masks through the inclusion of connectivity matrix A. The masks greatly reduce the attention space (parameter space to optimise) of the model, Graph Truncated Attention – GTA, facilitating efficient training. Concurrently, Tu and Coley35 came up with a novel idea to combine the power of graphs with the Transformer (graph Transformers).36 In their model, Graph2Smiles, the graph object G is fed to a graph encoder that generates a feature vector for each atom. Another example of such graph Transformer was developed by Wan et al.37 Their model, Retroformer, generally follows the two-step approach for semi-template models (Fig. 2). In the first step, the model detects the reaction centre to generate synthons. Synthons are hypothetical molecular units that can be perceived as potential starting reagents. The second step requires the attachment of atoms or leaving groups to the synthons, generating feasible starting materials. Whilst the frameworks mentioned above differ in the encoding strategy (i.e. SMILES or molecular graphs), they all generate a SMILES sequence as their output. Presently, researchers have attempted to find alternatives to SMILES.38–40 This interesting area of research is however beyond the scope of this investigation. Another alternative to SMILES generation was previously explored in Ucak et al.41 and Coley et al.42 By comparing the molecular similarity of possible precursors to entries in the reaction database, one ensures the generation of valid reactants (although the reaction is not necessarily feasible).
2.2 Benchmarking and evaluation
In recent works, Torren-Peraire et al.50 benchmarked single-step retrosynthesis models in a multi-step fashion. Instead of evaluating the model on single reactions via the traditional top-k accuracy, their benchmark considers the full synthesis route from building blocks to the target molecule. While this is a promising idea, the authors utilised the top-k route accuracy and number of solved routes as evaluation metrics. Similar to the top-k accuracy, the route accuracy biasedly rewards models that recall existing routes from the test database. Additionally, a permissive model may propose a larger number of solved routes due to chemically unrealistic and unfeasible reaction steps.18 Maziarz et al.18 improved upon previous shortcomings by counting the number of diverse routes predicted by a model within a time window. Nonetheless, the authors acknowledged the difficulty of validating synthesis route feasibility, i.e., if the route would likely be experimentally successful. Moreover, benchmarking algorithms in a multi-step fashion is computationally- and time-intensive.50We argue that models should most importantly predict (experimentally) feasible reactions. Consequently, our pipeline (Section 2.2.2) evaluates models based on their ability to propose feasible, diverse and unique reactions.
As a final note: our pipeline does not guarantee that a single-step model can find synthesis routes towards purchasable building blocks. We suggest that once a promising model is identified through our pipeline, it could be further validated for synthesis planning on the benchmark proposed by Maziarz et al.18
![[thin space (1/6-em)]](https://www.rsc.org/images/entities/char_2009.gif) 000 reactions, it is considerably smaller compared to the entire USPTO. Nevertheless, atom-mapping is provided within the dataset alongside reaction class information for each reaction, i.e., each reaction belongs to one of ten superclasses (e.g. protection, oxidation). The USPTO-50k is the most utilised dataset for retrosynthesis thanks to its detailed information. Particularly, the reaction superclass information has been shown to increase the performance of retrosynthesis prediction.25 Nonetheless, the reaction type is generally unknown prior to synthesis planning. Hence, for training retrosynthesis frameworks, the reaction type is disregarded. Since no information is provided about reaction conditions, the frameworks are trained on the single product USPTO-50k dataset. Furthermore, most retrosynthesis frameworks are not capable of predicting reagents (catalysts/solvent) alongside the reactants. In this paper, precursor and reactant are thus used interchangeably. The dataset follows an 80/10/10 split, leaving 5007 reactions for the benchmarking case study.
000 reactions, it is considerably smaller compared to the entire USPTO. Nevertheless, atom-mapping is provided within the dataset alongside reaction class information for each reaction, i.e., each reaction belongs to one of ten superclasses (e.g. protection, oxidation). The USPTO-50k is the most utilised dataset for retrosynthesis thanks to its detailed information. Particularly, the reaction superclass information has been shown to increase the performance of retrosynthesis prediction.25 Nonetheless, the reaction type is generally unknown prior to synthesis planning. Hence, for training retrosynthesis frameworks, the reaction type is disregarded. Since no information is provided about reaction conditions, the frameworks are trained on the single product USPTO-50k dataset. Furthermore, most retrosynthesis frameworks are not capable of predicting reagents (catalysts/solvent) alongside the reactants. In this paper, precursor and reactant are thus used interchangeably. The dataset follows an 80/10/10 split, leaving 5007 reactions for the benchmarking case study.
To extract the predictions for all 5007 products from the retrosynthesis framework, the following steps are followed:
(1) Train the selected framework via instructions on GitHub.
(2) For test molecules, record the top-k reactions (SMILES).
(3) Clean the prediction through SMILES canonicalisation and removal of reactant sets with invalid molecules (via RDKit53).
This workflow is repeated for all frameworks included in this case study. Step 3 includes the removal of invalid molecules, which is needed to circumvent computational errors. Nevertheless, the proportion of invalid molecules is captured by a metric introduced in Section 2.2.2. Whilst the main benchmarking is performed on the USPTO-50k, we extend the methodology for top-performing models from each category to the USPTO-Pararoutes54 (∼1 M reactions). By doing so, we aim to reason about the transferability of our findings to larger databases. We provide the datasets and predictions extracted in step 2 via FigShare.
We propose to depart from the top-k accuracy entirely as the evaluation metric. Instead, we propose the following metrics to be used jointly for single-step evaluation: Round-trip, Class diversity, Duplicity, Validity and SCScore.14 Some of these metrics have been introduced by Schwaller et al.16 for the purpose of guiding the (single-step) retrosynthesis model for synthesis route planning (multi-step retrosynthesis). The details and purpose of each metric along with its quantitative calculation are outlined below.
As a note to the reader, single-step frameworks return up to k predictions for a single target. In other words, for each target, the framework provides up to k reactions. Within each framework, there is an internal ranking mechanism that indicates a preference for a given reaction over another. Thus, the first prediction given by the model is considered the “best” prediction. For the case study, k is taken to be 10, such as the top-10 predictions are utilised for the evaluation metric per target in the test database, unless specified otherwise.
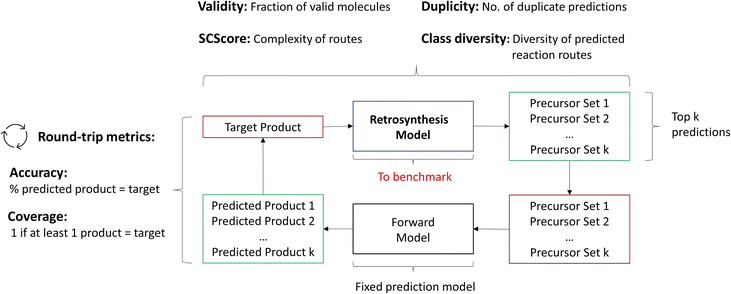
2.2.2.1 Round-trip. The ideal evaluation of predicted reactions would be through experimental validation.16 Given that each model in our case study predicts 10 reactions for 5007 targets, this validation is unfeasible. To provide an ad hoc replacement for physical validation, Schwaller et al.16 employed a forward synthesis model to predict the reaction outcome for each reactant set i ∈ {1, …, k}, given a target molecule t (Fig. 3). For each precursor set i, n possible reaction outcomes p ∈ P, where P = {p1, …, pn}, are generated. If the target molecule t matches any reaction outcome p within the set, the precursor set is said to be “cycle-consistent”. For the purpose of this case study, n is taken to be 2. This number was chosen according to the forward synthesis model. In this case study, an unbiased model was selected known as WLDN5.56 Herein, unbiased refers to any model architecture that is different from the benchmarked retrosynthesis frameworks. In doing so, we suggest that the forward model should not implicitly favour any of the three retrosynthesis categories. WLDN5 is seen to have a competitive accuracy with a top-1 and top-2 accuracy of 85.6% and 90.5% (on the USPTO-MIT56§), respectively. Since there is a significant improvement in model accuracy between the top-1/2 accuracy, n was selected accordingly (n = 2). Theoretically, n can assume any number larger than 1. However, this comes with increasing computational demand with decreasing marginal utility. The round-trip was scored through the round-trip accuracy as shown in eqn (2). The accuracy measures the percentage of predictions, for which the precursor set i is found to be “cycle-consistent”. A double-sum is employed to average over all T targets in the dataset of k reactant sets:
 | (2) |
Additionally to the round-trip accuracy, which rewards models that propose a large variety of reactions given the target product, one can calculate the round-trip coverage.16 In short, the round-trip coverage holds a weaker condition than the round-trip accuracy: only 1 precursor set out of k needs to be “cycle-consistent”. This is to ensure that models can generalise on a variety of different molecules. In the investigation, it was scrutinised that most frameworks perform equally well on this metric. Thus, the analysis of the round-trip coverage can be found within the ESI.†
As a final note, the round-trip accuracy does not replace experimental validation and should only be conceived as a proxy. This is because no yield or selectivity information is provided by the forward synthesis model. However, the round-trip metrics can be calculated within a short time frame, making it highly accessible.
2.2.2.2 Diversity. For retrosynthesis frameworks primarily targeting synthetic chemists, it is essential that the framework can provide a diverse selection of reactions that encompass a variety of underlying chemical transformations. Assessing this diversity necessitates the categorisation of each predicted reaction into distinct classes. These categories are drawn from the RXNO (Reaction Ontology),57 which comprises ten distinct categories, including carbon–carbon bond formation, heteroatom alkylation and arylation, and protections. To perform this categorisation, a logistic regression classifier is employed. The classifier takes as input a latent reaction fingerprint, which is derived from the fine-tuning of the BERT model introduced by Schwaller et al.58 on the USPTO-50k dataset, as depicted in Fig. 4. The classifier exhibits a remarkable level of confidence, achieving an accuracy of 99.5% on a separate test set from the USPTO-50k dataset. This high level of accuracy underscores its efficiency as a valuable tool for reaction classification. To quantitatively measure the diversity of reaction, a simple count is performed per molecular target (i.e. for all k reactions). Mathematically, the diversity is calculated as follows:
 | (3) |
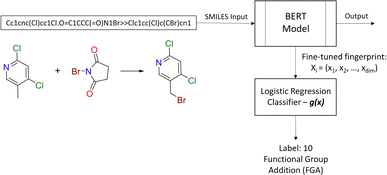 | ||
| Fig. 4 Reaction class classification workflow. The BERT model generates the fingerprint for the logistic regression classifier. | ||
Finally, note that while a diverse set of predictions is desired, it might not always be possible, e.g., for molecules that only have one feasible disconnection site.
2.2.2.3 Duplicity. Retrosynthesis algorithms should place a significant emphasis on preventing the generation of duplicate reaction predictions. Much like the case with invalid SMILES, having duplicate reactions reduces the effective number of predictions generated by the framework. Eqn (4) introduces a novel diversity metric, which is scaled between 0 and 1. A score of 0 signifies that all the predictions are essentially identical duplicates of each other. The variable zidv signifies the count of distinct predictions for a given target, while k represents the total number of predictions. The duplicate metric is calculated as follows:
 | (4) |
2.2.2.4 Validity. A significant challenge associated with template-free models lies in their capacity to generate SMILES that are both grammatically and semantically correct. Invalid SMILES are structurally flawed and cannot be translated back into meaningful molecules. When a model produces a substantial number of invalid SMILES, it considerably reduces the pool of useful predictions available to the end-user. One potential solution is to implement a filtering mechanism to exclude these invalid predictions. This way, the model can provide an additional set of h SMILES, where h represents the count of invalid predictions among the initial k predictions. Nevertheless, an abundance of invalid SMILES reflects the model's inability to grasp the chemical language, which is the fundamental objective of template-free models. Eqn (5) introduces the concept of the top-k validity, calculated in a manner akin to round-trip accuracy.
 | (5) |
2.2.2.5 Synthetic accessibility – SCScore. To represent the overall notion that reactions produce more valuable molecules, a synthetic accessibility metric is utilised. These metrics score molecules based on their accessibility in reality, thereby quantifying their economic value. A variety of metrics exists, each with its own limitation and variability in predictive performance.60 The SCScore is utilised14 in this study, although a more rigorous approach would entail using an ensemble of different score, which is to be explored in future work. The SCScore evaluates molecules based on their synthetic complexity, which is defined as the number of reactions needed to synthesise a given molecule. The scoring is achieved through an ML model that learns to distinguish if a molecule is likely to appear as a reactant, intermediate or product in a synthesis route. The SCScore thus evaluates the algorithm's ability to break down target products into molecular “building blocks” in a cost-saving fashion. The SCScore for a reaction corresponding to a target t is computed using eqn (6). This score
 is defined as the difference between the score for the target molecule and the highest score among any of the reactants in the reactant set. Consequently, a higher
  signifies the algorithm's success in simplifying the synthetic complexity of the target. Conversely, a negative score indicates that, on average, the reactants are synthetically more complex than the target.
 | (6) |
 is not desired for all reaction classes such as protection reaction. As these only make up 1.2% of the dataset, the overall aim remains to maximise
  .
.
2.3 Black-box interpretability
To understand the decision-making process of retrosynthesis frameworks, a novel interpretability study is carried out. In particular, the interpretability of semi-template and template-free architectures is investigated. Template-based frameworks are considered inherently interpretable since one can link their prediction directly to literature precedent. Furthermore, model interpretability has been investigated for the template-based category.22,61 The aim of this study is to uncover whether the other two framework categories capture chemically important functional groups, sterics and charge transfers in the reaction. Note that these important thermodynamic features often appear in and around the reaction centre, potentially favouring the interpretability of “reaction-centre aware” models.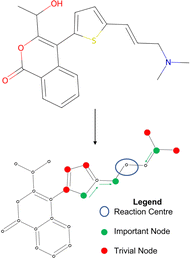 | ||
| Fig. 5 Toy example for determining node importance. The green nodes are most important to the reaction centre, red nodes are trivial. | ||
A prerequisite to node identification is the necessity of a trained GNN. For this purpose, we train two types of GNNs: (i) Edge-aware Graph Attention Network (EGAT)45 and (ii) Direct Message Passing Neural Network (DMPNN).46 These two architectures were chosen as they are employed by a large selection of semi-template frameworks such as GraphRetro, G2Retro, Graph2Edits, RetroXpert and MEGAN. Implementation details for the two GNNs can be found within the ESI.† Both GNNs were trained on the cross-entropy loss function as shown in eqn (7).46 The loss function constitutes two different parts, both of which define a different type of reaction centre. First, a reaction centre exists between a pair of atoms (ai, aj) if there is a bond type change during the reaction. This is usually encountered for bimolecular reactions. Mathematically, this is indicated by a binary variable yi,j, which assumes a value of 1 if the bond i, j ∈ E is changed. Second, a reaction centre is defined as any atom ai that experiences a change in the number of implicit hydrogen (unimolecular reaction). Equivalently, this is captured by binary variable yi for atom i ∈ N. Note that this definition only allows for the existence of one bond change, rather than multiple bond changes. This is however not a concern as all interpretability studies follow bimolecular reactions. Finally, a constraint is imposed on both binary variables as follows:
 | (7) |
 | (8) |
In eqn (7), zi,j ∈ [0, 1] and zi ∈ [0, 1] refer to likelihood logits calculated by the GNN model for the bimolecular and unimolecular reaction centres, respectively. The collection of these logits is defined as z where z ≡ [z1, z2, …, zn, z1,2, z2,1, …, zm,n]⊤. The logits are calculated as follows:
| xi,jT = (|xiT − xjT|‖xiT + xjT), | (9) |
| zi,j = softmax(MLP(xi,jT)), | (10) |
| zi = softmax(MLP(xiT)), | (11) |
 | (12) |
 | (13) |
In eqn (9), xiT and xjT refer to the updated node features after T layers of message passing. The edge features xi,jT are calculated from the concatenation of the absolute difference and sum of node features. Finally, both edge (zi,j) and node (zi) logits are calculated through a softmax layer after being transformed by a shallow MLP. The predicted reaction centre k* is then determined as the argument maximum of z ∈ ![[Doublestruck R]](https://www.rsc.org/images/entities/char_e175.gif) R.
R.
Once a precise model has been successfully trained, the subsequent challenge is to pinpoint the critical nodes within the graph. This task is accomplished using a graph masking technique called GNNExplainer.62 GNNExplainer is designed to discern the subgraph GS that has the most significant impact on predicting a specific node or edge, in this context, the reaction centre (as illustrated in Fig. 5). The GNNExplainer optimises the subgraph search by maximising the mutual information (MI) between the model's prediction based on GS and the prediction based on the entire graph G through:
 | (14) |
 | (15) |
 | (16) |
 | (17) |
 | (18) |
![[Doublestruck R]](https://www.rsc.org/images/entities/char_e175.gif) Tout×Tin contains the attention weights between all tokens of both sequences. The most relevant attention matrix A* is defined as a collection of attention vectors at = [a1, a2, …, am]⊤ for each output (reactant SMILES) token, i.e., A* = [a1, a2, …, an]. The attention vector at is extracted as the vector that contains the largest scalar (closest to 1), i.e., the strongest correlation between the output token to any of the input (product SMILES) tokens. Once matrix A* is obtained from the model, a column-wise summation is performed over the product SMILES token along with normalisation as:
Tout×Tin contains the attention weights between all tokens of both sequences. The most relevant attention matrix A* is defined as a collection of attention vectors at = [a1, a2, …, am]⊤ for each output (reactant SMILES) token, i.e., A* = [a1, a2, …, an]. The attention vector at is extracted as the vector that contains the largest scalar (closest to 1), i.e., the strongest correlation between the output token to any of the input (product SMILES) tokens. Once matrix A* is obtained from the model, a column-wise summation is performed over the product SMILES token along with normalisation as:| A* = (aij)1≤i≤Tout,1≤j≤Tin, | (19) |
 | (20) |
 | (21) |
 | (22) |
The methodology presented herein is reproducible from the EvalRetro Github. The RDKit53 package was utilised for molecule handling for SMILES and graph featurisation. The Graph Neural Networks are trained with Pytorch67 and Pytorch-geometric.68 Attention weights A* were extracted with the openNMT library69 for the GTA and TiedTransformer models. For the case study, two example reactions were taken from the USPTO-50k and three example reactions stem from literature/industrial examples.
3 Results & discussion
3.1 Evaluation of retrosynthesis frameworks
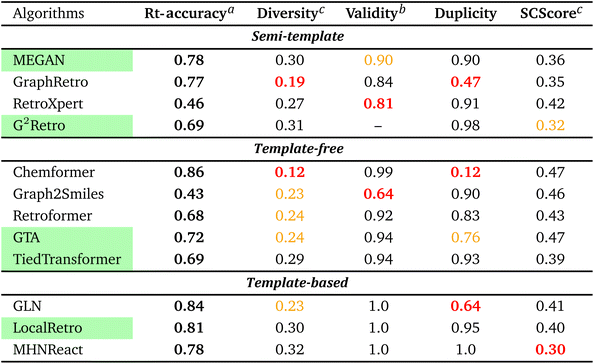
To streamline the benchmarking results, a summary of all evaluation metrics is provided within Table 1. Analysing and optimising each metric individually is unfeasible and direct comparison between frameworks becomes difficult. This is because no framework category performs best on all evaluation metrics. Instead, we propose that optimising the round-trip accuracy provides the best performance measure of a retrosynthesis framework. Nonetheless, the round-trip accuracy is flawed in certain ways. First, it does not take into account the diversity of the predictions, e.g., the simple nucleophilic substitution C2H5X + NH3 → C2H5NH2 + HX is chemically feasible for various nucleophiles (e.g. Br−, Cl−). Trivial changes in chemistry therefore boost the round-trip accuracy. Second, the round-trip accuracy provides no measure of the number of duplicate reactions. If a framework proposes a large number of duplicates of a feasible reaction, it will inherently boost the round-trip accuracy, too. Third, no measure on invalid molecules (SMILES) is provided. It is postulated that a retrosynthesis framework that has “learnt” chemistry, should not generate invalid molecules.Therefore, the benchmarking is formulated as optimising the round-trip accuracy while holding “soft” constraints on all other metrics introduced in Section 2.2.2. These constraints are user-selected in a reasonable fashion. As such, the set of constraint is given as  , Dup ≥ 0.8,
  , Val20 > 0.9. In other words, for a set of 10 reactions per given target, the frameworks should propose on average at least 2.5 reaction classes with no more than 2 duplicate reactions and 1 invalid reaction (SMILES). The constraint for the SCScore difference was chosen according to
  of the ground-truth test dataset, which is equal to ≈0.48. The reactions contained in the USPTO dataset were most likely patented due to an efficient synthesis route. Thus, it would be unreasonable to expect the frameworks to outperform the dataset. The constraint on
  is therefore chosen to be within 30% of
  .
.
From Table 1, it can be seen that template-based models perform overall the best for the round-trip accuracy with few duplicate and invalid predictions. In fact, LocalRetro is the only model that satisfies all soft constraints with a high rt-accuracy of 81%. Considering that templates contain data on chemically viable reactions from prior literature and experimental studies, this outcome may not be particularly unexpected. In contrast, the other two categories exhibit lower performance in suggesting feasible reactions, possibly because they lack chemically meaningful descriptors. For the template-free models, it can be observed that they generate less diverse reactions than the other two categories. An extreme example is Chemformer, which predicts numerous duplicates of the ground-truth reaction, thereby leading to a large inflation of the rt-accuracy. Nonetheless, efforts made by the community have led to a smaller degree of invalid SMILES (1–8% on average) compared to the 20% of Liu et al.25's initial work on sequence models. Furthermore, template-free models are observed to be best at the synthetic complexity (SCScore) metric. However, it is hypothesised that template-free models experience the common problem of length-based overfitting70 on the training dataset. This means that the models prefer to generate shorter SMILES sequences due to the appearance of short reactant SMILES in the training database. On the other hand, the semi-template category (with the exception of GraphRetro) is observed to produce a diverse set of reactants with few duplicate reactions. This is thanks to the nature of the two-step approach as seen in Fig. 2. During the reaction centre detection step, the algorithm can sample different reaction centres (pertaining to different reaction chemistry). This ensures a larger number of diverse and unique predictions as seen for G2Retro. Nevertheless, while diverse reactions with few duplicates are important, they slightly decrease the rt-accuracy (e.g. G2Retro). Interestingly, the semi-template models propose the largest degree of invalid molecules. The preceding literature has not highlighted this issue. Therefore, this challenge is yet to be tackled.
To conclude the overview, it is clear that template-based models exhibit the best performance on the USPTO-50k dataset. They have the highest round-trip metrics while proposing a diverse set of predictions with practically no invalid molecules and a low number of duplicates. For databases of small to medium size, this type of model is preferred. It is to be noted that the benchmarking does not provide a measure of reaction “novelty” for frameworks. Hence, it cannot be concluded that template-based models propose a higher degree of “unexplored” or “unreported” reactions. Furthermore, the benchmarking did not provide a conclusive explanation for the inferior performance of template-free and semi-template models. A possible reason could be the size of the USPTO-50k database, which could render optimisation of the large parameter space challenging. In other words, do the frameworks overfit the database? This question is addressed in Section 3.2.3. Another possibility could be that the deep learning techniques are simply unable to “learn” reaction chemistry – a problem which is solved through reaction templates. This question is explored in Section 3.3.
3.2 Detailed comparison of evaluation metrics
| Algorithms | Top-k (retrosynthesis) accuracy | Round-trip accuracy | ||||||
|---|---|---|---|---|---|---|---|---|
| Top-1 | Top-3 | Top-5 | Top-10 | Top-1 | Top-3 | Top-5 | Top-10 | |
| Semi-template | ||||||||
| MEGAN | 48.9 | 71.3 | 79.4 | 86.8 | 89.5 | 85.8 | 82.9 | 77.5 |
| GraphRetro | 53.7 | 67.7 | 71.5 | 74.4 | 91.2 | 86.2 | 82.9 | 76.5 |
| RetroXpert | 44.3 | 59.5 | 64.1 | 69.1 | 84.0 | 67.5 | 58.5 | 46.5 |
| G2Retro | 51.4 | 72.2 | 78.2 | 83.7 | 90.5 | 84.2 | 79.2 | 69.3 |
![[thin space (1/6-em)]](https://www.rsc.org/images/entities/char_2009.gif) |
||||||||
| Template-free | ||||||||
| Chemformer | 53.3 | 60.2 | 61.3 | 61.9 | 87.2 | 85.7 | 85.7 | 86.1 |
| Graph2Smiles | 52.7 | 65.8 | 69.1 | 72.0 | 87.7 | 67.5 | 56.8 | 43.7 |
| Retroformer | 53.0 | 70.5 | 75.9 | 81.6 | 89.1 | 81.6 | 76.3 | 68.0 |
| GTA | 51.1 | 67.2 | 74.2 | 81.1 | 88.4 | 85.1 | 80.9 | 72.3 |
| TiedTransformer | 46.6 | 67.2 | 73.7 | 79.3 | 90.6 | 86.0 | 82.1 | 69.1 |
![[thin space (1/6-em)]](https://www.rsc.org/images/entities/char_2009.gif) |
||||||||
| Template-based | ||||||||
| GLN | 52.5 | 69.0 | 75.6 | 83.7 | 90.8 | 89.6 | 87.9 | 84.5 |
| LocalRetro | 53.4 | 76.9 | 84.3 | 91.0 | 91.3 | 87.3 | 85.1 | 81.4 |
| MHNReact | 51.2 | 73.3 | 80.0 | 87.1 | 90.7 | 87.2 | 84.2 | 77.5 |
From Table 2 the following conclusions are drawn: First, when examining the top-1 accuracy, a metric often emphasised for state-of-the-art (SOTA) comparisons, it becomes evident that the leading frameworks within each category fall within a rather limited 0.4% range. It is clear that such a narrow range does not provide a definitive basis for determining the SOTA algorithm. Second, models that exhibit low top-1/3 retrosynthesis accuracy (e.g. TiedTransformer and MEGAN), demonstrate highly competitive round-trip accuracy within their category. Similarly, models that show a strong performance for retrosynthesis accuracy in their respective categories (e.g. Retroformer and G2Retro), do not necessarily exhibit a similar performance for rt-accuracy. From this, it is concluded that the top-k accuracy does not provide a measure similar to reaction feasibility such as the round-trip accuracy. On the other hand, concluding that the top-k accuracy is an ineffective measure for retrosynthesis is not possible. This is because as one considers the retrosynthesis accuracy at values of k ≥ 5, the template-based models (alongside MEGAN and G2Retro) are shown to be superior. Similarly, in Table 1, these frameworks are found to be the most promising. It is thus deduced that a high retrosynthesis accuracy at values of k ≥ 5 indicates the success of frameworks in finding a diverse set of reactants given a specific target. This is because a higher diversity results in a higher likelihood of finding the ground-truth reaction at higher k resulting in an increase in top-k accuracy. Nevertheless, as mentioned before, the top-k accuracy does not provide a direct measure of chemical feasibility as achieved through rt-accuracy. Hence, it is proposed to gauge the initial performance of retrosynthesis frameworks using the top-k accuracy as sufficiently high k such as k ≥ 10. A conclusive comparison should be conducted on the metrics introduced in Section 2.2 to gain further insight into reaction feasibility, diversity and invalid predictions.
 matches any subgraph o in the product molecule. As the number of relevant templates to a specific product is limited, the model fails to return a relevant template after a certain top-k. The influence on the top-10/20 invalidity is negligible and thus can be disregarded.
| Algorithms | Top-1 | Top-3 | Top-5 | Top-10 | Top-20 |
|---|---|---|---|---|---|
| Semi-template | |||||
| MEGAN | 0.5 | 1.6 | 2.8 | 5.7 | 10.2 |
| GraphRetro | 0.3 | 0.9 | 1.8 | 3.9 | 7.4 |
| RetroXpert | 2.2 | 5.9 | 8.6 | 13.5 | 18.6 |
| G2Retro | — | — | — | — | — |
![[thin space (1/6-em)]](https://www.rsc.org/images/entities/char_2009.gif) |
|||||
| Template-free | |||||
| Chemformer | 0.5 | 0.7 | 0.7 | 0.7 | 0.7 |
| Graph2Smiles | 0.6 | 9.1 | 15.1 | 25.1 | 35.8 |
| Retroformer | 0.8 | 1.7 | 2.6 | 5.2 | 8 |
| GTA | 0.2 | 0.5 | 0.8 | 1.4 | 6.3 |
| TiedTransformer | 0 | 0 | 0.1 | 0.3 | 6 |
![[thin space (1/6-em)]](https://www.rsc.org/images/entities/char_2009.gif) |
|||||
| Template-based | |||||
| GLN | 0 | 0 | 0 | 0 | 0.2 |
| LocalRetro | 0 | 0 | 0 | 0.1 | 0.5 |
| MHNReact | 0 | 0 | 0 | 0.1 | 0.5 |
3.3 Interpretability study
| Model | Top-1 | Top-2 | Top-3 | Top-5 |
|---|---|---|---|---|
| EGAT | 56.2 | 75.2 | 83.6 | 89.9 |
| EGAT (lit) | 51.5 | — | — | — |
| D-MPNN | 63.5 | 81.1 | 87.1 | 91.7 |
| D-MPNN (lit) | 70.8 | 85.1 | 89.5 | 92.7 |
| Model | Test 1 | Test 2 | Salmeterol | Inhibitor | Warfarin (ESI) |
|---|---|---|---|---|---|
| a fid+ = fid− = 1 i.e. the identified subgraph GS is sufficient for the prediction – however GNNExplainer fails to identify all important nodes in G. | |||||
| EGAT | 0.0 | 1.0 | 0.0 | 1.0 | 1.0 |
| D-MPNN | 1.0 | 1.0 | 1.0 | 1.0 | 1.0 |
3.3.2.1 Case study 1 – test molecule 1. The first case study reaction tested an amide bond formation as shown in Fig. 7. The reaction combines a secondary amine and carboxylic acid to form the respective amide and an equivalent of water. The formation of amides from these reactants is subtly thermodynamically favoured due to lone pair conjugation of the amide with the carbonyl. However, reactions of this form will often require high temperatures or additives to overcome significant energy barriers.
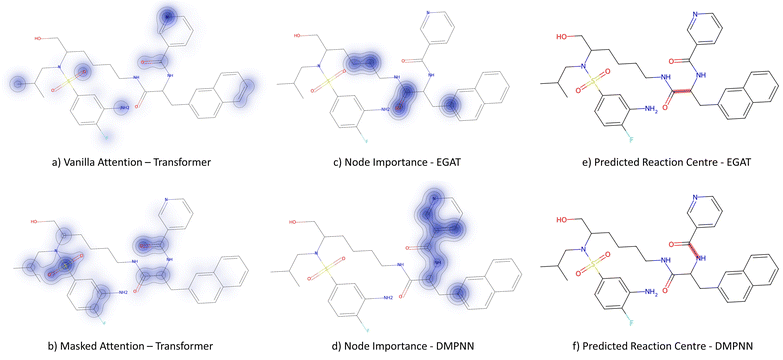
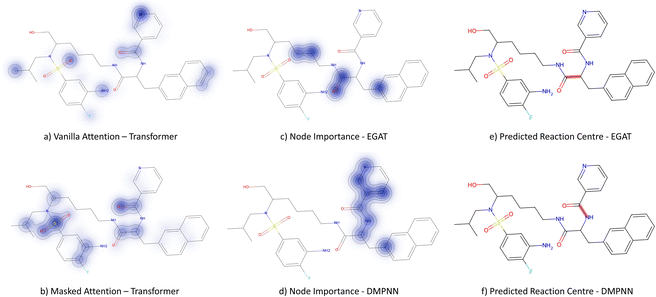
From Fig. 6, the node importance can be inferred visually for both Transformer and GNN models. The Transformer model in subplots a&b highlights the key-stabilising carbonyl in the product molecule. However, both the vanilla- and masked attention models are seen to identify the terminal carbon/fluorine (subplot a) and sulfonamide (subplot b) in the product, which are not relevant for product stabilisation. The D-MPNN model is seen to identify the correct reaction centre (subplot f). The model confidently highlights the amide and carbonyl group in subplot d, indicating the stabilising group in the reaction (along with the stabilising π system). The EGAT model proposes a different reaction centre compared to the case study (subplot e). This reaction undergoes a carbon–carbon bond formation, which commonly involves nucleophilic carbon centres. These carbons can be produced through the use of organometallic species such as Grignard reagents (Fig. 8).
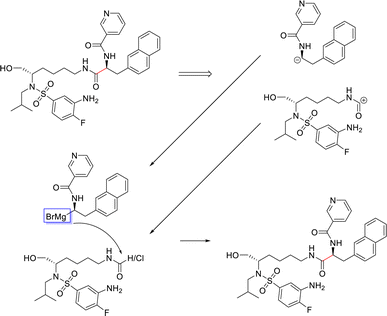 | ||
| Fig. 8 Proposed reaction by EGAT for test molecule 1. C–C bond formation by formamide or carbonyl chloride and Grignard precursors. | ||
While the Grignard reagent can be envisioned to nucleophilically attack into an N-formamide or carbamoyl chloride, it may be challenging to selectively produce the product. In literature, the carbonyl group was seen to be reduced to an alcohol during the nucleophilic attack rendering this reaction profile unfeasible for this bond disconnection.72 Moreover, it would likely be difficult to retain the precursor bromide species to reach this level of functionalisation. The node importance identified by the EGAT model (subplot c) highlights the oxygen on the carbonyl which does induce a slight delta positive charge on the carbon. However, since the fidelity is 0, the returned subgraph GS is not confident, rendering the node mask uncertain. Nonetheless, the amide bond formation in Fig. 7 is a well-understood and (nowadays) optimised reaction. A chemist would strongly prefer this reaction over the more difficult C–C bond formation. Thus, the GNNExplainer is queried to provide a node mask for the amide formation. The EGAT model is seen to successfully highlight the carbonyl functionalisation (ESI – S4.3†) as done by the D-MPNN model.
3.3.2.2 Case study 2 – test molecule 2. Fig. 10 shows the second reaction obtained from the test dataset, namely a Wittig reaction. The progression from reactants to products in this reaction is largely driven due to the generation of a new, strong P
![[double bond, length as m-dash]](https://www.rsc.org/images/entities/char_e001.gif) O double bond. In addition, the generation of the alkene bond in the product is also slightly stronger than the precursor carbonyl bond. Given that the models are unaware of the P
O double bond. In addition, the generation of the alkene bond in the product is also slightly stronger than the precursor carbonyl bond. Given that the models are unaware of the P![[double bond, length as m-dash]](https://www.rsc.org/images/entities/char_e001.gif) O bond formation (as it is a by-product), they must derive the bond disconnection from the smaller thermodynamic benefit of the alkene generation.
O bond formation (as it is a by-product), they must derive the bond disconnection from the smaller thermodynamic benefit of the alkene generation.
Fig. 9 depicts the node importance for this case study. It is seen that neither the vanilla nor the masked attention models can pick out the newly formed alkene bond (subplots a & b). Instead, attention is provided to the thiophene and the tertiary amine. The GNN models are both seen to predict the correct bond formation. In subplot c, the EGAT model highlights part of the alkene and aromatic carbon, but also the secondary alcohol and ester on the lactone. Neither of the alcohol/ester groups is relevant to the Wittig reaction. Solely, the D-MPNN picks up the importance of the alkene along with the aromatic thiophene (subplot d), which leads to extra stabilisation through the extended π system.
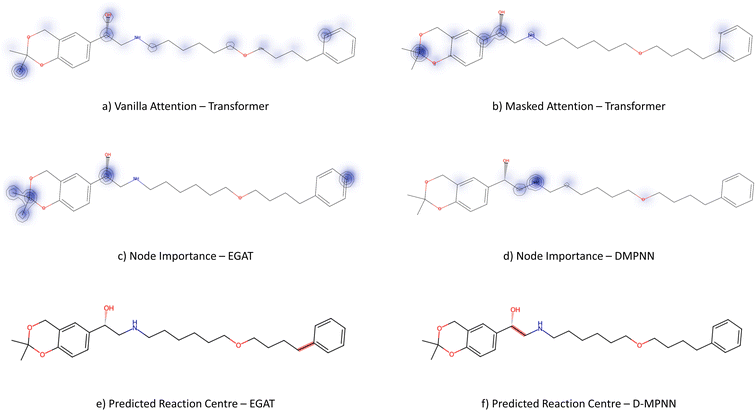
3.3.2.3 Case study 3 – salmeterol. The next case study was selected from industry – salmeterol is an important drug for asthma treatment. Salmeterol can be produced via a nucleophilic substitution (SN2) reaction (Fig. 11). Due to the large carbon chain within the molecule, the task of identifying the correct disconnection site becomes more challenging. The node (atom) weight is shown in Fig. 12. For this substitution reaction, the stabilisation arises from the stronger amine–carbon bond compared to the starting materials. As seen before, the vanilla Transformer fails to identify the amine group, instead, it gives importance to individual carbons along the carbon chain (subplot a). Conversely, the masked attention mechanism focuses on the amine group, but it still faces a similar challenge of attending to irrelevant atoms within the molecule (subplot b). Surprisingly, neither of the two GNN models was capable of predicting the correct reaction centre. The EGAT model predicts the attachment of a benzene ring at the end of the chain (subplot e). Often, substituted benzene rings are utilised as early building blocks for pharmaceuticals as they have a rich chemistry for substitution and tend to remain inert through further functionalisation. With this in mind, many experienced synthetic chemists would likely not classify this as a reasonable bond disconnection. The GNNExplainer struggles to identify an important subgraph for this prediction with a fidelity of 0 (Table 6). An explanation for this prediction can therefore not be provided with full confidence, as a fidelity of 0 indicates uncertainty within the returned subgraph GS by the GNNExplainer. The D-MPNN proposes to react on the secondary alcohol (subplot f). This is a viable synthesis route as shown in Fig. 13. The epoxide can be nucleophilically attacked by the amine.73 For this reaction to happen, the epoxide needs to be fixed in orientation for the correct alcohol to be released. Thus, the greatest challenge lies in maintaining exact stereocontrol. This reaction proceeds generally due to the release of steric strain on the epoxide. The model identifies the amine group and the adjacent carbon as most important to the reaction (subplot d). Both of these groups are indeed important to the reaction; however, it is likely that the model cannot appreciate the presence of a strained 3-membered ring. This reaction centre was probably selected by the model due to the concentrated presence of heteroatoms, rather than its chemical understanding. This hypothesis is further supported by querying the GNNExplainer for the SN2 reaction (ESI S4.3†). It is observed that both GNN models cannot provide adequate reasoning for selecting the SN2, similar to the attention models. This shows that when the carbon chain is long and there are multiple potential disconnection sites, the graph models struggle to identify the correct chemistry.
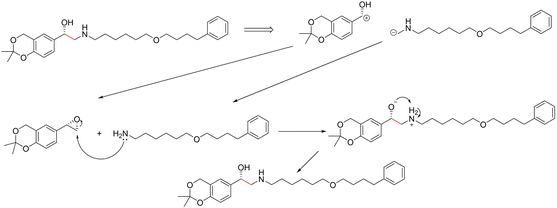 | ||
| Fig. 13 Proposed reaction by D-MPNN for salmeterol. C–C bond formation through nucleophilic attack by amine on epoxide. | ||
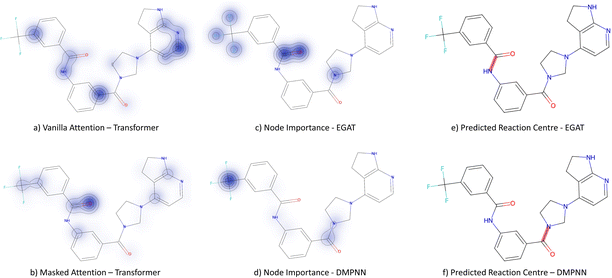
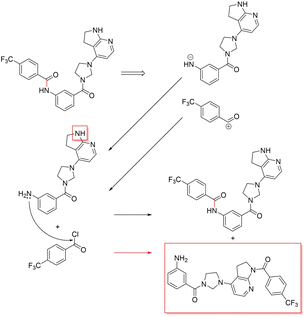
3.3.2.4 Case study 4 – kinase inhibitor. The next molecule is a kinase inhibitor,24 which is synthesised as seen in Fig. 14. The inhibitor is produced via an amide-bond formation. Again, the stabilisation is obtained through the carbonyl and amine resonance and lone-pair conjugation. As seen before for test molecule 1, both Transformer models cannot find the appropriate reaction centre nor the importance of the amine/carbonyl (Fig. 15 subplots a/b). Conversely, the D-MPNN predicts the correct reaction centre (subplot f) and identifies both the amine and carbonyl as key functional groups that stabilise the molecule (subplot d). The EGAT on the other hand proposes a different reaction centre, that pertains to a second amide bond in the molecule (subplot e). The node importance in subplot c is seen to identify the relevant stabilising carbonyl group for this reaction centre. The proposed reaction is shown in Fig. 16. While this is a feasible reaction, it is less efficient than the ground-truth reaction. This is because the lone pair on the aniline amine is conjugated into the aromatic system. Thus, the lone pair is less available for donation. Not only does this affect the reaction rate and yield, but also the selectivity. This is because a more nucleophilic nitrogen exists in the same molecule as an alkyl amine (highlighted in red, Fig. 16) which would compete in the reaction (and most likely be the major product).74 As done before, the GNNExplainer is queried for the node importance for the correct reaction centre (ESI†). It is observed that the EGAT model puts the highest importance on the carbonyl, similar to the D-MPNN.
(1) Transformer sequence-to-sequence models generally struggle to identify the reaction centre and relevant functional groups within the target molecule for the retrosynthetic setting. Instead, the model is hypothesised to learn the translation of one SMILES sequence into another. The masked attention model confines its attention to a select few tokens. Consequently, the task resembles a SMILES sequence correction from the product to the reactants. The Transformer would therefore benefit from a larger database to identify patterns within the data for the translation setting. If the Transformer can discover novel chemistry without sufficient chemical interpretability remains to be seen. Nevertheless, there is no intent to discourage the use of Transformers for retrosynthesis. To address the lack of interpretability, researchers could explore the development of an uncertainty measure that provides insights into the model's reliability in its predictions. Such a measure would enable the end-user to place a higher level of trust in the model's predictions.
(2) For simpler case studies, the classification graph models are observed to provide adequate reasoning for their prediction. Even if the identified reaction centre is incorrect, the highlighted functional groups provide reasoning for the model's prediction (e.g. test molecule 4 – EGAT, salmeterol – D-MPNN). Nonetheless, as the molecule becomes more complex with multiple potential reaction centres (salmeterol) or more difficult with respect to the mechanism (warfarin – ESI†), the graph models are more prone to provide unreasonable disconnection sites. Since the input features to the GNNs are often chosen randomly, the model is believed to be disadvantaged at finding discovering chemical patterns in the data. The GNN model would therefore benefit from better featurisation (detailed in Section 4). As a note to the reader, the GNNExplainer is a useful tool, but not robust. It requires both model and hyperparameter fine-tuning. The fidelity metric remedies some of its flaws, informing the user of uncertainty in the subgraph selection. However, with better chemical descriptors as input features, the model interpretability could possibly be inferred directly from the descriptor (or through dimensionality reduction techniques).
(3) Finally, the Direct Message Passing Network (D-MPNN) is found to be superior for reaction prediction and explanation. The D-MPNN differs from the conventional Message Passing Network in a major fashion: The messages in the graph propagate via directed edges (bonds) rather than nodes (atoms). This has the advantage of preventing information from being passed back and forth between adjacent nodes.75 Furthermore, in the case of edge-centered updates, the finalised node embeddings are constructed by aggregating the updated edge embeddings along with initial node features. Subsequently, the atoms (nodes) incorporate a larger proportion of initial atom features. This finding supports the importance of selecting representative chemical descriptors.
4 Conclusion and future work
The integration of machine learning into chemical reaction and retrosynthesis predictions has revolutionised the discovery of molecules and synthesis pathways. As the number of retrosynthesis algorithms grows, distinguishing their strengths and weaknesses becomes increasingly complex. The prevalent use of the top-k evaluation metric obscures genuine performance, hindering direct comparisons and posing challenges for end-users and the research community. Addressing these issues, we introduced an open-access benchmarking pipeline that evaluates model performance through a reaction feasibility metric whilst ensuring diverse and chemically valid retrosynthetic predictions. The evaluation on the USPTO-50k case study revealed that frameworks using reaction knowledge, especially in the form of templates, demonstrate superior performance, yielding chemically viable and diverse predictions. Conversely, frameworks relying on deep learning architectures like Transformers and Graph Neural Networks encounter challenges in predicting feasible molecules and reactions. An investigation of model interpretability highlighted the limitations of Transformer models in understanding specific functional groups, possibly limiting their ability to propose novel reactions. Graph-based models performed better in recognising critical motifs, contributing to product stabilisation – but faced challenges with complex reactions.From this investigation, the following research directions are proposed: the template-based models demonstrate the best performance but struggle with novel chemistry, and their performance is known to degrade with larger datasets. To address this challenge, we suggest a hybrid approach, integrating Graph Neural Networks to identify reaction centres prior to the template classification task to reduce the number of applicable templates for a given molecule. Template-free models (Transformer) using SMILES are seen to underperform due to the complex many-to-many mapping problem between SMILES. This prompts the consideration of alternative string-based representations such as SELFIES.40 SELFIES are robust in nature as each SELFIES can be translated to a valid molecule directly. Nevertheless, as SELFIES are non-unique, the many-to-many mapping problem remains. Another ongoing challenge for template-free models lies in the prediction of diverse reactions. As shown by the TiedTransformer model, diverse predictions can result in a large proportion of chemically feasible predictions whilst providing the end-user with more choices. Therefore, using latent variables or tags76 to increase the diversity of reaction prediction is an intriguing idea. Finally, semi-template (graph-edit) models show a basic understanding of chemical knowledge but struggle in the determination of feasible reaction centres for more complex molecules or reaction mechanisms. Incorporating chemically informed features, such as electronegativity, bond strength and dissociation energy, is suggested for performance improvement. The difficulty in predicting changes in stereochemistry during reactions is an ongoing challenge, with attempts made to address this issue by Zhong et al.49 Overall, we emphasise the need for advancements in molecular representation as input featurisation to the model and diversity in retrosynthesis prediction.
Data availability
The code for the presented paper, including the benchmarking pipeline and interpretability study, can be found at https://github.com/OptiMaL-PSE-Lab/EvalRetro. The version of the code employed for this study is Python v. 3.10. The datasets utilised for the benchmarking study are available from https://doi.org/10.6084/m9.figshare.c.7100437.Author contributions
Friedrich Hastedt: conceptualisation, methodology, software, data curation, formal analysis, writing – original draft. Rowan M. Bailey: formal analysis, validation, visualisation, investigation, writing – review & editing. Klaus Hellgardt: supervision, writing – review & editing. Sophia N. Yaliraki: supervision, writing – review & editing. Antonio del Rio Chanona: funding acquisition, project administration, supervision, writing – review & editing. Dongda Zhang: conceptualisation, project administration, supervision, writing – review & editing.Conflicts of interest
No conflicts to declare.Acknowledgements
This work was supported by the Engineering and Physical Sciences Research Council (EPSRC) funding grant EP/S023232/1.References
- J. Meyers, B. Fabian and N. Brown, Drug Discovery Today, 2021, 26, 2707–2715 CrossRef CAS PubMed.
- O. Méndez-Lucio, M. Ahmad, E. A. del Rio-Chanona and J. K. Wegner, Nat. Mach. Intell., 2021, 3, 1033–1039 CrossRef.
- A. D. Clayton, J. A. Manson, C. J. Taylor, T. W. Chamberlain, B. A. Taylor, G. Clemens and R. A. Bourne, React. Chem. Eng., 2019, 4, 1545–1554 RSC.
- E. J. Corey and W. T. Wipke, Science, 1969, 166, 178–192 CrossRef CAS PubMed.
- Z. Zhong, J. Song, Z. Feng, T. Liu, L. Jia, S. Yao, T. Hou and M. Song, Wiley Interdiscip. Rev.: Comput. Mol. Sci., 2024, 14, 1694 Search PubMed.
- M. H. Todd, Chem. Soc. Rev., 2005, 34, 247–266 RSC.
- E. J. Corey, W. T. Wipke, R. D. Cramer III and W. J. Howe, J. Am. Chem. Soc., 1972, 94, 421–430 CrossRef CAS.
- Merck, SYNTHIA™ Retrosynthesis Software Search PubMed.
- P. Y. Johnson, D. Burnstein, J. Crary, M. Evans and T. Wang, in Designing an expert system for organic synthesis in expert systems application in chemistry, ACS Symposiums Series of American Chemical Society, 1989, ch. 9 Search PubMed.
- Y. Jiang, Y. Yu, M. Kong, Y. Mei, L. Yuan, Z. Huang, K. Kuang, Z. Wang, H. Yao, J. Zou, C. Coley and Y. Wei, Engineering, 2022, 25, 32–50 CrossRef.
- M. H. Segler and M. P. Waller, Chem.–Eur. J., 2017, 23, 5966–5971 CrossRef CAS PubMed.
- C. W. Coley, W. H. Green and K. F. Jensen, Acc. Chem. Res., 2018, 51, 1281–1289 CrossRef CAS PubMed.
- B. Chen, C. Li, H. Dai and L. Song, The 37th International Conference on Machine Learning (ICML 2020), 2020 Search PubMed.
- C. W. Coley, L. Rogers, W. H. Green and K. F. Jensen, J. Chem. Inf. Model., 2018, 58, 252–261 CrossRef CAS PubMed.
- S. Bennett, F. T. Szczypiński, L. Turcani, M. E. Briggs, R. L. Greenaway and K. E. Jelfs, J. Chem. Inf. Model., 2021, 61, 4342–4356 CrossRef CAS PubMed.
- P. Schwaller, R. Petraglia, V. Zullo, V. H. Nair, R. A. Haeuselmann, R. Pisoni, C. Bekas, A. Iuliano and T. Laino, Chem. Sci., 2020, 11, 3316–3325 RSC.
- J. Dong, M. Zhao, Y. Liu, Y. Su and X. Zeng, Briefings Bioinf., 2022, 23(1), bbab391 CrossRef PubMed.
- K. Maziarz, A. Tripp, G. Liu, M. Stanley, S. Xie, P. Gaiński, P. Seidl and M. Segler, NeurIPS 2023 AI for Science Workshop, 2023 Search PubMed.
- M. Krenn, R. Pollice, S. Y. Guo, M. Aldeghi, A. Cervera-Lierta, P. Friederich, G. dos Passos Gomes, F. Häse, A. Jinich, A. Nigam, Z. Yao and A. Aspuru-Guzik, Nat. Rev. Phys., 2022, 4, 761–769 CrossRef PubMed.
- C. W. Coley, W. H. Green and K. F. Jensen, J. Chem. Inf. Model., 2019, 59, 2529–2537 CrossRef CAS PubMed.
- D. S. Wigh, J. M. Goodman and A. A. Lapkin, Wiley Interdiscip. Rev.: Comput. Mol. Sci., 2022, 12, e1603 Search PubMed.
- H. Dai, C. Li, C. Coley, B. Dai and L. Song, Advances in Neural Information Processing Systems, 2019, pp. 8870–8880 Search PubMed.
- P. Seidl, P. Renz, N. Dyubankova, P. Neves, J. Verhoeven, J. K. Wegner, M. Segler, S. Hochreiter and G. Klambauer, J. Chem. Inf. Model., 2022, 62, 2111–2120 CrossRef CAS PubMed.
- S. Chen and Y. Jung, JACS Au, 2021, 1, 1612–1620 CrossRef CAS PubMed.
- B. Liu, B. Ramsundar, P. Kawthekar, J. Shi, J. Gomes, Q. Luu Nguyen, S. Ho, J. Sloane, P. Wender and V. Pande, ACS Cent. Sci., 2017, 3, 1103–1113 CrossRef CAS PubMed.
- D. Weininger, J. Chem. Inf. Comput. Sci., 1988, 28, 31–36 CrossRef CAS.
- P. Schwaller, T. Laino, T. Gaudin, P. Bolgar, C. A. Hunter, C. Bekas and A. A. Lee, ACS Cent. Sci., 2019, 5, 1572–1583 CrossRef CAS PubMed.
- P. Karpov, G. Godin and I. V. Tetko, Artificial Neural Networks and Machine Learning – ICANN 2019: Workshop and Special Sessions, Cham, 2019, pp. 817–830 Search PubMed.
- A. Vaswani, N. Shazeer, N. Parmar, J. Uszkoreit, L. Jones, A. N. Gomez, L. Kaiser and I. Polosukhin, Advances in Neural Information Processing Systems, 2017 Search PubMed.
- R. Irwin, S. Dimitriadis, J. He and E. J. Bjerrum, Mach. Learn.: Sci. Technol., 2022, 3, 015022 Search PubMed.
- I. V. Tetko, P. Karpov, R. Van Deursen and G. Godin, Nat. Commun., 2020, 11, 5575 CrossRef CAS PubMed.
- E. Kim, D. Lee, Y. Kwon, M. S. Park and Y.-S. Choi, J. Chem. Inf. Model., 2021, 61, 123–133 CrossRef CAS PubMed.
- B. Chen, T. Shen, T. S. Jaakkola and R. Barzilay, arXiv, 2019, preprint, arXiv:1910.09688, DOI:10.48550/arXiv.1910.09688.
- S. Seo, Y. Y. Song, J. Y. Yang, S. Bae, H. Lee, J. Shin, S. J. Hwang and E. Yang, AAAI Conference on Artificial Intelligence, 2021, pp. 531–539 Search PubMed.
- Z. Tu and C. W. Coley, J. Chem. Inf. Model., 2022, 62, 3503–3513 CrossRef CAS PubMed.
- K. Mao, X. Xiao, T. Xu, Y. Rong, J. Huang and P. Zhao, Neurocomputing, 2021, 457, 193–202 CrossRef.
- Y. Wan, C.-Y. Hsieh, B. Liao and S. Zhang, Proceedings of the 39th International Conference on Machine Learning, 2022, pp. 22475–22490 Search PubMed.
- N. O'Boyle and A. Dalke, ChemRxiv, 2018, preprint, DOI:10.26434/chemrxiv.7097960.v1.
- U. V. Ucak, I. Ashyrmamatov and J. Lee, J. Cheminf., 2023, 15, 55 Search PubMed.
- M. Krenn, F. Häse, A. Nigam, P. Friederich and A. Aspuru-Guzik, Mach. Learn.: Sci. Technol., 2020, 1, 045024 Search PubMed.
- U. V. Ucak, I. Ashyrmamatov, J. Ko and J. Lee, Nat. Commun., 2022, 13, 1186 CrossRef CAS PubMed.
- C. W. Coley, L. Rogers, W. H. Green and K. F. Jensen, ACS Cent. Sci., 2017, 3, 1237–1245 CrossRef CAS PubMed.
- C. Shi, M. Xu, H. Guo, M. Zhang and J. Tang, Proceedings of the 37th International Conference on Machine Learning, 2020 Search PubMed.
- Z. Chen, O. R. Ayinde, J. R. Fuchs, H. Sun and X. Ning, Commun. Chem., 2023, 6, 102 CrossRef PubMed.
- C. Yan, Q. Ding, P. Zhao, S. Zheng, J. Yang, Y. Yu and J. Huang, Proceedings of the 34th International Conference on Neural Information Processing Systems, Red Hook, NY, USA, 2020 Search PubMed.
- V. R. Somnath, C. Bunne, C. W. Coley, A. Krause and R. Barzilay, Thirty-Fifth Conference on Neural Information Processing Systems, 2021 Search PubMed.
- M. Sacha, M. Błaż, P. Byrski, P. Dąbrowski-Tumański, M. Chromiński, R. Loska, P. Włodarczyk-Pruszyński and S. Jastrzębski, J. Chem. Inf. Model., 2021, 61, 3273–3284 CrossRef CAS PubMed.
- J. Liu, C. Yan, Y. Yu, C. Lu, J. Huang, L. Ou-Yang and P. Zhao, Bioinformatics, 2024, btae115 CrossRef PubMed.
- W. Zhong, Z. Yang and C. Y.-C. Chen, Nat. Commun., 2023, 14, 3009 CrossRef CAS PubMed.
- P. Torren-Peraire, A. K. Hassen, S. Genheden, J. Verhoeven, D.-A. Clevert, M. Preuss and I. V. Tetko, Digital Discovery, 2024, 3, 558–572 RSC.
- D. M. Lowe, PhD thesis, University of Cambridge, 2012 Search PubMed.
- N. Schneider, N. Stiefl and G. A. Landrum, J. Chem. Inf. Model., 2016, 56, 2336–2346 CrossRef CAS PubMed.
- G. Landrum, RDKit: Open-source cheminformatics Search PubMed.
- S. Genheden and E. Bjerrum, Digital Discovery, 2022, 1, 527 RSC.
- P. Ertl and A. Schuffenhauer, J. Cheminf., 2009, 1, 8 Search PubMed.
- C. W. Coley, W. Jin, L. Rogers, T. F. Jamison, T. S. Jaakkola, W. H. Green, R. Barzilay and K. F. Jensen, Chem. Sci., 2019, 10, 370–377 RSC.
- N. Schneider, D. M. Lowe, R. A. Sayle and G. A. Landrum, J. Chem. Inf. Model., 2015, 55, 39–53 CrossRef CAS PubMed.
- P. Schwaller, D. Probst, A. C. Vaucher, V. H. Nair, D. Kreutter, T. Laino and J.-L. Reymond, Nat. Mach. Intell., 2021, 3, 144–152 CrossRef.
- D. Probst, P. Schwaller and J.-L. Reymond, Digital Discovery, 2022, 1, 91–97 RSC.
- G. Skoraczyński, M. Kitlas, B. Miasojedow and A. Gambin, J. Cheminf., 2023, 15, 6 Search PubMed.
- S. Ishida, K. Terayama, R. Kojima, K. Takasu and Y. Okuno, J. Chem. Inf. Model., 2019, 59, 5026–5033 CrossRef CAS PubMed.
- R. Ying, D. Bourgeois, J. You, M. Zitnik and J. Leskovec, Proceedings of the 33rd International Conference on Neural Information Processing Systems, 2019 Search PubMed.
- K. Amara, R. Ying, Z. Zhang, Z. Han, Y. Shan, U. Brandes, S. Schemm and C. Zhang, arXiv, 2022, preprint, arXiv:2206.09677, DOI:10.48550/arXiv.2206.09677.
- D. P. Kovács, W. McCorkindale and A. A. Lee, Nat. Commun., 2021, 12, 1695 CrossRef PubMed.
- V. Miglani, A. Yang, A. H. Markosyan, D. Garcia-Olano and N. Kokhlikyan, 3rd Workshop for Natural Language Processing Open Source Software, 2023 Search PubMed.
- S. Vashishth, S. Upadhyay, G. S. Tomar and M. Faruqui, arXiv, 2019, preprint, arXiv:1909.11218, DOI:10.48550/arXiv.1909.11218.
- A. Paszke, S. Gross, F. Massa, A. Lerer, J. Bradbury, G. Chanan, T. Killeen, Z. Lin, N. Gimelshein, L. Antiga, A. Desmaison, A. Kopf, E. Yang, Z. DeVito, M. Raison, A. Tejani, S. Chilamkurthy, B. Steiner, L. Fang, J. Bai and S. Chintala, Advances in Neural Information Processing Systems 32, Curran Associates, Inc., 2019, pp. 8024–8035 Search PubMed.
- M. Fey and J. E. Lenssen, ICLR Workshop on Representation Learning on Graphs and Manifolds, 2019 Search PubMed.
- G. Klein, Y. Kim, Y. Deng, J. Senellart and A. Rush, Proceedings of ACL 2017, System Demonstrations, Vancouver, Canada, 2017, pp. 67–72 Search PubMed.
- D. Varis and O. Bojar, Conference on Empirical Methods in Natural Language Processing, 2021 Search PubMed.
- C. Yan, uta-smile/RetroXpert, github/uta-smile Search PubMed.
- C. Zhang, Q. Wang, S. Tian, J. Zhang, J. Li, L. Zhou and J. Lu, Org. Biomol. Chem., 2020, 18, 4723–4727 RSC.
- V. A. Pal’chikov, S. Y. Mykolenko, A. N. Pugach and F. I. Zubkov, Russ. J. Org. Chem., 2017, 53, 656 CrossRef.
- W. Dohle, X. Su, Y. Nigam, E. Dudley and B. V. L. Potter, Molecules, 2023, 28, 5 CrossRef CAS PubMed.
- K. Yang, K. Swanson, W. Jin, C. Coley, P. Eiden, H. Gao, A. Guzman-Perez, T. Hopper, B. Kelley, M. Mathea, A. Palmer, V. Settels, T. Jaakkola, K. Jensen and R. Barzilay, J. Chem. Inf. Model., 2019, 59, 3370–3388 CrossRef CAS PubMed.
- A. Toniato, A. C. Vaucher, P. Schwaller and T. Laino, Digital Discovery, 2023, 2, 489–501 RSC.
Footnotes |
| † Electronic supplementary information (ESI) available. See DOI: https://doi.org/10.1039/d4dd00007b |
| ‡ Refer to building block (i) below, as outlined by Coley et al.12 |
| § We confirmed the accuracy on the USPTO-50k dataset lacking reagent information. Note that the absence of reagent information within the USPTO-50k (compared to USPTO-MIT) might deteriorate the prediction accuracy for the forward model depending on the model architecture, e.g., for language-based models. |
| This journal is © The Royal Society of Chemistry 2024 |

