 Open Access Article
Creative Commons Attribution 3.0 Unported Licence
Electrospun porous La–Sr–Co–Ni–O nanofibers for highly sensitive non-enzymatic glucose detection†
Kasci D.
Pelucarte‡§
a,
Tashi A.
Hatchell‡
a,
Gibin
George‡§
 a,
Sivasankara Rao
Ede
a,
Menuka
Adhikari
a,
Yulin
Lin
b,
Jianguo
Wen
a,
Sivasankara Rao
Ede
a,
Menuka
Adhikari
a,
Yulin
Lin
b,
Jianguo
Wen
 b,
Zhiping
Luo
 a and
Shubo
Han
 *a
*a
aDepartment of Chemistry, Physics, and Materials Science, Fayetteville State University, Fayetteville, NC 28301, USA. E-mail: shan@uncfsu.edu
bCenter for Nanoscale Materials, Argonne National Laboratory, Lemont, IL 60439, USA
First published on 11th January 2022
Abstract
Glucose biosensors are widely used for clinical, industrial, and environmental applications. Nonenzymatic electrochemical glucose biosensors based on metal oxides with a perovskite structure have exhibited high sensitivity, excellent stability, and cost efficiency. In this work, porous La–Sr–Co–Ni–O (LSCNO) nanofibers, with an ABO3-type perovskite structure, were prepared through optimizing the A-site and B-site elements by electrospinning, followed with calcination at 700 °C for 5 h. Characterized by scanning and transmission electron microscopy, X-ray diffraction, and X-ray photoelectron spectroscopy, fabricated nanofibers were confirmed to be porous and nanosized polycrystalline grains with high crystallinity. A novel La0.75Sr0.25Co0.5Ni0.5O3-based nonenzymatic electrochemical biosensor was developed, which is sensitive to glucose because of an electrochemically catalytic mechanism, a mediated electron transfer involving Ni(II)/Ni(III) or Co(II)/Co(III), accompanying with gluconic acid complexation. The glucose biosensor presented a linear response in the range of 0.1–1.0 mM with a calibration sensitivity of 924 ± 28 μA mM−1, a proportion of the variance of 0.9926, and a lower limit of detection of 0.083 mM, respectively, demonstrating an outstanding analytical performance. The biosensor showed no response to the most widely used anionic surfactant, sodium dodecyl sulfate, and low sensitivity to other biomolecules, such as fructose, lactose, galactose, mannose, dopamine, and ascorbic acid. A urine sample was tested by this novel nonenzymatic electrochemical biosensor by standard addition method, suggesting a potential application for clinical test.
1. Introduction
Non-enzymatic fast and accurate detection of biological molecules is fascinating because of their potential applications in disease diagnosis and management, biological analysis, food industry, and environmental protection. Numerous electrochemical techniques have been widely used as probes for a routine analysis of body fluids for the detection of pathogens and biomarkers to identify several diseases. However, the search for non-enzymatic sensors for biomarkers is constantly increasing due to their high selectivity, low detection limit, stability, low cost, and reproducibility as compared to enzymatic counterparts.1 The non-enzymatic sensors rely on the electrocatalytic oxidation of analytes at the electrode surface in the absence of any expensive enzymes, reducing their cost considerably. Noble metals are identified as promising catalysts for electrochemical catalysis and sensing; however, their high cost and potential catalyst poisoning limit their extensive applications.2Nanostructured metal oxides are considered as the most promising low-cost alternatives to the enzymatic and noble metal sensors for the selective detection of biomarkers. Several transition metal oxides are identified as suitable candidates for glucose3–7 and dopamine.8–10 The characteristics of the electrode surface are the primary factor that controls the electrochemical sensing of the above analytes. Thus, morphology, porosity, and size of the electrode materials have a significant impact on the sensitivity, selectivity, response time, and limit of detection of the nanostructured electrochemically active oxides for sensors.11–13 Transition metal oxides from nickel, copper, and cobalt are widely studied as non-enzymatic sensors for the detection of glucose and other biomarkers. There are several attempts to increase the sensitivity of these oxides by adopting different morphologies, increasing the porosity, and forming composites with other conductive materials, such as graphene and carbon nanotubes.10–12
Perovskite oxides with the general formula ABO3 are recognized as electrocatalysts for fuel cells,14,15 supercapacitors,16–18 and batteries.19,20 They are also sensitive to several biomarkers such as glucose,21 H2O2,22 dopamine,23etc. The unique characteristics of perovskite oxides are their three-dimensional network structure, which can accommodate abundant oxygen vacancies retaining their structural integrity.24 It is also important to note that perovskite structures can accommodate multiple elements in the periodic table to their lattice without compromising the crystal structure.17,25 The incorporation of other elements to the lattice can improve the selectivity and sensitivity towards various analytes through the manipulation of defects present in them. Perovskites containing transition metals such as Ni, Co, and Fe in their B-site and their composites are the most sought electrochemically active materials for sensing.
Nonenzymatic electrochemical glucose biosensors using perovskite oxide have been continuously attracting great attentions due to the growing requirements for diabetes management, food quality control, and bioprocess inspection, monitoring of glucose in various matrixes.26–29 Although enzyme-based glucose biosensors still prevail in market, intrinsic problems remain in an enzymatic glucose sensor, such as low enzyme stability, high environmental dependency, high price, and complicated immobilization procedures, owing to the inadequate stability, denaturation of enzymes, thermal and chemical instability to environmental factors like moisture, pH and temperature.30,31 Perovskite oxide non-enzymatic glucose biosensors have shown great advantages, such as high sensitivity, high surface area, porosity, low cost, and flexibility. In particular, non-enzymatic glucose biosensors are stable to environmental change as no enzymes are used.22,26,32–40
Herein, lanthanum, strontium, nickel and cobalt perovskite nanofibers, a composition that has not been reported previously, were synthesized by using electrospinning method and characterized by various techniques, such as X-ray Diffraction (XRD), X-ray photoelectron spectroscopy (XPS), scanning electron microscopy (SEM), and transmission electron microscopy (TEM). A nonenzymatic electrochemical glucose biosensor was presented with linear response between 0.1 mM and 1 mM by using cyclic voltammetry. The calibration sensitivity of 924 μA mM−1 and lower limit of detection (LLOD) of 0.083 mM were obtained. This level is much lower than the normal blood glucose level of 3.9–5.6 mM, indicating a potential biomedical application for blood test.
2. Experimental
2.1 Materials
Polyvinylpyrrolidone (PVP) with a mean molecular weight![[M with combining macron]](https://www.rsc.org/images/entities/i_char_004d_0304.gif) w = 1.3 × 10⁶ g mol−1, lanthanum(III) nitrate hydrate (99.9%), strontium nitrate, nickel(II) nitrate hexahydrate, cobalt(II) nitrate hexahydrate, manganese(II) nitrate hydrate, iron(III) nitrate nonahydrate, N,N-dimethylformamide (DMF), and ethanol were purchased from Sigma Aldrich and were used without further purification to fabricate the precursor composite fibers. NaOH procured from Sigma Aldrich and carbon cloth obtained from MTI were used for the electrochemical measurements. D-(+)-Glucose (Anhydrous, ACS), D-(−)-fructose (Powder, high purity), lactose monohydrate (ACS), D-(+)-galactose (≥99.0%), D-(+)-mannose (≥99%), dopamine hydrochloride (99%), L(+)-ascorbic acid (ACS), and other chemicals were purchased from VWR International.
w = 1.3 × 10⁶ g mol−1, lanthanum(III) nitrate hydrate (99.9%), strontium nitrate, nickel(II) nitrate hexahydrate, cobalt(II) nitrate hexahydrate, manganese(II) nitrate hydrate, iron(III) nitrate nonahydrate, N,N-dimethylformamide (DMF), and ethanol were purchased from Sigma Aldrich and were used without further purification to fabricate the precursor composite fibers. NaOH procured from Sigma Aldrich and carbon cloth obtained from MTI were used for the electrochemical measurements. D-(+)-Glucose (Anhydrous, ACS), D-(−)-fructose (Powder, high purity), lactose monohydrate (ACS), D-(+)-galactose (≥99.0%), D-(+)-mannose (≥99%), dopamine hydrochloride (99%), L(+)-ascorbic acid (ACS), and other chemicals were purchased from VWR International.
2.2 Procedures
The fabrication of the perovskite nanofibers was divided into three steps: (1) preparation of electrospinnable solution containing the stoichiometric quantities of metal salts and gel-forming medium; (2) fabrication of precursor composite fibers by electrospinning process; and finally (3) calcining the precursor composite fibers above the degradation temperature of the volatile components. The electrospinnable precursor solutions were prepared by dissolving 0.07 M of stoichiometric quantities of the metal nitrates in a 20 mL 50/50 ethanol/N, N-dimethylformamide solvent mixture. Then 2.0 g of polyvinylpyrrolidone (PVP) was added to the above solution and stirred vigorously for 12 h to ensure uniform mixing. The electrospinning was conducted at atmospheric conditions with an applied voltage of 15 kV, a flow rate of 300 mL h−1, and a spinneret to collector distance of 17 cm. The calcination temperature was selected based on the degradation temperature of the precursor composite fibers observed from their thermogravimetric analysis (TGA) and Differential thermal analysis (DTA) in a nitrogen atmosphere at a heating rate of 10 °C min−1 (Shimadzu DTG-60). The xerogel fibers obtained through the electrospinning process were subsequently calcined at 700 °C in the air for 5 h at a ramp of 2 °C min−1 to get the resulting perovskite nanofibers.SEM morphological data were collected using a JEOL JSM-6510LV scanning electron microscope. Carbon coated samples were prepared to observe the morphology of the nanofibers in a JEOL field-emission JXA-8530F Electron Probe Microanalyzer (EPMA), which was equipped with an X-ray energy-dispersive spectrometer. For TEM, the nanofibers were dispersed in pure ethanol by sonication for 5 min, and then a drop of the dispersion was placed on a carbon film supported grid and allowed to dry. The grids were observed in the FEI Talos F200X TEM/STEM instrument at 200 kV. The XRD patterns of the calcined nanofibers were recorded by a Rigaku MiniFlex 600 X-ray diffractometer with Cu Kα radiation (λ = 0.154178 nm), with a scan rate of 0.075 deg min−1 in the 2θ range of 10–90°. Surface composition and oxidation states of elements were characterized with XPS by Thermo Scientific ESCALAB 250Xi and the deconvolution of high-resolution XPS spectra were done using OriginPro 2020.
The nanofibers were immobilized on a carbon cloth electrode surface with Nafion as a binder. The nanofiber modified carbon electrode was used as a working electrode to detect glucose with cyclic voltammetry (CV) in the range of 0.2–0.7 Volt (vs. Ag/AgCl, 1M KCl) (CH Instruments Model 440 Potentiostat, 3-electrodes systems: NMCE as working, a platinum wire as the counter, and Ag/AgCl, KCl (1M) as reference electrode).
3. Results and discussion
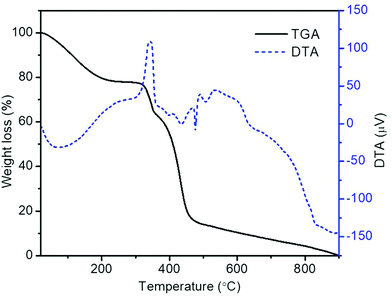
The TGA and DTA plots of electrospun PVP/metal salts composite nanofibers are shown in Fig. 1. As nanofibers exhibit three stages of thermal degradation during their transformation to LSCNO oxide nanofibers, even though the pure PVP exhibit a single step thermal degradation.41 During the first step, removal of adsorbed water from the nanofibers as well as the hydrated metal salts takes place up to ∼200 °C. The onset of degradation of the as-spun precursor nanofibers is ∼300 °C and the degradation is completed at ∼485 °C. During the second step of the degradation, the elimination of organic parts of the mixtures, and the formation of subsequent perovskite oxides takes place. The multiple exothermic and endothermic phase transformations are revealed in the DTA plot. Even though, the weight loss above 485 °C is negligible, the exothermic reaction continues at high temperatures as in the DTA curve above 500 °C, therefore the calcination temperature is chosen as 700 °C.3.1 Crystal structure and morphology
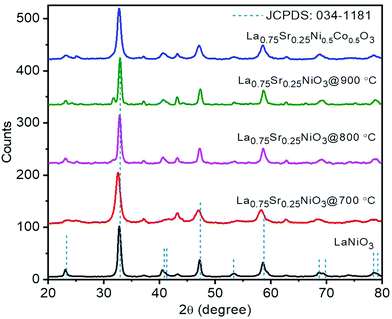
The XRD patterns of representative LSCNO nanofibers are shown in Fig. 2, which confirms the formation of crystalline LSCNO nanofibers after the calcination of electrospun precursor nanofibers. The peaks in the XRD patterns are matching to that of the JCPDS data file no. 034-1181 of LSCNO nanofibers. All the XRD patterns comprise well-defined peaks without any apparent impurity peaks originating from the dopants, which discloses the occupancy of the A and B site dopants in the intended lattice site of the crystal structure. The electrospun ceramic nanofibers are composed of nanosized grains, therefore the XRD peaks are broad in the present study.Fig. 3 shows the SEM images of La0.75Sr0.25Co0.5Ni0.5O3 nanofibers before and after calcination. The SEM images of nanofibers reveal that the surface of the nanofibers is smooth textured in nature. Conversely, the nanofibers after calcination are porous and rough textured with serrated edges. In general, the electrospun nanofibers are composed of myriads of nanosized grains, which are formed by the nucleation and grain growth during the calcination process.42 Additionally, the diameter of the nanofibers after calcination is reduced significantly as compared to the PVP/metal salt precursor composite nanofibers.
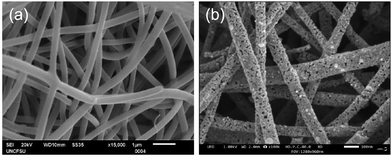 | ||
| Fig. 3 SEM images of (a) PVP/metal salt precursor nanofibers before calcination, and (b) representative LSCNO nanofibers after calcination. | ||
Fig. 4a and b shows the TEM and high-resolution TEM (HRTEM) images of the La0.75Sr0.25Co0.5Ni0.5O3 nanofibers. The TEM images reveal that the nanofibers are polycrystalline in nature, composed of nanosized grains with a highly porous nature of the nanofibers, as revealed in the magnified TEM image in the inset of Fig. 4a. The measured d-spacing from the HRTEM image (Fig. 4b) of LSCNO is consistent with the XRD results. The intermittent rings in the selected-area electron diffraction (SAED) pattern, as shown in Fig. 4c, reveals the polycrystalline nature of the nanofibers with high crystallinity. The nanosized grains composing the nanofibers were formed due to homogeneous nucleation and the spatial confinement of the nanofibers.
 | ||
| Fig. 4 (a) TEM (magnified in the inset), (b) lattice fringes, and (c) HRTEM images of representative LSCNO nanofibers. | ||
The high-resolution XPS analysis was performed to understand the oxidation states of Co and Ni as Sr2+ is replacing the La3+ lattice site. The high-resolution spectrum La 4d (Fig. 5a) reveals the peaks corresponding to La 4d3/2 and La 4d5/2 at ∼103.45 and ∼100.5 eV, respectively, in addition to the satellite peaks. Fig. 5b show the high-resolution spectrum of Sr 3d with significant peaks corresponding to Sr 3d3/2 and Sr 3d5/2, respectively. The multiple peaks observed in the Ni 2p spectrum (Fig. 5c) reveals the two oxidation states of Ni2+ and Ni3+. Similarly, in Fig. 5d, Co 2p spectra also exhibit peaks corresponding to Co2+ and Co3+ oxidation states. Due to the multiple oxidation states of the B-site cations, the charge exchange interactions among the cations are very likely. Apparently, such charge interactions are identified as the dominant mechanism of glucose sensing in non-enzymatic glucose sensors. Therefore, one can expect an efficient non-enzymatic detection of glucose using this material.
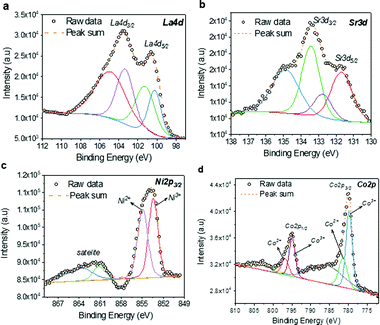 | ||
| Fig. 5 High-resolution XPS spectra of LSCNO nanofibers: (a) La 4d; (b) Sr. 3d; (c) Ni 2d; and (d) Co 2p. | ||
3.2 Compositional optimization for glucose response
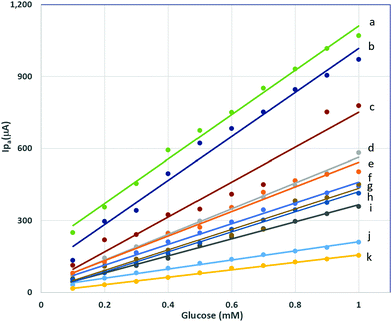
Various compositions of LSCNO nanofibers were synthesized and then modified on a carbon electrode surface. The electrodes immobilized with different compositions of perovskite LSCNO nanofibers were tested on the correlations of anodic peak current (Ipa) vs. glucose concentrations (Fig. 6). As can be seen from Fig. 6 and Table 1, all the compositions displayed linear relationship with good proportions of the variance, indicating potential applications as nonenzymatic glucose sensors. However, compositions of nanofibers significantly affect linear functions (Table 1). Among the compositions of LaNiO3, La0.5Sr0.5NiO3, La0.75Sr0.25NiO3, and La0.9Sr0.1NiO3, a La/Sr ratio at 0.75/0.25, e.g., La0.75Sr0.25NiO3, exhibited the highest calibration sensitivity of 432 ± 13 μA mM−1, thus this ratio was chosen as the La/Sr ratio. Replacing Ni with Co, e.g., La0.75Sr0.25CoO3, gave a calibration sensitivity of 191 ± 5 μA mM−1, a much lower value than that of La0.75Sr0.25NiO3 based biosensor. Interestingly, coexistence of Co and Ni presented surprisingly high sensitivity. As listed in Table 1, LaxSr1–xNiyCo1–yO3 nanofibers displayed the best sensitivity, with a value of 924 ± 28 μA mM−1 for La0.75Sr0.25Co0.5Ni0.5O3, 917 ± 45 μA mM−1 for La0.75Sr0.25Co0.25Ni0.75O3, and 726 ± 62 μA mM−1 for La0.75Sr0.25Co0.75Ni0.25O3. Nevertheless, a further addition of other trace metals showed no apparent improvement in sensitivity. For instance, La0.75Sr0.25Co0.33Ni0.33Fe0.33O3, La0.75Sr0.25Co0.33Ni0.33Mn0.33O3, and La0.75Sr0.25Co0.25Ni0.25Mn0.25Fe0.25O3 presented a calibration sensitivity of 155 ± 3 μA mM−1, 536 ± 12 μA mM−1, and 513 ± 24 μA mM−1, respectively. Factors accounted for the sensitivity discrepancy may include, but not limited to, the ratio of oxidation states, the porous structures, mechanical stability, and surface area of the nanofibers. All the factors largely depend on the compositions and chemical properties of the perovskite nanofibers.| Composition (label in Fig. 6) | Calibration sensitivity (μA mM−1) | R 2 |
|---|---|---|
| LaNiO3 (i) | 355 ± 7 | 0.9964 |
| La0.5Sr0.5NiO3 (g) | 429 ± 26 | 0.9719 |
| La0.75Sr0.25NiO3 (f) | 432 ± 13 | 0.9926 |
| La0.9Sr0.1NiO3 (h) | 418 ± 9 | 0.9964 |
| La0.75Sr0.25CoO3 (j) | 191 ± 5 | 0.9947 |
| La0.75Sr0.25 Co0.5Ni0.5O3 (a) | 924 ± 28 | 0.9926 |
| La0.75Sr0.25Co0.25Ni0.75O3 (b) | 917 ± 45 | 0.9809 |
| La0.75Sr0.25Co0.75Ni0.25O3 (c) | 726 ± 62 | 0.9521 |
| La0.75Sr0.25Co0.33Ni0.33Fe0.33O3 (k) | 155 ± 3 | 0.9964 |
| La0.75Sr0.25Co0.33Ni0.33Mn0.33O3 (d) | 536 ± 12 | 0.9961 |
| La0.75Sr0.25Co0.25Ni0.25Mn0.25Fe0.25 O3 (e) | 513 ± 24 | 0.9821 |
To understand the mechanisms behind the sensitivity connection with compositions, we have analysed the particle shapes and distributions in representatives SEM images (Fig. S2, ESI†). The results are shown in Table 2.
| Nanofiber composition | Diameter (μm) | Predominant particle feature in SEM images |
|---|---|---|
| La0.75Sr0.25CoO3 | 0.11 ± 0.02 | Less porous nanofibers |
| La0.75Sr0.25Co0.75Ni0.25O3 | 0.15 ± 0.09 | Porous nanofibers |
| La0.75Sr0.25 Co0.5Ni0.5O3 | 0.15 ± 0.03 | Porous nanofibers |
| La0.75Sr0.25Co0.25Ni0.75O3 | 0.20 ± 0.05 | Less porous nanofibers and nanosheets |
| La0.75Sr0.25NiO3 | 0.10 ± 0.02 | Less porous nanofibers |
The compositions of LSCNO nanocomposites significantly affected shape, diameter, particle distribution, and porous structures. The porous structures were formed in the Co and Ni mixed perovskites provide higher surface areas. La0.75Sr0.25Co0.5Ni0.5O3 nanocomposites show densely porous nanofiber feature with a well-distributed diameter 0.15 ± 0.03 μm. Consequently, a sensor prepared with this material has higher surface area and well-covered membrane, exhibiting enhanced sensitivity to glucose.
La0.75Sr0.25Co0.5Ni0.5O3, showed the highest calibration sensitivity of 924 ± 28 μA mM−1, and good proportion of the variance, R2 = 0.9926, in the linear range of 0.1–1.0 mM, therefore, this nanofiber material was selected to build the nonenzymatic glucose biosensor. As the standard error of the signal was obtained to be 25.6 μA, a lower limit of detection (LLOD) was then calculated to be 0.083 mM. The La0.75Sr0.25Co0.5Ni0.5O3 nanofibers described above were synthesized at the preselected calcination temperature 700 °C. In contrast, La0.75Sr0.25Co0.5Ni0.5O3 nanofibers synthesized at 800 °C and 900 °C are also linearly responsive to glucose when immobilized at a carbon electrode surface, though the sensitivity decreases as the calcination temperature increases, and the peak features were changed (ESI,† Fig. S1).
A normal fasting blood glucose concentration is between 70 mg dL−1 (3.9 mmol L−1) and 100 mg dL−1 (5.6 mmol L−1). A level from 100 to 125 mg dL−1 (5.6 to 6.9 mmol L−1) is considered prediabetes. A level higher than 126 mg dL−1 (7 mmol L−1) on two separate tests allows the diagnosis of diabetes. Accordingly, the nonenzymatic electrochemical glucose biosensor developed in this research is highly sensitive probe which might be applicable in clinic glucose detection for all groups of the patients.
3.3 LSCNO nanofibers are electrochemical catalyst for glucose oxidation
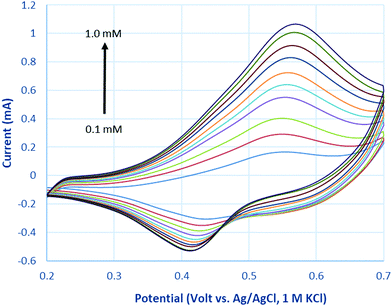
Fig. 7 represents cyclic voltammograms of glucose measured on La0.75Sr0.25Co0.5Ni0.5O3 nanofiber modified carbon electrode as the concentration increased from 0.1 to 1 mM. The anodic peak current (Ipa) was observed to increase proportionally with the increment of glucose concentration; as a result, it is feasible to employ Ipa as a sensing parameter of this nonenzymatic glucose sensor.As glucose is known to be electrochemically inactive within the potential window on a carbon electrode surface, the anodic peak observed above supports the assumption that glucose is catalytically oxidized on the LSCNO nanofiber modified carbon electrode. Similar mechanisms have been reported on carbon electrode modified with Ni-based metal and metal oxide electrodes.43,44 The electrochemical oxidations were seen to occur in the same potential ranges of oxidation of Ni(II) or Co(II). The oxidation peaks of Ni(II) and Co(II) are overlapped and hardly separated on the selected LSCNO modified electrode. However, electrodes modified with different LSCNO compositions may present different features, sometime with separated peaks. As a result, we suggest a mediated electron transfer mechanism involving nickel or cobalt oxidation states,12
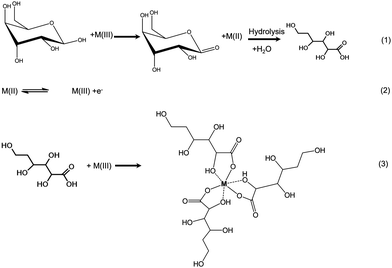
Although an increase of the cathodic peak current (Ipc) with glucose concentration was also observed, the change was much less significant than that of the anodic peak. We predict an increase on surface density of Ni(III) or Co(III) is responsible to the Ipc increment. Glucose continuously diffuses into the nanostructures and then is oxidized to gluconolactone through Step (1). Gluconic acid has been formed through hydrolysis. Ni(II) or Co(II) are quickly formed through Step (1) to give a hike of Ipa, i.e., Step (2). In the meantime, gluconic acid accumulates in the porous LSCNO space of the sensor, chelating metal ions in the lattice sites of the non-stoichiometric perovskite nanomaterials. For example, more Ni3+ or Co3+ ions were released by Step (3) from the lattice sites to the electrode surface, giving to a slight peak increase of Ipc.
The anodic peak potentials marginally shifted to the right and the cathodic peak potential to the left with increasing glucose concentration, owing to the increasing overpotential caused by the limited diffusion coefficient of glucose, leading to delayed mass transport at a higher concentration. For same reason, a similar phenomenon was also observed when increasing the potential scan rate in 1 mM glucose.
3.4 LSCNO nanofibers are responsive to other biomolecules
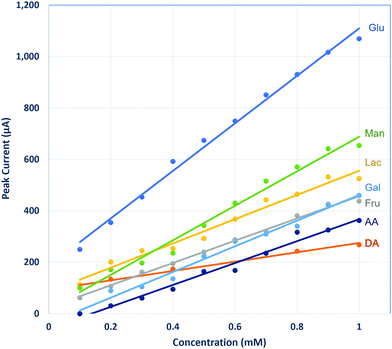
Other common biomolecules such as fructose, lactose, galactose, mannose, dopamine, and ascorbic acid were tested with the LSCNO nanofiber modified electrode. As shown in Fig. 8, although the sensitivity for those molecules is lower than that for glucose, these molecules also show linear response by the nonenzymatic biosensor. Similar behavior has also been reported for other metal oxide-based nonenzymatic glucose biosensors.27,28,38,45–49 Like most available glucose biosensors, glucose monitor interference by the coexisting biomolecules should be considered in real sample measurements.50 However, a biosensor that is sensitive to multiple carbohydrates may find application for multiple carbohydrates monitoring in human body fluid or fermentation processes.51–53Sodium dodecyl sulphate (SDS), the most common anionic surfactant, is an amphiphilic compound that reduce water surface tension. SDS is commonly used as an active ingredient in household and personal care products as well as in specialized applications to fabrics, carpets, and paper. To check if the SDS exposure could cause the interference to the LSCNO-based glucose biosensor, 0.1% SDS solution was tested but did not show any peak. Presence of 0.1% SDS in a 1 mM glucose solution did not significantly change the CV feature and Ipa value, suggesting such sensor was not interfered by SDS.
To examine the feasibility of the prepared sensor for real human fluid samples, we examined a urine sample that was collected at 3 hours after meal (550 kcal) (Fig. S3, ESI†). The subject has no clinical diabetes treatment including insulin or any other medicines. To avoid the matrix effect from the urine fluid, standard addition method was selected in this test. Glucose was found to be 0.599 ± 0.036 mM in the sample. This value is in accord with the normal urine glucose range 0–0.8 mM for a healthy person, suggesting the potential to use this sensor for clinical monitoring.
Other sugars, such as fructose, are at lower concentration level (μmol daily or μM) in urine,54 which will not cause significant interference to the determination of glucose, considering its lower sensitivity for these sugars than for glucose (Fig. 8). As the sensitivity for ascorbic acid is much lower than that of glucose (Fig. 8), a low level of ascorbic acid in urine would not significantly affect the glucose results. However, in a sample with high ascorbic acid level, an independent analysis of ascorbic acid would be necessary to avoid a false positive result.
4. Conclusions
In this work, we fabricated porous LSCNO nanofibers with nanosized polycrystalline grains with high crystallinity, which resulted from homogeneous nucleation and the spatial confinement of the nanofibers. For the first time, LSCNO-based nonenzymatic electrochemical glucose biosensors have been developed, following an electrochemically catalytic mechanism, a mediated electron transfer involving Ni(II)/Ni(III) and Co(II)/Co(III). LSCNO glucose biosensors presented high sensitivity, which was significantly affected by the metal oxide compositions. An optimized composition, La0.75Sr0.25Co0.5Ni0.5O3 was selected to compose the sensor. This nanocomposite has densely porous nanofiber texture with a well-distributed diameter (0.15 ± 0.03 μm), which causes a high surface area and well-covered sensor surface, leading to the highest sensitivity. The La0.75Sr0.25Co0.5Ni0.5O3 immobilized electrode showed linear response to glucose in the range of 0.1–1.0 mM, along with a calibration sensitivity of 924 ± 28 μA mM−1, a R2 of 0.9926, and a LLOD of 0.083 mM, an outstanding analytical performance that is appropriate for a clinical test. The biosensor showed no response to SDS, the most widely used anionic surfactant, but was linearly responsive to other biomolecules, such as fructose, lactose, galactose, mannose, dopamine, and ascorbic acid. Examination of a urine sample by standard addition method showed a 0.599 ± 0.036 mM glucose, which is in accord with the normal urine glucose range for a health person. Consequently, this novel nonenzymatic electrochemical biosensor may also be appealing to the detection of multiple biomolecules.Author contributions
KDP and TAH conducted the nanomaterials preparation, characterization, and biosensor evaluation. GG guided KDP and TAH on electrospinning, and conducted XRD, and XPS experiments, materials synthesis and characterization, as well as manuscript preparation and revision. YL and JW conducted the TEM work. SRE participated in research discussion and XPS data analysis. TAH and MA conducted SEM analysis. ZL participated in project design, experiment supervision, and paper revision. SH supervised the research activity, conducted the data analysis and evaluation, and participated in paper preparation and revision.Conflicts of interest
There are no conflicts to declare.Acknowledgements
This work was supported by NSF EIR (ECCS 1900837), and S. R. Ede was supported by NSF PREM (1827731). Special thanks to Dr Rachel Wells, who guided K. D. Pelucarte and T. A. Hatchell on using JEOL JXA-8530F EPMA to characterize the nanofibers. The EPMA instrumentation at FSU was acquired through the U.S. Department of Defense grant W911NF-09-1-0011.Use of the Center for Nanoscale Materials, an Office of Science user facility, was supported by the U.S. Department of Energy, Office of Science, Office of Basic Energy Sciences, under contract no. DE-AC02-06CH11357.
References
- H. Zhu, L. Li, W. Zhou, Z. Shao and X. Chen, J. Mater. Chem. B, 2016, 4, 7333–7349 RSC.
- Z. Li, F. Gao and Z. Gu, Sens. Actuators, B, 2017, 243, 1092–1101 CrossRef CAS.
- Y. Zhang, Y. Q. Liu, Y. Bai, X. L. Li and W. Chu, Appl. Surf. Sci., 2021, 539 Search PubMed.
- K. Tian, K. Baskaran and A. Tiwari, Vacuum, 2018, 155, 696–701 CrossRef CAS.
- L. Sinha, S. Pakhira, P. Bhojane, S. Mali, C. K. Hong and P. M. Shirage, ACS Sustainable Chem. Eng., 2018, 6, 13248–13261 CrossRef CAS.
- M. Palmer, M. Masikini, L. W. Jiang, J. J. Wang, F. Cummings, J. Chamier, O. Inyang and M. Chowdhury, J. Alloys Compd., 2021, 853 Search PubMed.
- G. George and S. Anandhan, Thin Solid Films, 2016, 610, 48–57 CrossRef CAS.
- E. Bahrami, R. Amini and S. Vardak, J. Alloys Compd., 2021, 855 Search PubMed.
- Y. Y. Li, P. Kang, S. Q. Wang, Z. G. Liu, Y. X. Li and Z. Guo, Sens. Actuators, B, 2021, 327 CAS.
- J. Liu, L. L. Sun, G. L. Li, J. Hu and Q. G. He, Mater. Res. Bull., 2021, 133 Search PubMed.
- T. Tite, E. A. Chiticaru, J. S. Burns and M. Ionita, J. Nanobiotechnol., 2019, 17 Search PubMed.
- Q. Cheng, L. D. Ji, K. B. Wu and W. K. Zhang, Sci. Rep., 2016, 6 Search PubMed.
- R. Abdel-Karim, Y. Reda and A. Abdel-Fattah, J. Electrochem. Soc., 2020, 167 Search PubMed.
- D. M. Bastidas, S. W. Tao and J. T. S. Irvine, J. Mater. Chem., 2006, 16, 1603–1605 RSC.
- S. Afroze, A. Karim, Q. Cheok, S. Eriksson and A. K. Azad, Front. Energy, 2019, 13, 770–797 CrossRef.
- X. Q. Lang, H. Y. Mo, X. Y. Hu and H. W. Tian, Dalton Trans., 2017, 46, 13720–13730 RSC.
- G. George, S. L. Jackson, C. Q. Luo, D. Fang, D. Luo, D. L. Hu, J. G. Wen and Z. P. Luo, Ceram. Int., 2018, 44, 21982–21992 CrossRef CAS.
- Y. Liu, Z. B. Wang, Y. J. Zhong, X. M. Xu, J. P. M. Veder, M. R. Rowles, M. Saunders, R. Ran and Z. P. Shao, Chem. Eng. J., 2020, 390 Search PubMed.
- P. Tan, M. L. Liu, Z. P. Shao and M. Ni, Adv. Energy Mater., 2017, 7 Search PubMed.
- L. Kong, X. Chen, B. Q. Li, H. J. Peng, J. Q. Huang, J. Xie and Q. Zhang, Adv. Mater., 2018, 30 Search PubMed.
- F. F. Jia, H. Zhong, W. G. Zhang, X. R. Li, G. Y. Wang, J. Song, Z. P. Cheng, J. Z. Yin and L. P. Guo, Sens. Actuators, B, 2015, 212, 174–182 CrossRef CAS.
- J. He, J. Sunarso, Y. Zhu, Y. Zhong, J. Miao, W. Zhou and Z. Shao, Sens. Actuators, B, 2017, 244, 482–491 CrossRef CAS.
- K. Y. Wang, J. Z. Song, X. J. Duan, J. S. Mu and Y. Wang, New J. Chem., 2017, 41, 8554–8560 RSC.
- G. George, S. R. Ede and Z. Luo, Fundamentals of Perovskite Oxides: Synthesis, Structure, Properties and Applications, CRC Press, 2020 Search PubMed.
- S. R. Ede, C. N. Collins, C. D. Posada, G. George, H. Wu, W. D. Ratcliff, Y. Lin, J. Wen, S. Han and Z. Luo, ACS Catal., 2021, 11, 4327–4337 CrossRef CAS.
- Y. Wang, Y. Xu, L. Luo, Y. Ding and X. Liu, J. Electroanal. Chem., 2010, 642, 35–40 CrossRef CAS.
- Q. Dong, H. Ryu and Y. Lei, Electrochim. Acta, 2021, 370, 137744 CrossRef CAS.
- M. H. Hassan, C. Vyas, P. Bartolo and B. Grieve, Sensors, 2021, 21 Search PubMed.
- M. Wei, Y. Qiao, H. Zhao, J. Liang, T. Li, Y. Luo, S. Lu, X. Shi, W. Lu and X. Sun, Chem. Commun., 2020, 56, 14553–14569 RSC.
- R. Wilson and A. P. F. Turner, Biosens. Bioelectron., 1992, 7, 165–185 CrossRef CAS.
- N. J. Ronkainen, H. B. Halsall and W. R. Heineman, Chem. Soc. Rev., 2010, 39, 1747–1763 RSC.
- Y. Wang, Y. Xu, L. Luo, Y. Ding, X. Liu and A. Huang, Sens. Actuators, B, 2010, 151, 65–70 CrossRef CAS.
- E. H. El-Ads, A. Galal and N. F. Atta, J. Electroanal. Chem., 2015, 749, 42–52 CrossRef CAS.
- E. H. El-Ads, A. Galal and N. F. Atta, RSC Adv., 2016, 6, 16183–16196 RSC.
- M. Sivakumar, K. Pandi, S.-M. Chen, Y.-H. Cheng and M. Sakthivel, New J. Chem., 2017, 41, 11201–11207 RSC.
- N. F. Atta, A. Galal and E. H. El-Ads, J. Electroanal. Chem., 2019, 852, 113523 CrossRef CAS.
- I. Boubezari, A. Zazoua, F. Bessueille, A. Errachid and N. Jaffrezic-Renault, Electroanalysis, 2020, 32, 1642–1650 CrossRef CAS.
- T.-W. Chen, R. Ramachandran, S.-M. Chen, G. Anushya and K. Ramachandran, Sensors, 2020, 20, 6755 CrossRef CAS.
- A. Senthamizhan, B. Balusamy and T. Uyar, Anal. Bioanal. Chem., 2016, 408, 1285–1306 CrossRef CAS PubMed.
- K. Puttananjegowda, A. Taksi and S. Thomas, J. Electrochem. Soc., 2020, 167, 37553 CrossRef CAS.
- C. Peniche, D. Zaldivar, M. Pazos, S. Paz, A. Bulay and J. S. Roman, J. Appl. Polym. Sci., 1993, 50, 485–493 CrossRef CAS.
- G. George and S. Anandhan, J. Sol-Gel Sci. Technol., 2013, 67, 256–266 CrossRef CAS.
- S. Berchmans, H. Gomathi and G. P. Rao, J. Electroanal. Chem., 1995, 394, 267–270 CrossRef.
- D.-W. Hwang, S. Lee, M. Seo and T. D. Chung, Anal. Chim. Acta, 2018, 1033, 1–34 CrossRef CAS PubMed.
- D. Chen, S. Wang, M. Liu, J. Gao, H. Song and S. Zhang, J. Electrochem. Soc., 2019, 166, B1653–B1659 CrossRef CAS.
- M. A. Yassin, B. K. Shrestha, R. Ahmad, S. Shrestha, C. H. Park and C. S. Kim, J. Ind. Eng. Chem., 2019, 73, 106–117 CrossRef CAS.
- S. Shendelman, A. Jonason, C. Martinat, T. Leete and A. Abeliovich, PLoS Biol., 2004, 2, 1764–1773 CrossRef CAS.
- Y. Shu, B. Li, J. Chen, Q. Xu, H. Pang and X. Hu, ACS Appl. Mater. Interfaces, 2018, 10, 2360–2367 CrossRef CAS PubMed.
- V. E. Coyle, A. E. Kandjani, M. R. Field, P. Hartley, M. Chen, Y. M. Sabri and S. K. Bhargava, Biosens. Bioelectron., 2019, 141, 111479 CrossRef CAS.
- V. B. Juska and M. E. Pemble, Sensors, 2020, 20, 6013 CrossRef CAS.
- D. Lin, S. W. Yang, C. L. Hsieh, K. J. Hsu, T. X. Gong, Q. Wu, S. F. Qiu, S. Y. Feng and K. V. Kong, ACS Sens., 2021, 6, 1240–1247 CrossRef CAS PubMed.
- J. Tkac, P. Gemeiner, J. Svitel, T. Benikovsky, E. Sturdik, V. Vala, L. Petrus and E. Hrabarova, Anal. Chim. Acta, 2000, 420, 1–7 CrossRef CAS.
- Y. Sun, S. Han, X. Song and H. Sun, Fenxi Yiqi, 1997, 12–15 Search PubMed.
- X. Song, S. L. Navarro, P. Diep, W. K. Thomas, E. C. Razmpoosh, Y. Schwarz, C. Y. Wang, M. Kratz, M. L. Neuhouser and J. W. Lampe, Nutr. Res., 2013, 33, 696–703 CrossRef CAS PubMed.
Footnotes |
| † Electronic supplementary information (ESI) available: Data shows influence of calcination temperature on sensor sensitivity, SEM images of different La–Sr–Co–Ni–O composites, and dataanalysis for a urine sample. See DOI: 10.1039/d1ma00984b |
| ‡ These authors contribute equally to this work. |
| § Present addresses: KDP-School of Osteopathic Medicine (CUSOM), Campbell University, Lillington, NC 27546, USA; GG-SCMS School of Engineering and Technology, Palissery, Karukutty, Kochi, Kerala 683576, India. |
| This journal is © The Royal Society of Chemistry 2022 |

