 Open Access Article
Creative Commons Attribution 3.0 Unported Licence
Sodium diffusion and dynamics in Na2Ti3O7: neutron scattering and ab initio simulations†
Ranjan
Mittal
 *ab,
Sajan
Kumar
ab,
Mayanak K.
Gupta
 *ab,
Sanjay K.
Mishra
ab,
Sanghamitra
Mukhopadhyay
 c,
Manh
Duc Le
c,
Rakesh
Shukla
d,
Srungarpu N.
Achary
c,
Manh
Duc Le
c,
Rakesh
Shukla
d,
Srungarpu N.
Achary
 bd,
Avesh K.
Tyagi
 bd and
Samrath L.
Chaplot
 ab
ab
aSolid State Physics Division, Bhabha Atomic Research Centre, Mumbai, 400085, India. E-mail: rmittal@barc.gov.in; mayankg@barc.gov.in
bHomi Bhabha National Institute, Anushaktinagar, Mumbai, 400094, India
cISIS Neutron and Muon Facility, Rutherford Appleton Laboratory, Chilton, Didcot, Oxon OX11 0QX, UK
dChemistry Division, Bhabha Atomic Research Centre, Mumbai, 400085, India
First published on 7th January 2022
Abstract
We have performed quasielastic and inelastic neutron scattering (QENS and INS) measurements from 300 K to 1173 K to investigate the Na-diffusion and underlying host dynamics in Na2Ti3O7. The QENS and INS measurements were analyzed using ab initio molecular dynamics (AIMD) simulations. From these measurements and simulations, we interpreted that at 1173 K, the diffusion of Na is controlled by the localized jumping motion of Na, while at higher temperature (1800 K) AIMD simulations predicted a long range 1-d diffusion of Na through interstitial sites along the crystallographic a-axis. Furthermore, calculations using the nudged-elastic-band (NEB) method confirmed the lowest activation energy barrier for Na diffusion along the a-axis. In the experimental phonon spectra, the peaks at 10 and 14 meV were dominated by Na dynamics at low temperature, which disappeared on warming, suggesting that low-energy phonons significantly contribute to large Na vibrational amplitude at elevated temperatures that enhance the Na hopping probability. To provide a microscopic understanding of the thermal expansion behaviour and to correlate that with Na dynamics, we have also calculated the mode Grüneisen parameters of the phonons. From this investigation, we have identified that the Na-dominated low-frequency anharmonic phonons strongly contribute to the thermal expansion.
I. Introduction
Research on metal ion batteries is progressively helping to make lighter, faster charging, safer, more stable, and more cost-effective batteries.1,2 Most commercial rechargeable cells are lithium-based and dominate the portable electronics sector due to their high energy density.3,4 However, the production of these cells may not be profitable in the long run due to the limited resources of lithium. Sodium is one of the most abundant5 elements (2.8% of elements in the Earth's crust) existing on Earth. Recently Na-based batteries have become popular for the next generation. The energy density of sodium-ion batteries is some 30% lower6 than that of lithium-ion batteries. However, they can be used for applications where energy density requirements are not as stringent,7 and may be commercially viable.8–12 The first sodium–sulfur battery was developed after the discovery of the high-temperature ionic conductor β-alumina, NaAl11O17.13 Since then, many Na-ion conductors have been discovered,14–17 including the sulfide compounds18–20 that exhibit very high ionic conductivity suitable for application in batteries. The stability, safety, and performance of these materials are related to their thermodynamic and transport behavior (such as their thermal expansion, phase transitions, electronic and ionic conductivity21).It is important to know the possible mechanism of diffusion and the associated attributes. This information would be helpful to design materials with optimum ionic transport properties. Furthermore, atomic dynamics investigations provide the critical features of diffusion and thermodynamical stability of the material. Hence, it is highly desirable to have an intensive microscopic understanding of the atomic level dynamics.22,23
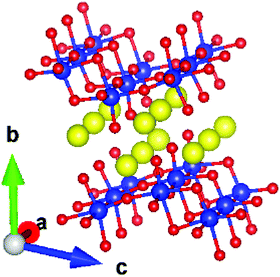
Oxide-based metal-ion conductors have attracted attention1,2 due to their easy synthesis, low cost, and high stability in variable temperature/pressure ranges. As an important material, Na2Ti3O7 has been extensively studied24–31 for its usage as an anode material. It is known to be a very promising anode compound, especially when it is mixed with carbonaceous materials.32 Apart from its usage as an anode in sodium batteries, the compound also finds applications in electrochemical devices.33,34 For example, a study on Na2Ti3O7 nanotube/Nafion composite membranes has shown33 that the addition of Na2Ti3O7 nanotubes enhanced the water uptake and reduced the methanol permeability of the composite membranes. The performance, long-term stability, and selectivity of fast potentiometric CO2-sensors consisting of an Na2Ti3O7/Na2Ti6O13 electrode have also been studied.34 Na2Ti3O7 has a layered structure (Fig. 1).35 The compound has a monoclinic structure35 with the space group P21/m (Z = 2). It has zigzag stepped layers, which are composed of edge-linked distorted TiO6 octahedra. The Na ions are intercalated between the layers formed by TiO6 octahedra, stacked along the b-axis. The Na atoms in a layer form channels along the a-axis.
A study of the ionic conductivity, thermal expansion, and structural properties of Na2Ti3O7 has been reported.36 The thermodynamic properties of Na2Ti3O7 under high temperature and high pressure have been calculated37 using DFT with the local density approximation (LDA). However, the LDA calculation is found to significantly underestimate the thermal expansion coefficient in comparison to the experimental data.36 The zone-centre phonons have also been investigated using Raman scattering and DFT simulations.38
The host-flexibility, vacancies, and interstitial sites were proposed to be the critical factors of large-ionic conductivity in recent studies on thiophosphates and Li-argyrodites.39–42 Our interest is to investigate the possible Na diffusion and influence of host dynamics in Na2Ti3O7 over a broad range of temperatures. Hence, we performed quasielastic and inelastic neutron scattering (QENS and INS) measurements covering dynamics from μeV to meV from ∼300 K to ∼1173 K. The QENS technique is mainly suitable for probing the pico-second to nano-second dynamics, typical of superionic solids and liquids. This is a unique technique because it can provide the diffusion hoping timescales and jump lengths, which are essential for the materials design aspect. The jump-length information is helpful to survey the possible pathways for migration, while residence time provides information about the shallowness of the potential energy surface along those pathways. These can be used to tune the material design to optimize the conductivity. The experimental data of the diffusion coefficient35 of ∼10−14 m2 s−1 has been reported for Na2Ti3O7 around the ambient temperature of ∼300 K. However, this is far too small43 to be accessible to the atomic scale techniques of AIMD simulations and QENS, which are good to study the diffusion coefficients of ∼10−10 m2 s−1. The INS data helps to identify the phonon modes which show significant change with temperature. Furthermore, we have performed AIMD and lattice dynamics simulations to supplement these measurements and to have microscopic details of the dynamical process. We have identified the critical influence of the interstitial site on long-range Na diffusion.
II. Experimental
Monoclinic α-Na2Ti3O7 was prepared by conventional solid-state reaction of Na2CO3 and rutile-type TiO2. TiO2 (rutile, ≥99.9%, Alfa Aesar) was heated at 1073 K for 8 h and cooled to room temperature before use. Na2CO3 (99%, Sigma-Aldrich) was heated at 373 K for 2 h and weighed immediately after cooling to room temperature. Appropriate amounts of Na2CO3 and TiO2 in the molar ratio of 2.01![[thin space (1/6-em)]](https://www.rsc.org/images/entities/char_2009.gif) :
:![[thin space (1/6-em)]](https://www.rsc.org/images/entities/char_2009.gif) 3.00 for about 10 grams of Na2Ti3O7 were mixed thoroughly using acetone as the grinding media. A slight excess (0.5 mole %) of Na2CO3 was required to compensate for the loss of Na2O at higher temperatures. The homogenous mixture was filled in an alumina crucible and heated at 773 K for 12 h. The obtained powder was homogenized and pressed into pellets of about 1-inch diameter and 1 to 1.5 cm in height. The pellets were heated at 1073 K for 24, and then crushed to powder and repelletized. These pellets were again heated at 1173 K for 12 h. This heating step was repeated three times to obtain single-phase monoclinic α-Na2Ti3O7. Each time the pellets were crushed and repelletized for the next heating. The white-colored final product was characterized by powder XRD data recorded by using Cu Kα radiation. Rietveld refinement of the structural model was performed. All the observed peaks and intensities could be accounted for44 by the monoclinic Na2Ti3O7 (Fig. S1, ESI†
3.00 for about 10 grams of Na2Ti3O7 were mixed thoroughly using acetone as the grinding media. A slight excess (0.5 mole %) of Na2CO3 was required to compensate for the loss of Na2O at higher temperatures. The homogenous mixture was filled in an alumina crucible and heated at 773 K for 12 h. The obtained powder was homogenized and pressed into pellets of about 1-inch diameter and 1 to 1.5 cm in height. The pellets were heated at 1073 K for 24, and then crushed to powder and repelletized. These pellets were again heated at 1173 K for 12 h. This heating step was repeated three times to obtain single-phase monoclinic α-Na2Ti3O7. Each time the pellets were crushed and repelletized for the next heating. The white-colored final product was characterized by powder XRD data recorded by using Cu Kα radiation. Rietveld refinement of the structural model was performed. All the observed peaks and intensities could be accounted for44 by the monoclinic Na2Ti3O7 (Fig. S1, ESI†![[thin space (1/6-em)]](https://www.rsc.org/images/entities/char_2009.gif) 45). The refined structural details are summarized in Table S1 ESI†
45). The refined structural details are summarized in Table S1 ESI†![[thin space (1/6-em)]](https://www.rsc.org/images/entities/char_2009.gif) 45), which confirms the good sample quality in terms of phase purity and crystallinity. The Na2Ti3O7 sample is stable in normal atmospheric conditions and does not show sensitivity to air.
45), which confirms the good sample quality in terms of phase purity and crystallinity. The Na2Ti3O7 sample is stable in normal atmospheric conditions and does not show sensitivity to air.
As shown in Fig. 1, Na2Ti3O7 has a layered structure. The Na ions are intercalated between the layers formed by TiO6 octahedra, stacked along the b-axis. The diffusion of Na ions is restricted within the intercalated layer, which would lead to a significant broadening in the elastic neutron scattering signal. In QENS techniques, we measure the elastic broadening at different momentum transfer Q values, which is further used to determine the nature of diffusion. The measurement of QENS spectra has been done using the OSIRIS46–49 indirect geometry time of flight spectrometer at ISIS. The QENS spectra have been measured at several temperatures from 300 K to 1173 K. In these experiments, the sample was heated under vacuum in a thin niobium cylindrical cell. We have also measured data from the vanadium standard for the normalization of detector efficiencies and the measurement of the energy resolution of the instrument. The measured data on vanadium with a fixed final energy of 1.84 meV with pyrolytic graphite (002) analyzers was fitted to a Gaussian function. The full width at half maximum (FWHM) of Gaussian was found to be 27 μeV, which is the resolution of OSIRIS. The analysis of data has been performed using the QENS data analysis interface as implemented in Mantid.50,51 In the case of Na2Ti3O7, the constituent atoms scatter coherently as well as incoherently (the neutron scattering cross-sections are, Na: σcoh= 1.66 barn, σinch = 1.62 barn; Ti: σcoh= 1.485 barn, σinch = 2.87 barn; and O: σcoh = 4.232 barn, σinch = 0.0 barn). Thus it can be noted that sodium has nearly identical coherent and incoherent cross sections.52
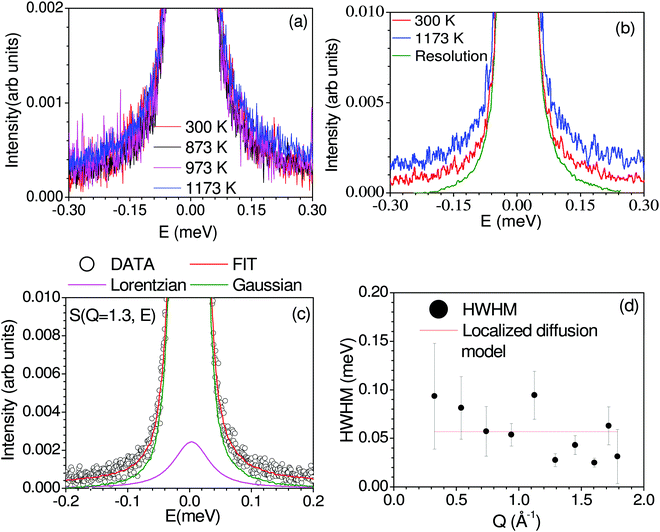
The measured neutron scattering intensity is described by the scattering function S(Q, E), where E and Q are the energy transfer and momentum transfer vector, respectively. The fitting of the QENS measured S(Q, E) data at various Q within the dynamic range of the OSIRIS instrument is carried out with one Lorentzian peak and one delta function convoluted with the resolution function of the instrument. The Q-dependence of the half-width-at-half-maximum (HWHM) of the Lorentzian peak provides43 direct information about diffusion characteristics.53,54 For localized diffusion, the HWHM is nearly constant with Q, while for long-range diffusion, the HWHM in the low Q regime is characterized by a Q2 dependence, and the Q-dependent HWHM data can be analyzed with jump-diffusion models, such as the Chudley–Elliott (C–E)55 model, and the Hall and Ross (H–R) model.43,56 None of the above models are applicable in the present case, as there is no long-range diffusion (absence of Q2 dependence of HWHM at low-Q); hence, the present case is described by the localized diffusion model. The QENS window used in this experiment on the OSIRIS spectrometer at ISIS is −0.5 to 0.5 meV with a pyrolytic graphite (002) analyzer, corresponding to a residence time of ∼10 ps to 100 ps. The Q-range of 0.2–1.8 Å−1 is usually adequate to capture typical jump lengths of a few Å.
The temperature dependence of the phonon density of states in Na2Ti3O7 was measured57 using the MARI time of flight direct geometry spectrometer at ISIS, UK. The polycrystalline sample of Na2Ti3O7 was kept in a glass tube of about 10 mm inner diameter. Measurements were carried out at several temperatures from 323 K to 1073 K. The INS measurements were carried out in the energy-loss mode with incident neutron energies of 180 meV and 30 meV. The entire one-phonon spectrum of our sample is accessible by the instrument with the incident energy of 180 meV. The INS measurements with 180 meV and 30 meV have enabled the collection of data in the Q range from 4 to 16 Å−1 and 2 to 7 Å−1, respectively. The two incident energies were used to measure phonon spectra with a reasonable resolution. The data analysis was carried out using Mantid50,51 software in the incoherent one-phonon approximation. This is a reasonable approximation57 since the Q-range of the INS data comprises several Brillouin zones. The INS measured scattering function S(Q, E) is related58–60 to the neutron-weighted phonon density of states g(n)(E) as follows:
 | (1) |
![[thin space (1/6-em)]](https://www.rsc.org/images/entities/char_2009.gif) 〉 represents a suitable average over all Q values at a given energy. 2W(Q) is the Debye–Waller factor. Usually, the same Debye–Waller factor is assumed for all the atoms, but that assumption is not good if different atoms have very different values of mean-squared displacements. In the present case, the Na atom has a much larger vibrational amplitude than the Ti and O atoms, so we have omitted the Debye–Waller factor in eqn (1) and explicitly retained it in the theoretical calculation of g(n)(E) as follows:
〉 represents a suitable average over all Q values at a given energy. 2W(Q) is the Debye–Waller factor. Usually, the same Debye–Waller factor is assumed for all the atoms, but that assumption is not good if different atoms have very different values of mean-squared displacements. In the present case, the Na atom has a much larger vibrational amplitude than the Ti and O atoms, so we have omitted the Debye–Waller factor in eqn (1) and explicitly retained it in the theoretical calculation of g(n)(E) as follows: | (2) |
 in the units of barns/amu for O, Na, and Ti atoms are 0.2645, 0.1427, and 0.0909, respectively. The values of neutron scattering lengths for various atoms can be found from ref. 52. As the experimental data analysis assumes a global Debye–Waller factor, this may result in a difference in heights of various peaks in the calculated and experimental phonon spectra.
III. Computational details
The lattice dynamics and molecular dynamics simulations were performed within the density functional theory framework implemented in the Vienna Ab initio Simulation Package (VASP). The calculations are performed using the projector augmented wave (PAW) formalism and with the generalized gradient approximation61,62 (GGA) exchange–correlation functional parameterization by Perdew, Burke, and Ernzerhof. For lattice dynamics calculations, a k-point mesh of 8 × 4 × 4 generated using the Monkhorst–Pack method63 is used to sample the Brillouin zone. The plane-wave kinetic energy cutoff of 1000 eV is used. The electronic self-consistency convergence criteria for electronic minimization and ionic forces were set to 10−8 eV and 10−3 eV Å−1, respectively. The phonon calculations were performed using a supercell approach implemented in PHONOPY software.64 A 3 × 2 × 2 supercell with 0.01 Å displacement was used to derive the force-constant matrix for subsequent phonon calculations.For ab initio molecular dynamics (AIMD) simulation, we used a 3 × 2 × 2 supercell of the monoclinic unit cell of Na2Ti3O7. To see the effect of vacancy in the host lattice, we randomly introduced one Na vacancy among 48 Na sites in the 3 × 2× 2 supercell. During the diffusion process, the vacancy also migrates to different sites, and hence the choice of the initial vacancy site is not relevant. We used an energy cutoff of 1000 eV. AIMD calculations are computationally expensive;53,65 hence we have taken only the Gamma k-point in the Brillouin zone for total energy calculations, and the energy convergence criteria for electronic minimization was 10−6 eV. The calculations are performed at 300 K, 1000 K, 1500 K, and 1800 K using an NVT ensemble. The temperature is controlled using a Nose–Hover thermostat.66 The AIMD simulations were performed with a 2 fs step size for ∼60 ps, where the initial 5 ps data was used for equilibration, and the rest of the trajectory was utilized for the production run. At 1000 K, longer simulations (100 ps) have been done. The mean-squared displacement (MSD, 〈u2〉) of various atoms as a function of time is obtained from the AIMD simulations.67,68
We have calculated the thermal expansion behavior in the quasiharmonic approximation.65 The thermal expansion is the sum of contributions from phonon modes in the entire Brillouin zone.65,69,70 In the quasiharmonic approximation, the volume thermal expansion coefficient of a crystalline material is given by the following relation:
 | (3) |
The volume dependence of the phonon frequency gives the mode Grüneisen parameter
 | (4) |
IV. Results and discussion
A. Na Diffusion, QENS measurements, and AIMD simulations
Fig. 2 shows the measured dynamical neutron scattering function S(Q, E) of Na2Ti3O7 summed over all the Q from 300 K to 1173 K, which shows that a significant QENS signal is visible only at 1173 K, indicating the onset of diffusion in the sample. In Fig. 2(c) and Fig. S2 (ESI†![[thin space (1/6-em)]](https://www.rsc.org/images/entities/char_2009.gif) 45), we have shown measured S(Q, E) at 1173 K. A few Bragg peaks will enter into the window covered by Osiris, complicating the analysis. We have carefully analyzed the raw data and removed the detectors contaminated by Bragg peaks. The Q-dependence of the HWHM of the fitted Lorentzian peaks at 1173 K is shown in Fig. 2(d). The HWHM does not show much variation with Q, indicating localized dynamics. Hence, we estimated the time scale of this localized motion by fitting a straight line to HWHM (Fig. 2), and obtained an estimated ħ/τ ∼ 0.06 ± 0.01 meV (τ ∼ 11 ± 2 ps). As the QENS signal is weak, it is difficult to extract the elastic incoherent structure factor (EISF) due to the presence of significant coherent scattering. To supplement the QENS measurement, we performed the S(Q, E) calculation43 using AIMD trajectories and estimated the coherent and incoherent contribution of Na dynamics to QENS spectra (Fig. S5, ESI†
45), we have shown measured S(Q, E) at 1173 K. A few Bragg peaks will enter into the window covered by Osiris, complicating the analysis. We have carefully analyzed the raw data and removed the detectors contaminated by Bragg peaks. The Q-dependence of the HWHM of the fitted Lorentzian peaks at 1173 K is shown in Fig. 2(d). The HWHM does not show much variation with Q, indicating localized dynamics. Hence, we estimated the time scale of this localized motion by fitting a straight line to HWHM (Fig. 2), and obtained an estimated ħ/τ ∼ 0.06 ± 0.01 meV (τ ∼ 11 ± 2 ps). As the QENS signal is weak, it is difficult to extract the elastic incoherent structure factor (EISF) due to the presence of significant coherent scattering. To supplement the QENS measurement, we performed the S(Q, E) calculation43 using AIMD trajectories and estimated the coherent and incoherent contribution of Na dynamics to QENS spectra (Fig. S5, ESI†![[thin space (1/6-em)]](https://www.rsc.org/images/entities/char_2009.gif) 45), and identified that the coherent contribution to QENS is insignificant. As discussed below, the calculated mean-squared amplitude of various atoms shows that other elements do not contribute to QENS. This localized nature of diffusion observed from QENS nicely agrees with the AIMD simulated Na trajectories, which also infers the localized diffusion of Na, as discussed in the next section.
45), and identified that the coherent contribution to QENS is insignificant. As discussed below, the calculated mean-squared amplitude of various atoms shows that other elements do not contribute to QENS. This localized nature of diffusion observed from QENS nicely agrees with the AIMD simulated Na trajectories, which also infers the localized diffusion of Na, as discussed in the next section.
We have performed AIMD simulation to investigate the possible pathways for diffusion and investigate the influence of host dynamics on Na-jumps. The AIMD simulations (∼50 ps) in the perfect crystalline phase do not show any signs of diffusion up to 1500 K, indicating the perfect crystalline phase is unlikely or not suitable for Na- diffusion. It is known that vacancies and defects enhance the diffusion behavior.71–73 The available diffraction data do not identify the very low occupancies of any interstitial sites. So, we have included a typical about 2% Na vacancy in our AIMD simulation that is found useful to initiate the diffusion of Na atoms in our simulations and also help to identify the interstitial sites. We have not considered a higher concentration of vacancies. The interstitial sites get occupied during the diffusion process, as observed in the AIMD simulations. So, it is not required to introduce Na at the interstitial sites at the start of the AIMD simulations. The calculated MSD of atoms in the structure with one vacancy in the supercell is shown in Fig. 3(a). We have also calculated the anisotropic components of MSD along the Cartesian directions (Fig. S7, ESI†![[thin space (1/6-em)]](https://www.rsc.org/images/entities/char_2009.gif) 45). The component of 〈u2〉 for Na is largest along the a-axis (x-direction), and it shows an increase with time indicating diffusion, while that along the b-axis (y-direction) is almost constant with time, indicating no diffusion. From our AIMD simulations on other similar compounds53 (NaAlSiO4), we estimate the statistical errors in MSD of ∼30%. Therefore, we have only used the calculated MSD in Fig. 3 to qualitatively understand the nature of diffusion of Na.
45). The component of 〈u2〉 for Na is largest along the a-axis (x-direction), and it shows an increase with time indicating diffusion, while that along the b-axis (y-direction) is almost constant with time, indicating no diffusion. From our AIMD simulations on other similar compounds53 (NaAlSiO4), we estimate the statistical errors in MSD of ∼30%. Therefore, we have only used the calculated MSD in Fig. 3 to qualitatively understand the nature of diffusion of Na.
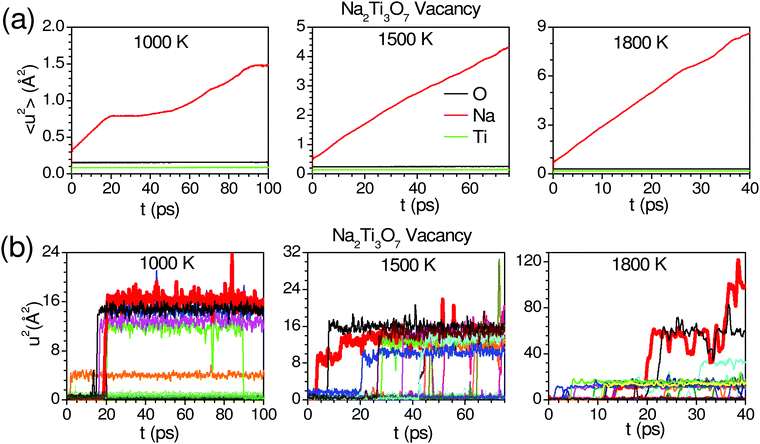 | ||
| Fig. 3 (a) Time-dependent mean-squared displacements (MSD; 〈u2〉 = 〈ux2〉 + 〈uy2〉 + 〈uz2〉, for various atoms in Na2Ti3O7 with one Na vacancy in a (3 × 2 × 2) supercell. (b) The calculated u2 of individual Na atoms is represented by different colors. The 3-d trajectories of selected Na atoms (marked by a thick red line) are shown in Fig. 4. | ||
In AIMD simulations of diffusion processes, due to limited computational resources,74 we are constrained to employ a small simulation cell and perform the simulation for a short duration. Therefore, one often chooses higher temperatures than the experimental temperatures that enhance the diffusion probability. In our sample, the experimental observation of localized diffusion above ∼873 K is simulated on a 288 atoms cell at above ∼1000 K. The long-ranged diffusion is simulated at a higher temperature above ∼1500 K. The experimental observation of localized diffusion up to 1173 K is well supported by our AIMD simulations. By observing the individual squared displacement of Na atoms (Fig. 3(b)) at 1000 K, we observed Na jumps by ∼3.5 Å. At 1500 K, we find that Na atoms show jumps by ∼3 to 4 Å and a residence time of >40 ps (Fig. 3(b)). The residence time reduces at higher temperatures. We find that at 1000 K and 1500 K, the Na atom jumps between neighboring sites. However, the jumps are very few in our simulation up to 100 ps. The simulated residence time is larger than ∼11 ps observed in the QENS experiment at 1173 K. The residence time as found in the AIMD simulations on a small supercell may only be viewed qualitatively, as has also been found in the previous studies.53 At 1800 K, Na ions show several intra-channel jumps along the a-axis, reflecting the long-range diffusion along the a-axis. The nature of the jumps is clearly seen in Fig. 4, which shows the calculated trajectories of selected Na atoms, as well as 2-dimensional projections of the trajectories.
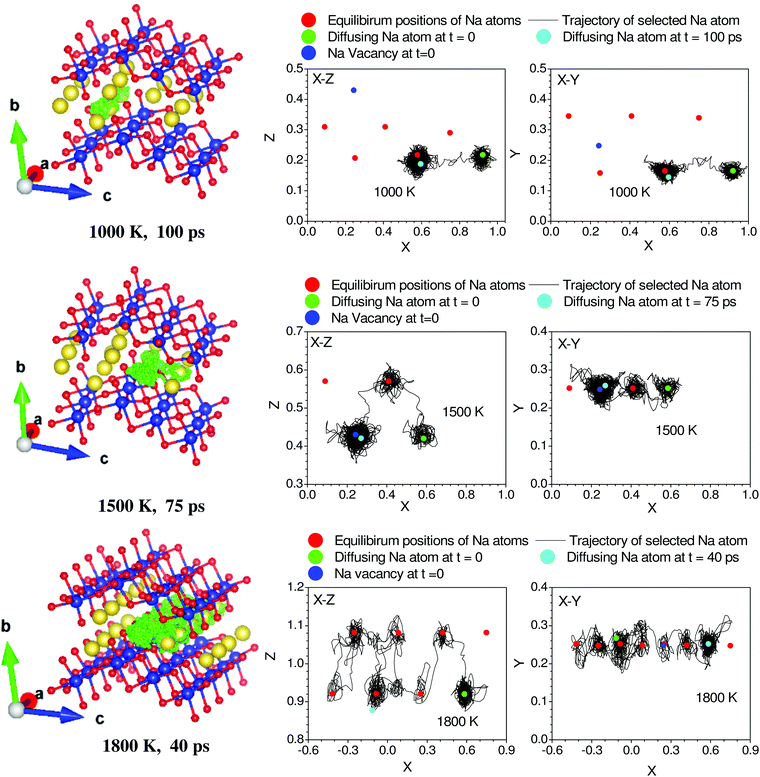 | ||
| Fig. 4 Trajectory of selected diffusing Na atoms in Na2Ti3O7 at 1000, 1500 and 1800 K. Red, yellow and blue spheres represent O, Na and Ti atoms respectively at their lattice sites. The time-dependent positions of the selected Na atoms are shown by green colored dots. The numbers below each frame indicate the temperature of the simulation and duration of the trajectory of Na. For clarity we have shown a zoomed in version of a part of the 3 × 2 × 2 supercell to highlight the path of the Na atom. The u2 of the selected Na atoms in Fig. 3 is shown with thick solid lines. The 2-dimensional projections of the trajectory in the X–Z and X–Y planes are also shown for each of the trajectories. The fractional co-ordinates (x, y, z) are shown with respect to the 3 × 2 × 2 supercell. | ||
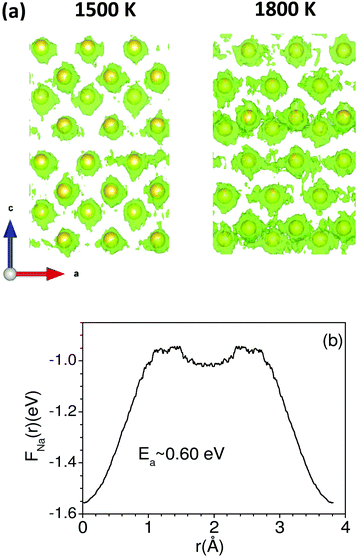
Up to 1500 K, we observe isolated events that involve cooperative jumps of a few atoms to the neighboring regular atomic positions. We note that the probability of cooperative jumps involving simultaneous jumps of several atoms would be rather small compared to independent individual atomic jumps. Indeed, the interstitial sites do get populated at high temperatures that enable diffusion. Individual jumps are not feasible in the absence of regular vacant positions or low-energy interstitial positions. At higher temperatures, when sufficient kinetic energy is available, it may be possible to observe individual jumps, where the jumping atoms halt (Fig. 4) for a short while at interstitial positions. Indeed, at 1800 K, this interstitial occupancy is observed, and atoms are found to undergo several jumps, leading to long-range diffusion. We note that the jumping atoms halt (Fig. 4) for a short while at the interstitial position, and the halting time, as well as the total jump time, are much smaller than the residence time. Therefore, this may be considered as a single jump. The calculated Na occupation probability density iso-surface plot at 1500 K (Fig. 5) does not show significant probability at the interstitial sites, while at 1800 K, there are jumps at the interstitial positions, enabling the long-range diffusion.
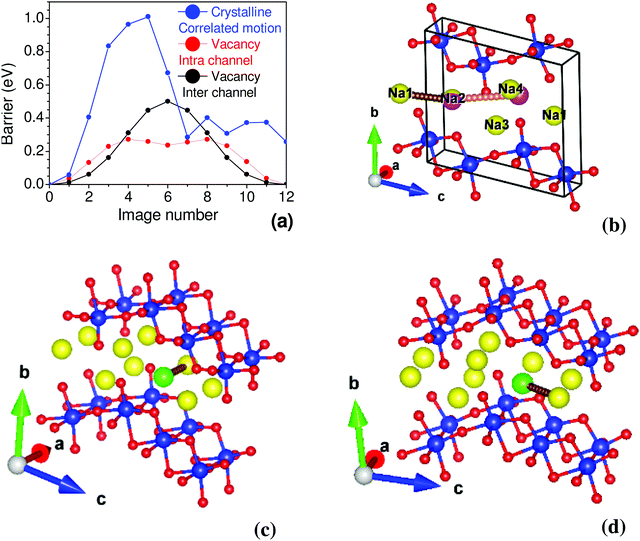
The nudged elastic band (NEB) method is used to determine the activation energy barrier between two energy minima.75 In the perfect crystalline case, we estimated the energy barrier by moving two Na atoms simultaneously, as shown in Fig. 6, finding an energy barrier of 1.0 eV. We have also computed the activation barrier for the vacancy structure. The barrier energy profile for intra-channel and inter-channel jumps are 0.27 eV and 0.5 eV, respectively (Fig. 6). Interestingly, we observe a much smaller barrier for intra-channel diffusion than inter-channel diffusion. An energy barrier ∼0.34 eV is estimated from conductivity measurements (297 K to 324 K),35 which shows a fair agreement with our calculated barrier energy in Na-vacancy. It is also important to mention that the conductivity measurements give effective barrier energy from both intra- and inter-channel jump processes. To further investigate the differences in intra- and inter-channel, we have analyzed the intermediate NEB images. We found that the inter-channel Na hopping involves the rotation of neighboring Ti–O bonds by ∼ 3°–7°, which results in an angular distortion of the neighboring TiO6 octahedron, while an intra-channel jump has the least effect on neighboring TiO6. We note that a relatively firm 2-d layered structure costs significantly to rotate the TiO6 units and, in turn, leads to a larger barrier energy.
We have used the GGA-PBE functional for NEB calculation; the estimated barrier energy for Na migrations qualitatively explains the easy direction of migrations. Although a more accurate calculation of barrier energy based on a hybrid functional and with a different basis set may provide better estimates,76,77 the qualitative understanding of the physics of diffusion behaviour would not change. It is also important to note that hybrid calculations are very expensive, in particular with a relatively larger number of atoms.
The barrier energy for the vacancy structure between two nearest Na-sites along the a-axis has also been calculated from the free-energy landscape of the Na ion (FNa(r)) at 1800 K using the following relation:78
| FNa(r)= −kBT ln (PNa(r)) |
Soft bond valence sum analysis79 based on structure data has been successfully used to explore the diffusion pathways in many systems as an initial guess and may sometimes accurately predict pathways.80,81 In order to search for other possibilities and supplement the AIMD predictions, we have performed soft bond valence sum analysis using the structural data from ref. 35. The contribution of individual Na sites to the Na-ion conduction has been estimated by performing bond valence energy landscape (BVEL) map analysis implemented in FULLPROF software82 (Fig. 7). For the BVEL map, we have chosen an iso-energy surface of 0.34 eV, which corresponds to an experimentally estimated barrier energy35 from conductivity measurements. We have also taken a different cutoff level of 0.2 eV (Fig. 7). We find that for the lower 0.2 eV cutoff, the Na atoms are mobile along the a-axis, while for the higher 0.34 eV cutoff (Fig. 7) the Na ions are mobile in the a–c plane. As noted above, due to the layered structure of the material, the conductivity along the b-axis is fully suppressed. Furthermore, BVEL analysis did not predict any other new pathways for Na diffusion, which confirms that our AIMD simulations (∼50 ps) have taken care of all possible pathways.
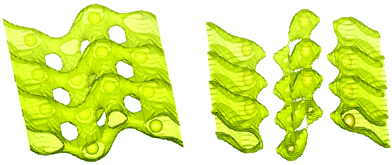 | ||
| Fig. 7 The bond valence energy landscape (BVEL) map of Na2Ti3O7 as estimated from the structural data35 at 300 K. Left and right figures correspond to the iso-energy surface of 0.34 eV and 0.20 eV, respectively. The yellow spheres show the equilibrium positions of Na. The map is shown in the a–c plane, where the a-axis is along the one-dimensional channel formed by Na atoms. | ||
B. INS measurements and lattice dynamics
The measured temperature dependence of the phonon spectra of Na2Ti3O7 from 323 K to 1023 K are shown in Fig. 8. The measurements performed with an incident energy of 180 meV provide an energy resolution of ∼7 meV, and enable the collection of data in the entire spectral range. The large incident energy has enabled the collection of data at a high momentum transfer vector Q range from 4 to 16 Å−1. However, the data collection at such large Q values would be contaminated from a large multi-phonon contribution, which has been corrected using the standard formalism as discussed in ref. 83. The data collection at large Q values (from ∼ 4 to 16 Å−1) would be contaminated from large multi-phonon contribution, which has been corrected using the standard formalism. However, it is very difficult to treat the multi-phonon contribution precisely in the experimental data due to the use of a global Debye–Waller factor. This usually leads to some intensity beyond the actual range of density of states (DOS) in measurements.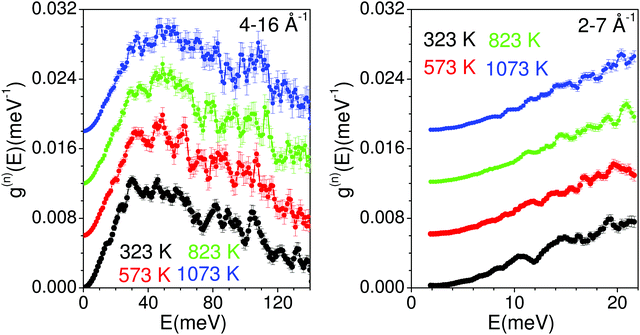 | ||
| Fig. 8 The experimentally measured neutron-weighted phonon density of states in Na2Ti3O7 at various temperatures. The multi-phonon contribution has been corrected using a standard procedure at ISIS. | ||
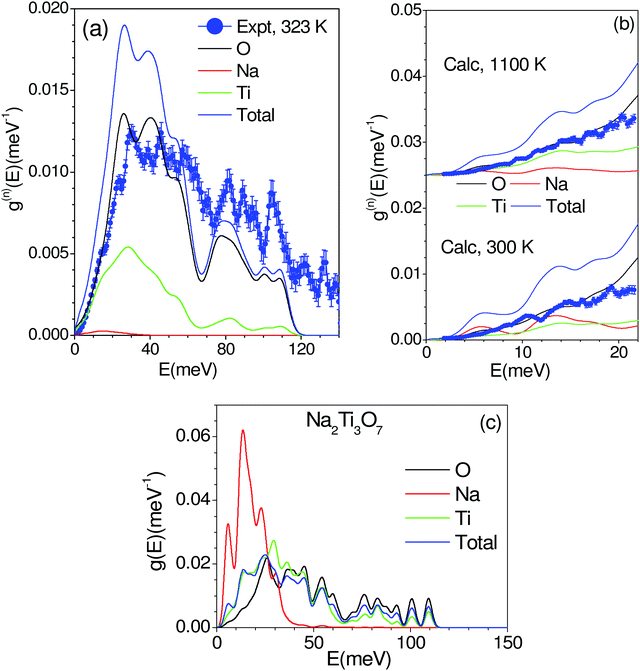
The phonon spectra measured with an incident energy of 180 meV show sharp peaks at 30 meV, 38 meV, 46 meV, 50 meV, 60 meV, 80 meV, 90 meV and 107 meV. The peak structure is gradually broadened on warming, and peaks in the DOS start merging at 823 K. To identify the individual atomic contribution in the INS spectra, we calculated the atomic-species resolved neutron-weighted DOS and compared it with the 323 K measurement (Fig. 9(a)). The calculation shows (Fig. 9(a)) that the measured neutron-weighted DOS is dominated by O-atom dynamics. Fig. 9(c) shows the total and partial density of states. The low energy spectra below 20 meV have a significant contribution from Na dynamics. Ti has a low- to mid-energy range contribution. The calculated range of phonon spectra matches very well with our experimental data and Raman measurements.38 It is interesting to note that the Na dominant contribution at low energy reflects the softer bonding of Na to the host. However, the significant overlap of Na–DOS with O- and Ti–DOS also indicates that the Na dynamics is affected by the dynamics of the host elements.
The INS spectra have also been measured with an incident neutron energy of 30 meV to probe the low energy phonons with a better energy resolution of ∼1 meV. The measurements enabled the collection of neutron spectra up to 22 meV in the Q range from 2 to 7 Å−1. The low energy spectra show that the peaks at 10, 14 and 19 meV are predominantly due to Na atoms, which get weakened and broadened with the increase in temperature (Fig. 8 and 9(b), (c)). The calculated neutron-weighted phonon density of states at 300 and 1100 K is shown in Fig. 9(b). The Na contribution in Fig. 9 is not very prominent. But still we notice that the peaks at ∼10 meV and 14 meV are largely contributed from Na dynamics at 300 K, which significantly reduce at 1100 K due to the increase in the Debye–Waller factor. Thus, the disappearance of the 10 and 14 meV peaks on warming (Fig. 7) is attributed to the large vibrational amplitude of Na at high temperatures. The increase in the vibrational amplitude of the Na atoms at high temperatures may enhance the Na hoping probability. Hence, these low-energy Na modes could play an important role in Na diffusion.
C. Calculated and experimental thermal expansion behavior
We have calculated the pressure dependence of the phonon spectrum of Na2Ti3O7 and obtained the mode Grüneisen parameters in the entire Brillouin zone. The calculated mode Grüneisen parameter Γ of phonons of energy E, averaged over the entire Brillouin zone, as a function of phonon energy (E) is shown in Fig. 10(a). It can be seen that the low-energy phonon modes below 20 meV have very large positive values of Γ up to +10. The calculated volume thermal expansion coefficient (αV) is shown in the inset of Fig. 10(a). Our calculations are found to be in excellent agreement (Fig. 10(b)) with the available experimental data from the literature.36 Previously, αV for Na2Ti3O7 has been calculated37 within the local density approximation (LDA) and found to be ∼21 × 10−6 K−1 at 1000 K, which is significantly underestimated as compared to our calculations of 44 × 10−6 K−1 at 1000 K within the generalized gradient approximation (GGA) as well as the experimental value (inset of Fig. 10(a)).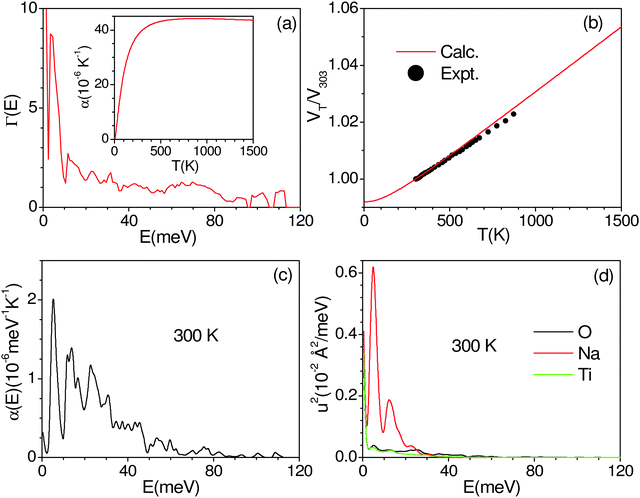 | ||
| Fig. 10 (a) The calculated mode Grüneisen parameter Γ of phonons of energy E, averaged over the entire Brillouin zone, as a function of phonon energy (E). The inset in (a) shows the calculated volume thermal expansion coefficients αV. (b) The calculated and experimental (closed symbols)36 volume thermal expansion in Na2Ti3O7. The contribution of phonon modes of energy E, averaged over the entire Brillouin zone, (c) to volume thermal expansion coefficients at 300 K, and (d) to the mean-squared amplitude of various atoms in Na2Ti3O7 at 300 K. | ||
Furthermore, we have calculated the contribution (Fig. 10(c)) to the volume thermal expansion coefficient from phonons of energy E, averaged over the entire Brillouin zone, as a function of phonon energy (E) at 300 K. We find that the phonon modes of up to 40 meV contribute the most to αV. The contribution of phonons of energy E to the mean-squared amplitude (u2) of various atoms at 300 K shows (Fig. 10(d)) that Na has very large values for phonons of an energy below 20 meV, while contributions from Ti and O are very small. The structure of Na2Ti3O7 consists of layers of distorted TiO6 octahedra, with Na ions intercalated in between the layers. The large value of u2 for phonon modes below 20 meV indicates that the large displacement of Na within a layer is mainly responsible for the large values of αV for Na2Ti3O7.
V. Conclusions
We have observed significant broadening in the QENS spectra in Na2Ti3O7 at 1173 K, and interpreted the same using AIMD simulations. The AIMD simulations show the diffusion of Na to be preferentially one-dimensional through channels along the crystallographic a-axis. The calculated activation energy barrier for the intra-channel diffusion (along the a-axis) is found to be much smaller in comparison to that for the inter-channel diffusion, which is consistent with the AIMD simulations. Furthermore, we have reported INS measurements of the phonon DOS and lattice dynamics calculations. The Na phonon modes at low energies below 20 meV are found to weaken significantly in intensity at high temperatures due to the large Na vibrational amplitudes. The volume thermal expansion coefficient has also been calculated using the quasiharmonic approximation. The low-energy Na phonon modes are found to lead to a high value of the volume thermal expansion coefficient in Na2Ti3O7.Author contributions
R. M., M. K. G. and S. L. C. formulated the problem and planned the experiments and ab initio calculations. R. M., S. L. C., S. M. and M. D. L. performed the Neutron Scattering experiments. RM, M. K. G. and S. K. performed AIMD simulations. S. K., S. K. M., M. K. G., R. M., S. M., S. L. C. and M. D. L. analysed the experimental and simulated data. R. A., S. N. A., and A. K. T. synthesized and characterized the samples. M. K. G., R. M., S. L. C. and S. K. M. wrote the manuscript, and all authors commented on it.Conflicts of interest
The authors declare no conflict of interest.Acknowledgements
The use of the ANUPAM super-computing facility at BARC is acknowledged. The authors thank the Department of Science and Technology, India (SR/NM/Z-07/2015) for the financial support and Jawaharlal Nehru Centre for Advanced Scientific Research (JNCASR) for managing the project. The authors also thank STFC, UK, for the beam-time at ISIS and also availing the travel support from the Newton fund, ISIS, UK. Experiments at the ISIS Neutron and Muon Source were supported by a beamtime allocation RB1868015 and RB1910264 from the Science and Technology Facilities Council. SLC thanks the Indian National Science Academy for the financial support of the INSA Senior Scientist position.References
- J. W. Choi and D. Aurbach, Nat. Rev. Mater., 2016, 1, 16013 CrossRef CAS.
- Y. Kato, S. Hori, T. Saito, K. Suzuki, M. Hirayama, A. Mitsui, M. Yonemura, H. Iba and R. Kanno, Nat. Energy, 2016, 1, 16030 CrossRef CAS.
- M. Wakihara, Mater. Sci. Eng., R, 2001, 33, 109–134 CrossRef.
- J. B. Goodenough, Energy Storage Mater., 2015, 1, 158–161 CrossRef.
- W. Song, X. Ji, C. Pan, Y. Zhu, Q. Chen and C. E. Banks, Phys. Chem. Chem. Phys., 2013, 15, 14357–14363 RSC.
- J.-M. Tarascon, Joule, 2020, 4, 1616–1620 CrossRef.
- B. L. Ellis and L. F. Nazar, Curr. Opin. Solid State Mater. Sci., 2012, 16, 168–177 CrossRef CAS.
- Y.-E. Zhu, X. Qi, X. Chen, X. Zhou, X. Zhang, J. Wei, Y. Hu and Z. Zhou, J. Mater. Chem. A, 2016, 4, 11103–11109 RSC.
- X. Li, S. Guo, F. Qiu, L. Wang, M. Ishida and H. Zhou, J. Mater. Chem. A, 2019, 7, 4395–4399 RSC.
- J. Alvarado, G. Barim, C. D. Quilty, E. Yi, K. J. Takeuchi, E. S. Takeuchi, A. C. Marschilok and M. M. Doeff, J. Mater. Chem. A, 2020, 8, 19917–19926 RSC.
- G. Yan, S. Mariyappan, G. Rousse, Q. Jacquet, M. Deschamps, R. David, B. Mirvaux, J. W. Freeland and J.-M. Tarascon, Nat. Commun., 2019, 10, 1–12 CrossRef PubMed.
- J. Wang, Y. Wang, D. H. Seo, T. Shi, S. Chen, Y. Tian, H. Kim and G. Ceder, Adv. Energy Mater., 2020, 10, 1903968 CrossRef CAS.
- F. Yung, Y. Yao and J. T. Kummer, J. Inorg. Nucl. Chem., 1967, 29, 2453–2475 CrossRef.
- S.-H. Bo, Y. Wang and G. Ceder, J. Mater. Chem. A, 2016, 4, 9044–9053 RSC.
- C. Yu, S. Ganapathy, N. J. J. de Klerk, E. R. H. van Eck and M. Wagemaker, J. Mater. Chem. A, 2016, 4, 15095–15105 RSC.
- S. Muy, J. C. Bachman, L. Giordano, H.-H. Chang, D. L. Abernathy, D. Bansal, O. Delaire, S. Hori, R. Kanno, F. Maglia, S. Lupart, P. Lamp and Y. Shao-Horn, Energy Environ. Sci., 2018, 11, 850–859 RSC.
- T. Krauskopf, S. Muy, S. P. Culver, S. Ohno, O. Delaire, Y. Shao-Horn and W. G. Zeier, J. Am. Chem. Soc., 2018, 140, 14464–14473 CrossRef CAS PubMed.
- A. Hayashi, K. Noi, A. Sakuda and M. Tatsumisago, Nat. Commun., 2012, 3, 856 CrossRef PubMed.
- K. Noi, A. Hayashi and M. Tatsumisago, J. Power Sources, 2014, 269, 260–265 CrossRef CAS.
- M. Guin and F. Tietz, J. Power Sources, 2015, 273, 1056–1064 CrossRef CAS.
- P. H. Jampani, O. Velikokhatnyi, K. Kadakia, D. H. Hong, S. S. Damle, J. A. Poston, A. Manivannan and P. N. Kumta, J. Mater. Chem. A, 2015, 3, 8413–8432 RSC.
- Y. Wang, W. D. Richards, S. P. Ong, L. J. Miara, J. C. Kim, Y. Mo and G. Ceder, Nat. Mater., 2015, 14, 1026 CrossRef CAS PubMed.
- Q. Wang, J. A. Jackson, Q. Ge, J. B. Hopkins, C. M. Spadaccini and N. X. Fang, Phys. Rev. Lett., 2016, 117, 175901 CrossRef PubMed.
- L. Luo, Y. Zhen, Y. Lu, K. Zhou, J. Huang, Z. Huang, S. Mathur and Z. Hong, Nanoscale, 2020, 12, 230–238 RSC.
- P. Senguttuvan, G. Rousse, V. Seznec, J.-M. Tarascon and M. R. Palacin, Chem. Mater., 2011, 23, 4109–4111 CrossRef CAS.
- Y. Cao, Q. Ye, F. Wang, X. Fan, L. Hu, F. Wang, T. Zhai and H. Li, Adv. Funct. Mater., 2020, 2003733 CrossRef.
- T. K. Saothayanun, T. T. Sirinakorn and M. Ogawa, Inorg. Chem., 2020, 59, 4024–4029 CrossRef CAS PubMed.
- M. A. Tsiamtsouri, P. K. Allan, A. J. Pell, J. M. Stratford, G. Kim, R. N. Kerber, P. C. Magusin, D. A. Jefferson and C. P. Grey, Chem. Mater., 2018, 30, 1505–1516 CrossRef CAS.
- M. Mori, Y. Kumagai, K. Matsunaga and I. Tanaka, Phys. Rev. B: Condens. Matter Mater. Phys., 2009, 79, 144117 CrossRef.
- L. Zhang, L. Chen, X. Fan, X. Xiao, J. Zheng and X. Huang, J. Mater. Chem. A, 2017, 5, 6178–6185 RSC.
- C. Wu, W. Hua, Z. Zhang, B. Zhong, Z. Yang, G. Feng, W. Xiang, Z. Wu and X. Guo, Adv. Sci., 2018, 5, 1800519 CrossRef PubMed.
- Z. Zhou, H. Xiao, F. Zhang, X. Zhang and Y. Tang, Electrochim. Acta, 2016, 211, 430–436 CrossRef CAS.
- Y. Wei, L. Shen, Z. Wang, W.-D. Yang, H. Zhu and H. Liu, Int. J. Hydrogen Energy, 2011, 36, 5088–5095 CrossRef CAS.
- M. Holzinger, J. Maier and W. Sitte, Solid State Ionics, 1996, 86, 1055–1062 CrossRef.
- Y. Fukuzumi, W. Kobayashi and Y. Moritomo, J. Adv. Nanomater., 2016, 1, 39 Search PubMed.
- M. Dynarowska, J. Kotwiński, M. Leszczynska, M. Marzantowicz and F. Krok, Solid State Ionics, 2017, 301, 35–42 CrossRef CAS.
- H. Zhang and H. Wu, Phys. Status Solidi A, 2008, 245, 37–43 CrossRef CAS.
- F. L. R. Silva, J. Raman Spectrosc., 2018, 49, 538–548 CrossRef.
- L. Zhou, A. Assoud, Q. Zhang, X. Wu and L. F. Nazar, J. Am. Chem. Soc., 2019, 141, 19002–19013 CrossRef CAS PubMed.
- B. J. Morgan, Chem. Mater., 2021, 33, 2004–2018 CrossRef CAS PubMed.
- R. Schlenker, A.-L. Hansen, A. Senyshyn, T. Zinkevich, M. Knapp, T. Hupfer, H. Ehrenberg and S. Indris, Chem. Mater., 2020, 32, 8420–8430 CrossRef CAS.
- Z. Zhu, I.-H. Chu, Z. Deng and S. P. Ong, Chem. Mater., 2015, 27, 8318–8325 CrossRef CAS.
- M. Bee, Quasi Elastic Neutron Scattering, Adam Hilger, IOP Publishing Ltd, Bristol, England, 1988 Search PubMed.
- O. Yakubovich and V. Kireev, Crystallogr. Rep., 2003, 48, 24–28 CrossRef CAS.
- See Supplementary Material for details about charcerization and experimental QENS spectra for Na2Ti3O7 at 1173 K. It also contains results from AIMD simulations and analyis of QENS spectra.
- R. Mittal and et al., Na-Dynamics in Solid Ionic Conductors: 11Al2O3-Na2O and Na2Ti3O7, STFC ISIS Neutron and Muon Source DOI:10.5286/ISIS.E.RB1910264.
- F. Demmel, D. McPhail, J. Crawford, K. Pokhilchuk, V. G. Sakai, S. Mukhopadhyay, M. T. F. Telling, F. J. Bermejo, N. T. Skippe and F. Fernandez-Alonso, Eur. Phys. J. Web Conf., 2015, 83, 03003 CrossRef.
- M. T. Telling, S. I. Campbell, D. Engberg, D. M. y. Marero and K. H. Andersen, Phys. Chem. Chem. Phys., 2016, 18, 8243 RSC.
- B. L. Vidal, E. Oram, R. A. Baños, L. C. Pardo, S. Mukhopadhyay and F. Fernandez-Alonso, J. Phys.: Conf. Ser., 2018, 1021, 012012 CrossRef.
- S. Mukhopadhyay, B. Hewer, S. Howells and A. Markvardsen, Physica B: Condensed Matter, 2019, 563, 41–49 CrossRef CAS.
- O. Arnold, J.-C. Bilheux, J. Borreguero, A. Buts, S. I. Campbell, L. Chapon, M. Doucet, N. Draper, R. F. Leal and M. Gigg, Nucl. Instrum. Methods Phys. Res., Sect. A, 2014, 764, 156–166 CrossRef CAS.
- V. F. Sears, Neutron News, 1992, 3, 26–37 CrossRef.
- M. K. Gupta, R. Mittal, S. Kumar, B. Singh, N. H. Jalarvo, O. Delaire, R. Shukla, S. N. Achary, A. I. Kolesnikov, A. K. Tyagi and S. L. Chaplot, J. Mater. Chem. A, 2021, 9, 16129–16136 RSC.
- T. Willis, D. Porter, D. Voneshen, S. Uthayakumar, F. Demmel, M. Gutmann, M. Roger, K. Refson and J. Goff, Sci. Rep., 2018, 8, 1–10 CAS.
- C. T. Chudley and R. J. Elliott, Proc. Phys. Soc., London, 1961, 77, 353–361 CrossRef.
- P. L. Hall and D. Ross, Mol. Phys., 1981, 42, 673–682 CrossRef CAS.
- M. K. Gupta, R. Mittal, S. K. Mishra, P. Goel, B. Singh, S. Rols and S. L. Chaplot, J. Phys.: Condens. Matter, 2020, 32, 505402 CrossRef CAS PubMed.
- K. Skold and D. L. Price, Neutron scattering, Academic Press, Orlando, 1986 Search PubMed.
- J. M. Carpenter and D. L. Price, Phys. Rev. Lett., 1985, 54, 441–443 CrossRef CAS PubMed.
- S. Rols, H. Jobic and H. Schober, C. R. Phys., 2007, 8, 777–788 CrossRef CAS.
- K. Burke, J. Perdew and M. Ernzerhof, Phys. Rev. Lett., 1997, 78, 1396 Search PubMed.
- J. P. Perdew, K. Burke and M. Ernzerhof, Phys. Rev. Lett., 1996, 77, 3865 CrossRef CAS PubMed.
- H. J. Monkhorst and J. D. Pack, Phys. Rev. B: Solid State, 1976, 13, 5188–5192 CrossRef.
- A. Togo and I. Tanaka, Scr. Mater., 2015, 108, 1–5 CrossRef CAS.
- B. Singh, M. K. Gupta, R. Mittal and S. L. Chaplot, J. Mater. Chem. A, 2018, 6, 5052–5064 RSC.
- S. Nosé, J. Chem. Phys., 1984, 81, 511–519 CrossRef.
- M. P. Allen and D. J. Tildesley, Computer simulation of liquids, Oxford university press, 2017 Search PubMed.
- A. K. Sagotra, D. Chu and C. Cazorla, Phys. Rev. Mater., 2019, 3, 035405 CrossRef CAS.
- R. Mittal and S. L. Chaplot, Phys. Rev. B: Condens. Matter Mater. Phys., 1999, 60, 7234–7237 CrossRef CAS.
- R. Mittal, S. L. Chaplot, H. Schober and T. A. Mary, Phys. Rev. Lett., 2001, 86, 4692–4695 CrossRef CAS PubMed.
- J. Sugiyama, K. Mukai, Y. Ikedo, H. Nozaki, M. Månsson and I. Watanabe, Phys. Rev. Lett., 2009, 103, 147601 CrossRef PubMed.
- T. Shibata, Y. Fukuzumi, W. Kobayashi and Y. Moritomo, Sci. Rep., 2015, 5, 1–4 Search PubMed.
- E. Rucavado, F. Landucci, M. Döbeli, Q. Jeangros, M. Boccard, A. Hessler-Wyser, C. Ballif and M. Morales-Masis, Phys. Rev. Mater., 2019, 3, 084608 CrossRef CAS.
- M. K. Gupta, R. Mittal, S. Kumar, B. Singh, N. H. Delaire, R. Shukla, S. N. Achary, A. I. Kolesnikov, A. K. Tyagi and S. L. J. a. p. a. Chaplot, 2021.
- G. Henkelman and H. Jónsson, J. Chem. Phys., 2000, 113, 9978–9985 CrossRef CAS.
- M. Guidon, F. Schiffmann, J. Hutter and J. VandeVondele, J. Chem. Phys., 2008, 128, 214104 CrossRef PubMed.
- S. S. R. K. C. Yamijala, Z. A. Ali and B. M. Wong, J. Phys. Chem. C, 2019, 123, 25113–25120 CrossRef CAS.
- J. Wang, J. Ding, O. Delaire and G. Arya, ACS Appl. Energy Mater., 2021, 4, 7157–7167 CrossRef CAS.
- S. Adams, Acta Crystallogr., Sect. B: Struct. Sci., 2001, 57, 278–287 CrossRef CAS PubMed.
- H. Chen, L. L. Wong and S. Adams, Acta Crystallogr., Sect. B: Struct. Sci., Cryst. Eng. Mater., 2019, 75, 18–33 CrossRef CAS PubMed.
- D. Urushihara, S. Kawaguchi, R. Harada, T. Asaka and K. Fukuda, Mater. Lett., 2020, 277, 128373 CrossRef CAS.
- J. Rodríguez-Carvajal, Phys. B, 1993, 192, 55–69 CrossRef.
- B. Fultz, T. Kelley, J. Lin, J. Lee, O. Delaire, M. Kresch, M. McKerns and M. Aivazis, Experimental inelastic neutron scattering: Introduction to DANSE, 2009.
Footnote |
| † Electronic supplementary information (ESI) available. See DOI: 10.1039/d1ma00963j |
| This journal is © The Royal Society of Chemistry 2022 |

