Phosphorus quantification in fertilizers using laser induced breakdown spectroscopy (LIBS): a methodology of analysis to correct physical matrix effects
Bruno S.
Marangoni
*a,
Kleydson S. G.
Silva
b,
Gustavo
Nicolodelli
b,
Giorgio S.
Senesi
c,
Jader S.
Cabral
d,
Paulino R.
Villas-Boas
b,
Caroline S.
Silva
e,
P. C.
Teixeira
f,
Ana Rita A.
Nogueira
e,
Vinicius M.
Benites
f and
Débora M. B. P.
Milori
b
aDepartamento de Física, Universidade Federal de São Carlos, P.O. Box 676, 13565-905, São Carlos, SP, Brazil. E-mail: marangoni@df.ufscar.br
bEmbrapa Instrumentação, P.O. Box 741, 13560-970, São Carlos, SP, Brazil
cInstitute of Inorganic Methodologies and Plasmas-CNR-Bari, 70126 Bari, Italy
dInstituto de Física, Universidade Federal de Uberlândia, P.O. Box 593, 38400-902 Uberlândia, MG, Brazil
eEmbrapa Pecuária Sudeste, P.O. Box 339, 13560-970, São Carlos, SP, Brazil
fEmbrapa Solos, Rua Jardim Botânico 1024, 22460-000, Rio de Janeiro, RJ, Brazil
First published on 7th September 2015
Abstract
The aim of this study was to develop a quantitative method to determine phosphorus in fertilizers of different matrix compositions using the laser induced breakdown spectroscopy (LIBS) technique. The LIBS spectra were acquired on 26 samples of organic and inorganic fertilizers by using a low cost, portable, gated CCD system in the atmospheric environment. Inductively coupled plasma optical emission spectroscopy (ICP-OES) was used as the reference technique. A method was developed to remove the outlier spectra and perform the baseline correction and peak normalization. By applying the proposed corrections, the linear correlation between LIBS and ICP increased from R = 0.76 to R = 0.95. An average error of 15% found in cross-validation of LIBS quantification appeared feasible for P quantification in fertilizers. Two reference samples with different matrix compositions were also analyzed, and the absolute error in the quantification was below 5%. Further, no significant fluctuation was found in P quantification when LIBS was performed over 150 days.
1 Introduction
The increase of worldwide population poses a great challenge to agriculture thereby requiring a considerable productivity enhancement in the next few years. The development of new techniques to monitor the amount of nutrients in soils and fertilizers in a rapid and non-expensive way appears to be urgent to optimize the application of fertilizers. Further, this monitoring will allow the regulatory agencies to optimize the fertilizer quality control and avoid fraud.Phosphorus (P) is one of the most important nutrients for agriculture, mainly in tropical soils. World reserves of phosphates are limited and concentrated in few countries. The exploration of these reserves has become critical and the average P concentration in industrial rocks has decreased during the last few decades.1 The use of secondary P is becoming an important strategy to save limited primary P reserves.2 New fertilizers based on organic residues and mixtures of organic and mineral sources of P is now available on the market. The use and commercialization of organic mineral fertilizers in Brazil have increased in a rapid manner during the last decade. Methods to check the nutrient content of these fertilizers considering the possible effect of organic matter interference are urgent and necessary.
As inorganic P fertilizers are usually extracted from rocks of various compositions, the P composition indicated on fertilizer packages may not be very accurate. The organic fertilizers are even less monitored, and because it is extracted from organic residues, their concentration variability is even higher. Thus, the development of a method that can monitor the amount of P in organic and inorganic fertilizers in a precise, rapid and non-expensive way may result in a great environmental and economic impact.
Over the recent years, the laser induced breakdown spectroscopy (LIBS) technique has been applied in several fields3 including soil and fertilizer analysis.4–7 The main advantage of LIBS is the capability to obtain rapid and relatively non expensive measurements with minimum sample preparation.8,9 The concentration of an element can be determined using a calibration curve or by multivariate methods,10 both of which require a reference technique. Once the model is developed and tested, LIBS can be used as a rapid analytical technique that does not require a huge computer capability. Another methodology to determine the sample elemental concentration by LIBS uses the calibration free technique5 that requires a detailed analysis of spectra and extended data processing. This method is commonly used for simple matrix samples in a semi quantitative approach. Further, portable LIBS equipment have been developed allowing rapid in situ measurements.
In particular, in the last decade LIBS methods were developed and applied successfully for real-time, on-site, on-line automated quantitative analysis of P and other relevant elements, including Si, Ca, Mg, Al, and K, in phosphate ores and potassium fertilizers.11–13 An acceptable level of precision and accuracy was achieved with 2–4% relative standard deviations for most elements,11 and the comparison of LIBS on-line data with control chemical analysis revealed good correlations.12,13 Further, real-time LIBS data of the P/Si ratio provided a simple and reliable indicator of phosphate ore rock quality.14 However, the elemental determination in fertilizers has involved samples with similar matrix compositions and no LIBS application has been performed on organic fertilizers.
The main goal of this study was to develop a LIBS analytical methodology for P quantification in organic and inorganic fertilizer samples by using equipment featuring a spectral and temporal resolution compatible with commercial portable LIBS systems for in situ measurements.
2 Materials and methods
2.1 Samples
Twenty six fertilizer samples were used in this experiment: 5 phosphate rocks (PR) (Bayovar, Arraias, Gafsa, Arad and Djabel); 3 mineral fertilizers (monoammonium phosphate (MAP), single superphosphate (SSP) and triple superphosphate (TSP)) and 18 organic mineral granulated fertilizers. The organic fertilizers were produced in laboratory scale especially for this experiment. All samples were granulated and have variable compositions (e.g. different sources of organic matter, P content, and additives such as bentonite and silicates) to create a contrasting range of characteristics normally found in commercial products.The organic fertilizers were mixtures of 60% poultry litter, in natura or composted, and 40% commercial mineral fertilizers. The samples consisted of spherical structures of approximately 2 mm diameter. To ensure homogeneity, samples were ground and sieved through a 100 mesh sieve. For LIBS analyses, two pellets of each sample were prepared by applying a pressure of 6 × 10⁸ N m−2 for 30 s.
2.2 LIBS setup
The LIBS spectra were obtained using a LIBS 2500 spectrometer (Ocean Optics, Dunedin, USA) equipped with a Q-switched 1064 nm Nd:YAG laser manufactured by Quantel (Big Sky Laser Ultra50) with a maximum energy of 60 mJ per pulse and a repetition rate of 10 Hz. The laser spot diameter on the sample inside the ablation chamber was estimated to be around 100 μm. The plasma emission was collected by using a fiber optic bundle and addressed to seven spectrometers, each of which consisted of a 2048 pixel CCD array. The experiments were conducted in air at atmospheric ambient pressure. The distance between the sample and the optical fiber bundle was approximately 7 mm. The spectra ranged from 189 to 966 nm with an optical resolution of 0.1 nm.For each pellet, 100 spectra (50 for surface side) were obtained at different positions of the sample. Each spectrum was the result of two accumulated laser shots, preceded by one for cleaning. The LIBS equipment was operated with a laser pulse of 8 ns and 60 mJ with an integration time of 2.1 ms for all measurements. The optimized delay time for P line emission was 2.5 μs.
2.3 LIBS data processing: baseline correction and spectral normalization
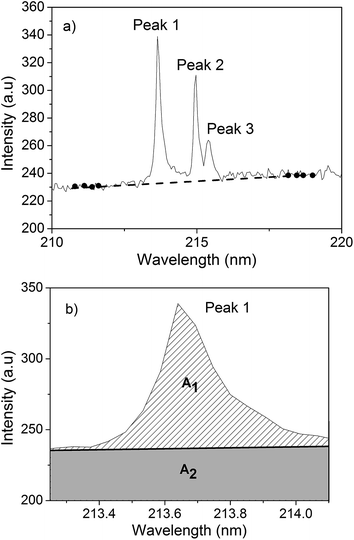
The baseline correction for LIBS spectra was performed in two steps. The first step consisted of subtracting an electronic offset from the spectra. In this case, a spectrum was obtained without a sample and laser light. The measured spectrum was then subtracted from the upcoming acquired spectrum. This procedure was necessary because the spectrometer offset changed daily. The second step consisted of correcting the added offset in the spectrum for continuum plasma emission. To do this, a line was drawn under the atomic emission peak passing through four or five not interfered points on each side of the peak. If there were no points available around the emission peak, because of the presence of other peaks, the region was broadened until a clear region was found. A linear function was then fitted (Fig. 1a), and subtracted point by point from the spectrum. The processed peak transition is shown in Fig. 1b.After the spectral correction, a Lorentzian function was fitted to the peak profile in order to obtain the area of the emission peak (A1). The same region selected to perform the Lorentzian fit was selected to limit the linear correction function (full line in Fig. 1b), and the area under this line was also calculated (A2). This latter value was then used to normalize the emission line area (Af = A1/A2). The final area value, Af, was then correlated with the reference technique measurements.
2.4 Reference technique
Inductively coupled plasma optical emission spectrometry (ICP-OES) with a radial view configuration, model OPTIMA 3000 (Perkin-Elmer), was used as a reference technique for P quantification. The ICP-OES measurements were performed on solutions obtained by digestion of 1 g of each fertilizer sample in 20 mL of nitric acid and 5 mL of chloridric acid at boiling temperature.2.5 Correlation analysis and line emission choice
The approach used for the first analytical step, i.e. the choice of an appropriate emission line for P, was to calculate the linear Pearson's correlation (R) between each spectral point and the P concentration measured by ICP-OES. Outliers spectra were previously excluded using the spectral distance technique,15 named spectral angle mapper (SAM). This method allows comparing two spectra and, based on their similarity, returns a scalar value between −1 and 1. By imposing a limit to this number, we can exclude the spectra that are not similar to the others.4 The percentage of the excluded spectra was about 2–3%. A specific point of each averaged spectrum (points having the same wavelength) was selected for each sample, thus totaling 26 intensities. Then, a linear correlation between the peak intensity and the corresponding P concentration is performed. If the intensity at this point of the spectrum varied according to the P concentration, a correlation close to 1 (R range from −1 to 1) was obtained. This procedure was repeated for each spectral point, thus enabling us to draw a correlation graph for P (Fig. 2), which indicated the spectral intensity variation as a function of the P concentration. This pre-analysis allowed speeding up the line emission identification process and making the process more reliable.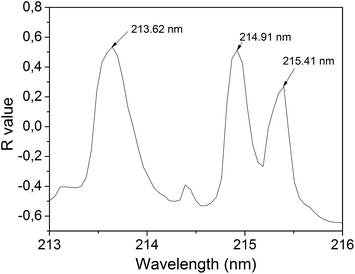 | ||
| Fig. 2 Correlation graph for P. The correlation was calculated between the P concentration in each sample and the intensity points at a fixed wavelength. | ||
The wavelengths indicated in Fig. 2 in the region 213–216 nm showed the highest correlation values for the entire spectrum (180 nm to 990 nm). Using the NIST database,16 and considering the spectrometer precision (±0.05 nm), these peaks were referred to P atomic emission lines at 213.62 nm, 214.91 and 215.41 nm. The line at 213.62 nm was chosen for the calibration model because it showed a little higher correlation than the other two peaks, featured no apparent interference and resulted in the higher peak intensity among these three peaks.
According to the NIST database,16 in addition to P transitions, this region can also include the transitions of Fe II, 213.56 nm; Fe II, 213.59 nm; Fe II, 213.60 nm and Fe II, 213.65 nm; and Cu II, 213.60 nm. Thus, these transitions may overlap each other and disturb the P emission line. To verify that these lines do not interfere with the P line, a correlation analysis similar to the one performed for P (Fig. 2) was performed for Fe and Cu concentrations measured by ICP-OES. The correlations with Fe and Cu concentration in the region 213–216 nm were small (R around 0.25), thus Fe and Cu interferents were ignored. The elements Al, Cr, K, Mg, Na, Ni and Zn were also analyzed and no significant interference was found. Thus the P line intensity at 213.62 nm is minimally interfered by others elements, and its intensity is assumed to be almost exclusively due to the P transition.
3 Results and discussion
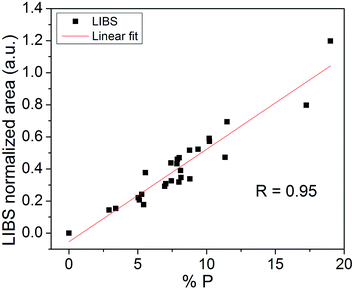
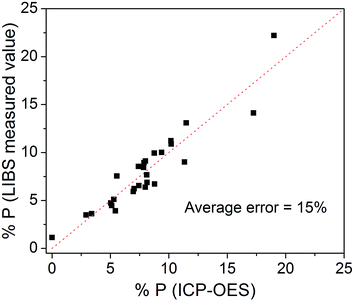
Fig. 3 shows the average values of the P emission line areas obtained by using the LIBS technique versus the P concentration obtained by ICP-OES. A linear fit was performed in order to obtain a calibration curve model. The correlation found was R = 0.95, which is very satisfactory given the different compositions of samples. The same calibration curve obtained without applying the peak normalization procedure resulted in a correlation of R = 0.76.Fig. 4 shows the cross-validation data. In this kind of validation, one sample is withdrawn from the 26 samples and it is not used to calibrate the model. The extracted sample is then tested with the model. This process is repeated for testing all the 26 samples. In an ideal situation, all points in Fig. 4 would be aligned perfectly with the dashed line, indicating a total agreement between ICP and LIBS data. In the experimental case, the point displacement is proportional to the quantification error (root mean square error) that resulted in 15% averaged for all the 26 samples. The limit of detection (LOD) for P quantification was 0.5%, which is acceptable for P quantification in fertilizers of different types of matrix compositions by using portable LIBS systems. The LOD was calculated with the equation LOD = 3σ/m, where σ is the standard deviation of the background signal and m is the slope of the calibration curve referred to the P element analyzed.
Although, the average concentrations of Cu and Fe in our samples are about 46 mg kg−1 and 7500 mg kg−1, respectively, the quantification error does not change for samples. This result confirms the previous observation that Cu and Fe do not interfere with the P transition considered (213.62 nm) at the concentration limit of the experimental system used, which might not be the case for a more sensitive system. Further, the lack of interference with the P emission line may also be due to the high concentrations of P (more than 2.5%) in the fertilizers examined.
In order to test the robustness of the calibration curve, two reference materials were used: the fertilizer 695 CRM and the phosphate rock 694 CRM. The reference values for P concentrations were 7.2% and 13.2%, respectively. The values measured by LIBS were 7.4 ± 0.9% for the fertilizer and 13.9 ± 2.2% for the rock. Thus, a good agreement was obtained with the reference values within the measurement error.
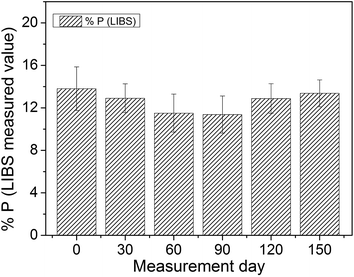
In order to evaluate the possible variation of experimental parameters over time, the P concentration in the phosphate rock 694 CRM reference was measured by LIBS over almost half a year. The quantification was performed using the same calibration model developed for the 26 samples. The graph in Fig. 5 shows the evolution over time of the LIBS P value.
Fig. 5 shows that the measured P concentration remained almost stable over time with a small and acceptable fluctuation, although the electronic background baseline (when no light is being captured by the fiber) varied considerably between different days of measurements. To overcome this issue, a blank spectrum (without sample) was acquired at the beginning of each day in order to correct the spectral offset. Although most LIBS systems can eliminate the electronic offset automatically, in our system the automatic correction implied a small error, thus the offset was removed manually as described in the previous section. Despite the fact that the experimental system was susceptible to some fluctuations in that period of time, as laser power fluctuation (∼10%) and offset, the analysis based on the area normalization was able to overcome such problems. Thus, the system could easily handle some small perturbation, which is very useful for portable LIBS systems that imply handling with some perturbation due to transportation and different environments.
The robustness of the quantification obtained relies mainly on the proportionality of area A2 to the amount of ablated matter in the plasma. The methodology applied is able to overcome small fluctuations in laser power, which interferes directly with the amount of ablated material. Other authors have used a normalization procedure similar to that used in this work to prevent fluctuations.17,18 Further, the normalization applied was able to overcome the matrix effects of the different kinds of fertilizers. This result would suggest that matrix effects were mostly of physical and not chemical nature.19–21 Indeed, in the case of physical matrix effects, the interaction between light and matter affects mainly the amount of matter ablated from different samples and does not affect the stoichiometry.
4 Conclusions
The applicability of the LIBS technique to the quantification of elemental P in fertilizers of different compositions was studied. A procedure was used to exclude the outliers, remove the offset and obtain peak normalization. The final average error in P quantification was 15%, which is acceptable for in situ measurements and can be implemented in a portable system. The study has considered a number of fertilizers of matrix composition by applying a normalization correction to improve the results.The P concentrations in two reference samples with different matrix compositions (a phosphate rock and a phosphate fertilizer) were determined successfully by using LIBS. No significant fluctuations were found in P quantification over time for more than 150 days performed on a reference material. A method was developed to correct the physical matrix effects for different samples.
The LIBS technique was shown to apply well for high P concentration fertilizers encompassing a wide range of commercial fertilizers found in Brazil. For other materials with low P contents (e.g. soils and minerals) further studies need to be performed. Further possible applications of the LIBS technique will be directed to the analysis of other macronutrients in fertilizers, such as N and K.
Acknowledgements
The authors thank FAPESP (2013/02165-7), CNPq, and EMBRAPA for their financial support of this study.Notes and references
- R. W. Scholz, A. H. Roy, F. S. Brand, D. T. Hellums and A. E. Ulrich, Sustainable Phosphorus Management: A Global Transdisciplinary Roadmap, Springer Netherlands, 2013 Search PubMed.
- D. Cordell, PhD thesis, Linkonpig University, 2010.
- D. W. Hahn and N. Omenetto, Appl. Spectrosc., 2012, 66, 347 CrossRef CAS PubMed.
- G. Nicolodelli, B. S. Marangoni, J. S. Cabral, P. R. Villas-Boas, G. S. Senesi, C. H. Dos Santos, R. Romano, A. Segnini, Y. Lucas, C. R. Montes and D. M. B. P. Milori, Appl. Opt., 2014, 53, 2170–2176 CrossRef CAS PubMed.
- W. A. Farooq, F. N. Al-Mutairi, A. E. M. Khater, A. S. Al-Dwayyan, M. S. AlSalhi and M. Atif, Opt. Spectrosc., 2012, 112, 874–880 CrossRef CAS.
- S. Yao, J. Lu, J. Li, K. Chen, J. Lia and M. Donga, J. Anal. At. Spectrom., 2010, 25, 1733–1738 RSC.
- L. C. Nunes, A. Carvalho, G. Gustinellil, D. S. Junior and F. J. Krug, Spectrochim. Acta, Part A, 2014, 97, 42–48 CrossRef CAS.
- D. A. Cremers and L. J. Radziemski, Handbook of Laser-Induced Breakdown Spectroscopy, John Wiley & Sons, U.K., 2006 Search PubMed.
- A. W. Miziolek, V. Palleschi and I. Schechter, Laser-Induced Breakdown Spectroscopy (LIBS): Fundamentals and Applications, Cambridge University Press, Cambridge, 2006 Search PubMed.
- J. Frydenvang, K. M. Kinch, S. Husted and M. B. Madsen, Anal. Chem., 2013, 85, 1492–1500 CrossRef CAS PubMed.
- S. Rosenwasser, G. Asimellis, B. Bromley, R. Hazlett, J. Martin, T. Pearce and A. Zigler, Spectrochim. Acta, Part B, 2001, 56, 707–714, DOI:10.1016/S0584-8547(01)00191-4.
- M. Gaft, I. Sapir-Sofer, H. Modiano and R. Stana, Spectrochim. Acta, Part B, 2007, 62, 1496–1503, DOI:10.1016/j.sab.2007.10.041.
- M. Gaft and Y. Groisman, Spectrochim. Acta, Part B, 2010, 65, 744–749, DOI:10.1016/j.sab.2010.03.019.
- G. Asimellis, A. Giannoudakos and M. Kompitsas, Spectrochim. Acta, Part B, 2006, 61, 1253–1259, DOI:10.1016/j.sab.2006.10.011.
- N. Keshava, IEEE Transactions on Geoscience and Remote Sensing, 2004, 42, 1552–1565 CrossRef.
- NIST Atomic Spectra Database, http://www.nist.gov/pml/data/asd.cfm, accessed October 2014.
- L. Li, Z. Wang, T. Yuan, Z. Hou, Z. Li and W. Ni, J. Anal. At. Spectrom., 2011, 26, 2274–2280 RSC.
- Z. Ni, X. Chen, H. Fu, J. Wang and F. Dong, Front. Phys., 2014, 9, 439–445 CrossRef.
- G. S. Senesi, Earth-Sci. Rev., 2014, 139, 231–267 CrossRef CAS.
- I. Rauschenbacha, V. Lazicb, S. G. Pavlovc, H. W. Hübersc and E. K. Jessbergera, Spectrochim. Acta, Part B, 2008, 63, 1205–1215 CrossRef.
- R. S. Harmon, F. C. de Lucia, A. W. Miziolek, K. L. McNesby, R. A. Walters and P. D. French, Geochem.: Explor., Environ., Anal., 2005, 5, 21–28 CrossRef CAS.
| This journal is © The Royal Society of Chemistry 2016 |

