New fluorescent probe for Zn2+ imaging in living cells and plants†
Rong
Shen
ab,
Di
Liu
ab,
Chenchen
Hou
ab,
Ju
Cheng
abc and
Decheng
Bai
*abc
aInstitute of Integrated Traditional Chinese and Western Medicine, School of Basic Medical Sciences, Lanzhou University, Lanzhou, 730000, Gansu, China. E-mail: shenr12@lzu.edu.cn; liud2013@lzu.edu.cn; houchch14@lzu.edu.cn; chengj@lzu.edu.cn
bKey Laboratory of Preclinical Study for New Drugs of Gansu Province, Lanzhou University, School of Basic Medical Sciences, 199 West Donggang Road, Lanzhou 730000, Gansu, China. E-mail: bdc@lzu.edu.cn; Tel: +86 13088758222
cInstitute of Operative Surgery, School of Basic Medical Sciences, Lanzhou University, Lanzhou 730000, Gansu, China
First published on 26th November 2015
Abstract
A new fluorescent probe, L1 based on 8-aminoquinoline, was designed and synthesized. It exhibits high selectivity and sensitivity toward Zn2+ over other common metal ions (especially Cd2+). Under physiological conditions (pH 7.0), the probe displays an 8-fold fluorescence turn-on response to Zn2+. Furthermore, using laser scanning confocal techniques, it can be used to effectively monitor and distinguish Zn2+ from Cd2+ in living cells and plant tissues.
1. Introduction
Zinc (Zn2+) is an indispensable trace element which plays an important role in organisms ranging from funguses to mammals.1–3 Most Zn2+ in organisms is closely bound with proteins but a minority exists in free distribution form. It is known that Zn2+ exists in various systems and that it participates in many chemical processes that involve vital activities such as gene expression, neurotransmission, cell differentiation, metalloenzyme synthesis, and auxin regulation.4–9 Common diseases such as immunocompromised, ataxia, Alzheimer, dermatitis, and some others10–13 are related to disorders that involve Zn2+ metabolism. In addition, elevated levels of Zn2+ in the environment can cause toxicity effects in plants, reduced protective enzyme activity, and photosynthesis.14–16 Therefore, detection and monitoring Zn2+ – especially in living cells – is of considerable interest.Research involving novel fluorescent probes has obtained growing attention due to their applications in various fields. In fact, considerable efforts were focused on development of efficient methods for monitoring Zn2+, especially fluorescent probes,17–24 which are considered simple and reproducible. However, applications of probe assay in tissue cells to distinguish Zn2+ from various other metal cations, especially Cd2+, have still been less studied up to now. Thus, there is a great need for designing a sensitive probe that has high selectivity and permeability, and can discriminate Zn2+ in biological tissues.
8-Aminoquinoline and its derivatives are excellent chromophores which are frequently used as reporters in fluorescent probes.22,23,25–27 Herein, we report a new quinoline-derived probe, L1 (Scheme 1) for Zn2+ detection with high sensitivity and selectivity, which is fabricated easily and has simple construction. Besides, this probe displays a highly selective chelation enhanced fluorescence (CHEF) effect28 with Zn2+ ions which serves as the basis of the probe for Zn2+. Moreover, probe L1 was also a contributor for imaging Zn2+ in living human cells and plant tissues. “Micro-CT” technology (micro computed tomography) provides a good way to provide microscopic images of subcellular fractions because of the deficiency of spatial resolution anisotropy in optical microscopy. Thus, we incorporated “Micro-CT” technology to reveal the imaging position in cells and the good cell membrane permeability of probe L1.
2. Materials and methods
2.1. Materials and instrumentations
All materials for synthesis were purchased from commercial suppliers and used without further purification. Ethanol for spectra detection was HPLC reagent grade with no fluorescent impurity. 1H NMR and 13C NMR (Fig. S1†) were obtained using a Varian mercury-400 spectrometer with TMS as an internal standard and CDCl3 as solvent. ESI mass spectra were obtained using a Bruker Daltonics Esquire 6000 spectrometer. Fluorescence spectra measurements were obtained with a Hitachi F-4500 spectrofluorometer. Fluorescent pictures were taken on Leica laser scanning confocal microscope. Stock solutions of the metal ions (10 mM) were prepared in deionized water.2.2 Synthesis of probe L1
2-Chloro-N-(quinolin-8-yl) acetamide (L2) was prepared from 8-aminoquinoline. To a chloroform (25 mL) solution of 8-aminoquinoline (0.69 g, 4.8 mmol) and pyridine (1 mL) cooled in an ice bath was added dropwise a chloroform (5 mL) solution of chloroacetyl chloride (0.8 mL, 10.1 mmol) with stirring. After stirring for 24 h at room temperature, the mixture was removed under reduced pressure to obtain a yellow solid, which was purified by silica gel column chromatography using dichloromethane as the eluent to afford L2 in 90% yield. ESI-MS: (m/z) = 221.1.2-Chloro-N-(quinolin-8-yl) acetamide (L2, 1.1 g, 5 mmol), KI (42 mg, 0.25 mmol), and K2CO3 (1.04 g, 7.5 mmol) were added into the mixture of acetonitrile (40 mL) and distilled water (8 mL) and then stirred and refluxed for 8 h at about 80 °C. After cooling to room temperature, the mixture was purified by silica gel column chromatography using dichloromethane as the eluent, and a white solid was obtained in 57% yield. 1H NMR (400 MHz, CDCl3) δ 10.49 (s, 1H), 8.85 (dd, J = 4.3, 1.7 Hz, 1H), 8.83–8.73 (m, 1H), 8.22 (dd, J = 8.3, 1.5 Hz, 1H), 7.62–7.55 (m, 2H), 7.54–7.47 (m, 1H), 4.43 (s, 2H), 2.97 (s, 1H). 13C NMR (100 MHz, CDCl3): δ 169.881, 148.363, 136.587, 128.050, 127.382, 122.206, 121.716, 117.068, 62.915. ESI-MS: (m/z) = 203.3.
2.3 Cell incubation and imaging
MDA-231 (breast cancer) cells and HBL-100 (normal human breast) cells were cultured in culture media (Dulbecco's Modified Eagle's Medium, High Glucose) supplemented with 10% FBS (Fetal Bovine Serum), 100 U mL−1 penicillin and 100 U mL−1 streptomycin at 37 °C in a humidified incubator which was provided with 5% CO2 and 95% air. MDA-231 cells were cultured in a 12-well plate dish at a density of 104 cells per well in culture media. After 48 h they were treated with Zn2+ (30 μM) and Cd2+ (30 μM) respectively for 30 min at 37 °C, and then washed with phosphate-buffered saline (PBS) three times before incubating with probe L1 (10 μM) for another 10 min and then imaged by laser scanning confocal microscopy. The MDA-231 cells only incubated with 10 μM probe L1 for 10 min at 37 °C under 5% CO2 were used as a control. HBL-100 cells were cultured and imaged using the same process as with the MDA-231 cells.2.4 Plants culture and imaging
The wheat seeds were disinfected with a 70% ethanol and 3% sodium hypochlorite solution, washed thoroughly with distilled water five times, then cultured on Petri dishes and covered with sterilized quartz sand under condition of room temperature and 70% relative humidity. For three days the control group was supplied only with diluted Hoagland, but the experimental groups were treated using Hoagland solution with different levels of Zn2+ and Cd2+ ions respectively. Ten days later, some leaves and roots were collected from the different experimental groups. Subsequently, the samples were soaked in a solution containing L1 (10 μM) for 30 min after being washed by distilled water three times; then, after being rinsed with PBS three times again, the fluorescent images of the plant samples were obtained by confocal microscopy. The samples only incubated with 10 μM probe L1 for 30 min were used as controls.3. Results and discussion
3.1 Selectivity and cation-competitive experiments
High selectivity is extremely important for an excellent probe. To evaluate the specificity of L1 toward Zn2+, the selectivity of L1 toward common metal ions, including Cd2+, K+, Na+, Fe3+, Cr3+, Ni2+, Mg2+, Ag+, Hg2+, Al3+, Co2+, Mn2+, Pb2+, Li+, Cu2+ and Zn2+, was measured in H2O/ethanol (8![[thin space (1/6-em)]](https://www.rsc.org/images/entities/char_2009.gif) :
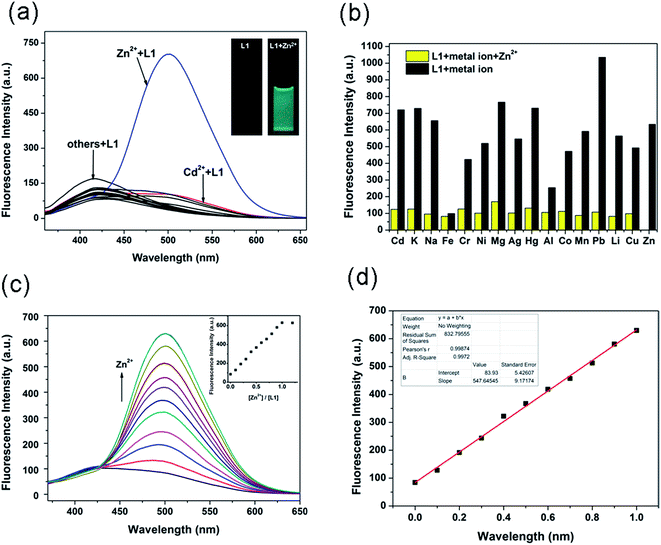
:![[thin space (1/6-em)]](https://www.rsc.org/images/entities/char_2009.gif) 2, v/v) solutions. As shown in Fig. 1a, only the addition of Zn2+ ion caused a prominent emission enhancement, whereas the other miscellaneous competitive cations tested caused no obvious changes; this demonstrated that L1 could distinguish Zn2+ from other metal ions, especially Cd2+. Correspondingly, the fluorescence color changed from colorless to turquoise (Fig. 1a inset), which is easily distinguished by the naked eye with the aid of a normal UV lamp.
2, v/v) solutions. As shown in Fig. 1a, only the addition of Zn2+ ion caused a prominent emission enhancement, whereas the other miscellaneous competitive cations tested caused no obvious changes; this demonstrated that L1 could distinguish Zn2+ from other metal ions, especially Cd2+. Correspondingly, the fluorescence color changed from colorless to turquoise (Fig. 1a inset), which is easily distinguished by the naked eye with the aid of a normal UV lamp.
To validate the selectivity of L1 in practice, cation-competitive experiments were done to further explore the utility of L1 as an ion-selective probe for Zn2+. As shown in Fig. 1b, although the miscellaneous competitive cations have more or less influence on the fluorescence intensity, significant enhancement in the fluorescence intensity was observed for L1 when Zn2+ ion was added in the presence of miscellaneous competitive cations. Interference of the other metal ions was relatively limited, indicating that L1 could be applied to detect Zn2+ effectively. Notably, the Cd2+, which is known as a common competitor for Zn2+, did not cause such a change either. These results strongly illustrated that L1 had a high sensitivity and selectivity for Zn2+ which was superior to other metal cations.
3.2 Fluorescence titration
Fluorescence spectrum changes of L1 were measured with different concentrations of Zn2+ ions (0–20 μM) in H2O/ethanol (8![[thin space (1/6-em)]](https://www.rsc.org/images/entities/char_2009.gif) :
:![[thin space (1/6-em)]](https://www.rsc.org/images/entities/char_2009.gif) 2, v/v) solutions. As shown in Fig. 1c, probe L1 exhibited a weak emission at 500 nm (λex = 360 nm, Φ = 7.6%). Upon incremental addition of Zn2+ ion (0–2 equiv.), the fluorescence intensity undergoes about an 8-fold increase, indicating a turn-on fluorescent response toward Zn2+ ion. In addition, emission intensity increased linearly with the amount of Zn2+ ion in the range 0–10 μM (Fig. 1c inset), suggesting formation of a 1/1 complex. From the linear equation (Fig. 1d), the detection limit for Zn2+ was calculated to be 0.65 μM.
2, v/v) solutions. As shown in Fig. 1c, probe L1 exhibited a weak emission at 500 nm (λex = 360 nm, Φ = 7.6%). Upon incremental addition of Zn2+ ion (0–2 equiv.), the fluorescence intensity undergoes about an 8-fold increase, indicating a turn-on fluorescent response toward Zn2+ ion. In addition, emission intensity increased linearly with the amount of Zn2+ ion in the range 0–10 μM (Fig. 1c inset), suggesting formation of a 1/1 complex. From the linear equation (Fig. 1d), the detection limit for Zn2+ was calculated to be 0.65 μM.
3.3 Mechanism of the sensing of Zn2+
To confirm the binding modes between L1 and Zn2+, a Job's plot was measured to further demonstrate the stoichiometric relationship (Fig. S2†). According to Job's plot results, the stoichiometric ratio of L1 with Zn2+ was determined to be 1![[thin space (1/6-em)]](https://www.rsc.org/images/entities/char_2009.gif) :
:![[thin space (1/6-em)]](https://www.rsc.org/images/entities/char_2009.gif) 1, which was consistent with results from the fluorescence titration. To get an insight into the molecular structure and the different optical behavior of L1 before and after addition of Zn2+, density functional theory (DFT) experiments were carried out with the Gaussian 09 suite of programs. The optimized configuration, shown in Fig. S3,† shows that the Zn2+ ion bound to L1 was very good through five coordination sites. Thus, the significant enhancement in emission intensity for L1 may be attributed to Zn2+-triggered amide tautomerization.
1, which was consistent with results from the fluorescence titration. To get an insight into the molecular structure and the different optical behavior of L1 before and after addition of Zn2+, density functional theory (DFT) experiments were carried out with the Gaussian 09 suite of programs. The optimized configuration, shown in Fig. S3,† shows that the Zn2+ ion bound to L1 was very good through five coordination sites. Thus, the significant enhancement in emission intensity for L1 may be attributed to Zn2+-triggered amide tautomerization.
3.4 Application in bioimaging
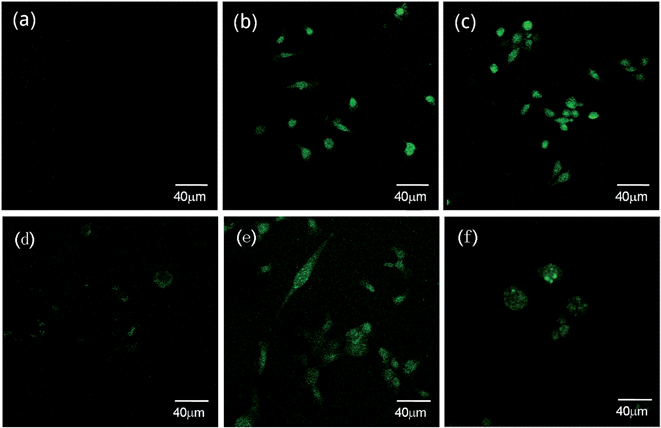
In order to exploit the Zn-sensing behavior of probe L1 in biological systems, we incorporated a Laser Scanning Confocal Microscope for imaging the metal ions in living human cells and plants tissues. A significant enhancement of fluorescence in cells was observed after the cells were intervened by metal ions and probe L1. The fluorescence of cells treated with Zn2+ revealed uniform enhancement in whole cells without brighter organelles (Fig. 2b), but the cells treated with Cd2+ revealed the brightest fluorescence inside of some special organelles (Fig. 2c). The results of HBL-100 cells were similar to the group of MDA-231 cells. Remarkably, very weak intracellular fluorescence was observed in the cells in presence of L1 before exogenous Zn2+ was added (Fig. 2d) because Zn2+ is an essential trace element that exists normally in the human body. Comparing Fig. 2a with Fig. 2d, the former showed no fluorescence which conformed with some other experimental studies that Zn2+ content was abnormal in tumors.11,29–31 As shown in Fig. 2f, the outline of some special organelles was more distinct when treated with Cd2+; we used the “Micro-CT” scanning of HBL-100 cells layer by layer to confirm the imaging areas (Fig. S4†). Subcellular distribution of Cd2+ differing from Zn2+ was illustrated and needs further study and investigation. | ||
| Fig. 2 Fluorescence images of L1 in MDA-231 (breast cancer) cells (Fig. 4a–c) and HBL-100 (normal human breast) cells (Fig. 4d–f). (a) MDA-231 cells stained with 10 μM solution of L1 for 10 min. (b) 30 μM Zn2+ supplemented cells and (c) 30 μM Cd2+ supplemented cells respectively for 30 min and then incubated with L1 10 μM for 10 min. (d) HBL-100 cells stained with 10 μM solution of L1 for 10 min. (e) 30 μM Zn2+ supplemented cells and (f) 30 μM Cd2+ supplemented cells respectively for 30 min and then incubated with L1 10 μM for 10 min. Incubation was performed at 37 °C under a humidified atmosphere containing 5% CO2. | ||
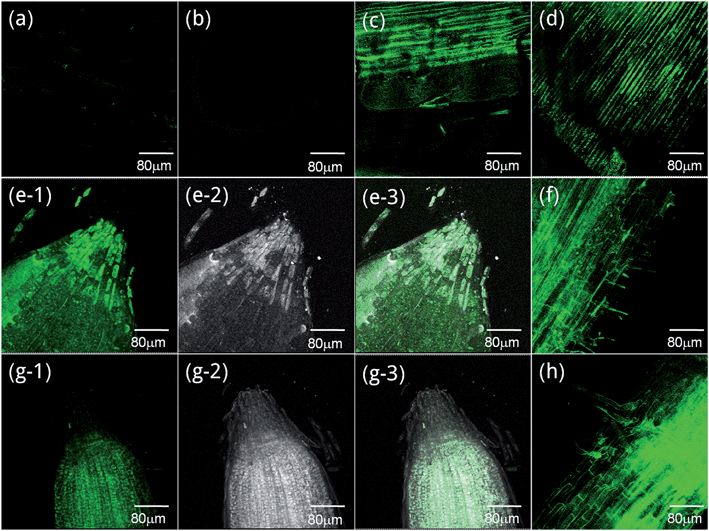
From plant tissue imaging results, specimens of leaves and roots displayed an obviously fluorescent enhancement both in samples treated with Zn2+ and Cd2+ (Fig. 3c–h). Even more, as the bright and dark fields showed, the Zn2+ treated root was brighter in the root cap (Fig. 3e) and root hair (Fig. 3f), but the Cd2+ treated one was the opposite (Fig. 3g and h). These distinguishing images confirmed that Zn2+ and Cd2+ existed in different plant tissue structures.32–34 All these outcomes certified that the well cell permeability and histocompatibility of probe L1 granted access to chelates with Zn2+ and Cd2+ in both human cells and plant tissues.
3.5 Measurement of cell viability
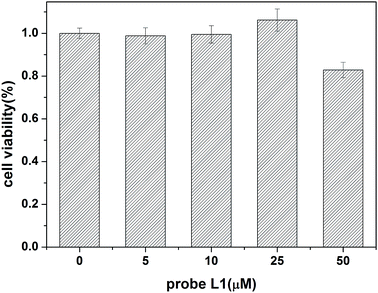
Furthermore, in order to evaluate toxic effects of our probe, a cytotoxicity test was performed in HBL-100 normal breast cells at different concentrations (5, 10, 25, and 50 μM) respectively using probe L1. The absorbance of cells showed that the cell's viability was more than 80% (Fig. 4) at 570 nm. This experimental result demonstrates that probe L1 has low cytotoxicity when cultivating cells under concentrations from 5 μM to 25 μM which can be used in bioapplications.4. Conclusions
In summary, a new probe L1 was synthesized and characterized. It exhibited high sensitivity and selectivity for zinc ions over other metal ions, especially Cd2+. Moreover, the excellent permeability and biocompatibility of L1 made it easy to access living cells, including human cells and plant tissues, while detecting intracellular Zn2+ and Cd2+ in different positions. We expect that the fluorescent probe L1 will be a great help for monitoring Zn2+ in biological systems.Conflict of interest
The authors declare that there are no conflicts of interest.Acknowledgements
This work was supported by the NSFC (No. 21201092), the Research Fund for the Doctoral Program of Higher Education (No. 20120211120020), the Gansu NST (1208RJYA028) and the Fundamental Research Funds for the Central Universities (Lzujbky-2014-190). Thanks to Professor Zhengzhi Zeng for chemical synthesis help.References
- A. S. Prasad, J. Trace Elem. Med. Biol., 2014, 28, 357–363 CAS.
- B. K. Bitanihirwe and M. G. Cunningham, Synapse, 2009, 63, 1029–1049 CrossRef CAS PubMed.
- R. Sharif, P. Thomas, P. Zalewski and M. Fenech, Mutat. Res., 2012, 733, 111–121 CrossRef CAS PubMed.
- G. Yang, A. Inoue, H. Takasaki, H. Kaku, S. Akao and S. Komatsu, J. Proteome Res., 2005, 4, 456–463 CrossRef CAS PubMed.
- Y. Chen, K. Aung, J. Rolcik, K. Walicki, J. Friml and F. Brandizzi, Plant J., 2014, 77, 97–107 CrossRef CAS PubMed.
- C. V. Ha, D. T. le, R. Nishiyama, Y. Watanabe, S. Sulieman, U. T. Tran, K. Mochida, N. V. Dong, K. Yamaguchi-Shinozaki, K. Shinozaki and L. S. Tran, DNA Res., 2013, 20, 511–524 CrossRef PubMed.
- J. A. Carcillo, J. M. Dean, R. Holubkov, J. Berger, K. L. Meert, K. J. Anand, J. Zimmerman, C. J. Newth, R. Harrison, J. Burr, D. F. Willson and C. Nicholson, H. Eunice Kennedy Shriver National Institute of Child, N. Human Development Collaborative Pediatric Critical Care Research, Pediatr Crit. Care Med., 2012, 13, 165–173 CrossRef PubMed.
- J. Amich, R. Vicentefranqueira, E. Mellado, A. Ruiz-Carmuega, F. Leal and J. A. Calera, Cell. Microbiol., 2014, 16, 548–564 CrossRef CAS PubMed.
- L. M. Engstrom, M. K. Brinkmeyer, Y. Ha, A. G. Raetz, B. Hedman, K. O. Hodgson, E. I. Solomon and S. S. David, J. Am. Chem. Soc., 2014, 136, 7829–7832 CrossRef CAS PubMed.
- Z. Xu and J. Zhou, BioMetals, 2013, 26, 863–878 CrossRef CAS PubMed.
- Y. S. Lin, J. L. Caffrey, J. W. Lin, D. Bayliss, M. F. Faramawi, T. F. Bateson and B. Sonawane, JJ. Toxicol. Environ. Health, Part A, 2013, 76, 1–15 CrossRef CAS PubMed.
- D. R. Morris and C. W. Levenson, J. Nutr. Biochem., 2013, 24, 1940–1944 CrossRef CAS PubMed.
- R. Sharif, P. Thomas, P. Zalewski and M. Fenech, Genes Nutr., 2012, 7, 139–154 CrossRef CAS PubMed.
- R. Han, M. Quinet, E. Andre, J. T. van Elteren, F. Destrebecq, K. Vogel-Mikus, G. Cui, M. Debeljak, I. Lefevre and S. Lutts, Planta, 2013, 238, 441–457 CrossRef CAS PubMed.
- N. Vaillant, F. Monnet, A. Hitmi, H. Sallanon and A. Coudret, Chemosphere, 2005, 59, 1005–1013 CrossRef CAS PubMed.
- H. Zhao, L. Wu, T. Chai, Y. Zhang, J. Tan and S. Ma, J. Plant Physiol., 2012, 169, 1243–1252 CrossRef CAS PubMed.
- H. Nouri, C. Cadiou, L. M. Lawson-Daku, A. Hauser, S. Chevreux, I. Dechamps-Olivier, F. Lachaud, R. Ternane, M. Trabelsi-Ayadi, F. Chuburu and G. Lemercier, Dalton Trans., 2013, 42, 12157–12164 RSC.
- X. Liu, N. Zhang, J. Zhou, T. Chang, C. Fang and D. Shangguan, Analyst, 2013, 138, 901–906 RSC.
- A. Loas, R. J. Radford and S. J. Lippard, Inorg. Chem., 2014, 53, 6491–6493 CrossRef CAS PubMed.
- Z. Guo, G. H. Kim, J. Yoon and I. Shin, Nat. Protoc., 2014, 9, 1245–1254 CrossRef CAS PubMed.
- Y. Shi, Z. Chen, X. Cheng, Y. Pan, H. Zhang, Z. Zhang, C. W. Li and C. Yi, Biosens. Bioelectron., 2014, 61, 397–403 CrossRef CAS PubMed.
- S. K. Rastogi, P. Pal, D. E. Aston, T. E. Bitterwolf and A. L. Branen, ACS Appl. Mater. Interfaces, 2011, 3, 1731–1739 CAS.
- Z. Xu, J. Yoon and D. R. Spring, Chem. Soc. Rev., 2010, 39, 1996–2006 RSC.
- Z. Xu, K. H. Baek, H. N. Kim, J. Cui, X. Qian, D. R. Spring, I. Shin and J. Yoon, J. Am. Chem. Soc., 2010, 132, 601–610 CrossRef CAS PubMed.
- C. Zhao, Y. Zhang, P. Feng and J. Cao, Dalton Trans., 2012, 41, 831–838 RSC.
- J. Huang, Y. Xu and X. Qian, Dalton Trans., 2014, 43, 5983–5989 RSC.
- X. Zhou, P. Li, Z. Shi, X. Tang, C. Chen and W. Liu, Inorg. Chem., 2012, 51, 9226–9231 CrossRef CAS PubMed.
- N. Chattopadhyay, A. Mallick and S. Sengupta, J. Photochem. Photobiol., A, 2006, 177, 55–60 CrossRef CAS.
- E. John, T. C. Laskow, W. J. Buchser, B. R. Pitt, P. H. Basse, L. H. Butterfield, P. Kalinski and M. T. Lotze, J. Transl. Med., 2010, 8, 118 CrossRef PubMed.
- M. C. Franz, P. Anderle, M. Burzle, Y. Suzuki, M. R. Freeman, M. A. Hediger and G. Kovacs, Mol. Aspects Med., 2013, 34, 735–741 CrossRef CAS PubMed.
- A. G. Sarafanov, T. I. Todorov, J. A. Centeno, V. Macias, W. Gao, W. M. Liang, C. Beam, M. A. Gray and A. A. Kajdacsy-Balla, Prostate, 2011, 71, 1231–1238 CrossRef CAS PubMed.
- I. Lefevre, K. Vogel-Mikus, L. Jeromel, P. Vavpetic, S. Planchon, I. Arcon, J. T. Van Elteren, G. Lepoint, S. Gobert, J. Renaut, P. Pelicon and S. Lutts, Plant, Cell Environ., 2014, 37, 1299–1320 CrossRef CAS PubMed.
- N. Yamaguchi, S. Ishikawa, T. Abe, K. Baba, T. Arao and Y. Terada, J. Exp. Bot., 2012, 63, 2729–2737 CrossRef CAS PubMed.
- W. Zhang, K. Lin, J. Zhou, W. Zhang, L. Liu and Q. Zhang, Environ. Toxicol. Pharmacol., 2014, 37, 348–353 CrossRef CAS PubMed.
Footnote |
| † Electronic supplementary information (ESI) available. See DOI: 10.1039/c5ay02380g |
| This journal is © The Royal Society of Chemistry 2016 |


