DOI:
10.1039/C4RA06828A
(Paper)
RSC Adv., 2014,
4, 48411-48418
Preparation and characterization of SrTiO3–ZnTe nanocomposites for the visible-light photoconversion of carbon dioxide to methane†
Received
16th July 2014
, Accepted 16th September 2014
First published on 16th September 2014
Abstract
Limited fossil fuel resources and increasingly stringent requirement of environmental protection from major greenhouse gases, including carbon dioxide (CO2), which results directly from the burning of fossil fuels, energy savings and greenhouse-effect alleviation have emerged as major global concerns. The development of an “artificial photosynthetic system” (APS) having both the analogous important structural elements and the reaction features of photosynthesis to achieve solar-driven water splitting and CO2 reduction is highly challenging. Herein, it has been demonstrated that SrTiO3–ZnTe can be utilized as an efficient APS for the photoreduction of CO2 into methane (CH4) under visible-light irradiation (≥420 nm). The results indicate that the combination of ZnTe with SrTiO3 visibly increases the formation of CH4 by efficiently promoting electron transfer from the conduction band of ZnTe to that of SrTiO3 under visible-light irradiation, and thereby demonstrate this to be a promising candidate for the photocatalytic conversion of CO2 into hydrocarbon fuels.
Introduction
To date, hydrocarbon fuels (petroleum, natural gas, and coal) have been considered as the most important source of energy due to their ready availability in nature, high energy content, stability, and ease of storage and transportation. However, the foreseen shortage of fossil fuels has become a global concern as global energy consumption has tremendously increased since the start of the industrial revolution, leading toward the depletion of these energy resources. Other than their depletion, their combustion also has a significant drawback of environmental pollution by CO2 emissions on an alarmingly larger scale, which directly contributes to global warming.1 To address this major problem, a solar-energy-based system for recycling CO2 into some readily transportable and stable fuels, i.e., solar fuels, could help to control and reduce atmospheric CO2 levels and to partly fulfil the energy requirements in the current hydrocarbon-based fuel infrastructure.
Solar energy can be efficiently utilized for the fixation of CO2 by its photoreduction with H2O. Ever since the pioneering work by Honda and Fujishima in the early 1970s,2 the photochemical conversion of solar energy into different forms of chemical energy has been intensively studied. Considerable efforts have been made in this regards to explore the photoreduction of CO2 into useful chemical fuels such as CH4, methanol (CH3OH), and carbon monoxide (CO).3–13 A variety of photocatalysts, such as metal oxides,3–6 tantalates,7 ZnGa2O4,8 Bi2WO6,9 Zn2GeO4,10 and titanium-based materials11–13 have been investigated for the efficient conversion of CO2 in both gaseous and liquid phases. However, the utilization of such a single semiconductor material as a photocatalyst is often restricted due to short lifetime of the photogenerated electron–hole pairs and/or the large band-gap, which is the cause of its limited visible-light response.14 On the other hand, narrow-band-gap semiconductors can absorb the visible-light photons for the generation of electron–hole pairs, but unfortunately they suffer from photocorrosion15 and the fast recombination of the charge carriers. It has therefore been a vital concern to develop an efficient design for the fabrication of nanostructured photocatalysts that can exhibit high activity and stability for use in practical applications.
Strontium titanate (SrTiO3), an n-type semiconductor with a simple perovskite structure, has been a renowned photocatalyst applied in the field of hydrogen energy;16,17 but there are only a very few reports about the use of SrTiO3 as a photocatalyst for the photoreduction of CO2.18,19 Unfortunately, owing to its large band-gap, it responds only to the UV light, which accounts for only 4% of the solar spectrum. In order to improve its photocatalytic activity under visible-light, which accounts for about 43% of the solar spectrum, many researchers have tried different dopants, such as Fe, C, N, and Cr, to enhance its photocatalytic activity in the visible region.20–23 However, doping may also create some defects in the crystal structure, which may facilitate the recombination of the charge carriers, leading to a poor photocatalytic activity of SrTiO3. To prevent this recombination of the charge carriers, researchers have also tried loading some transition and noble metals, including Pt,24 Pd,25 and Cu,26 over the single large band-gap semiconductors. Such a scheme could inhibit the electron–hole pair recombination, but does not shift its response from UV to visible light. Thus, in contrast to the single semiconductors, the combination of two different semiconductors would facilitate the separation of charge carriers to minimize their recombination and, thereby, would enhance the photocatalytic activity.
In the present work, n-type SrTiO3 has been combined with different amounts (%) of p-type ZnTe, for the first time, to form the nanocomposite systems. ZnTe is a p-type II–VI semiconductor with a direct band gap of ∼2.26 eV at 300 K and is a promising material, due to its applications in solar cells,27 blue-green light-emitting diodes,28 and optoelectronic devices in the visible region.29 Because of its very negative conduction band position, ZnTe has a large driving force for the interfacial electron transfer from the semiconductor to the acceptor.30 As a result, ZnTe is considered an attractive material for designing novel photocatalysts. SrTiO3–ZnTe nanocomposites have been synthesized via the hydrothermal method. The photoreduction of CO2 using bare SrTiO3–ZnTe nanocomposites with different amounts of ZnTe (i.e., 0% (bare SrTiO3), 25%, 50%, 75%, and 100% (pure ZnTe)) has been studied under visible-light irradiation (≥420 nm), with CH4 as the major product for all of the photocatalysts. The obtained CH4 can be used as a renewable solar fuel, and will not be released into the atmosphere directly as a greenhouse gas. The results indicate that this work may help the development of high-efficiency photocatalysts, to help decrease the CO2 content in the environment via photoreduction, and, thereby, to help decrease the greenhouse effect.
Experimental
Chemicals
The chemicals used in our experiments were Ti(SO4)2 (>96%), Sr(NO3)2 (>99.5%), zinc powder (99.8%), tellurium powder (5 N), KOH (analytical grade, >85%), and NaOH (>96%). All of these chemicals were purchased from Sinopharm Chemicals and were used as such without any further treatment.
Synthesis of SrTiO3
SrTiO3 nanoparticles were successfully synthesized using the sonochemical method at room temperature.31 Titanium was used in the form of titanium hydroxide suspension, denoted as TOH. First, a clear aqueous solution of 0.05 M Ti(SO4)2 was prepared by dissolving it in 50 mL of 0.1 M HNO3 solution. This solution was then added dropwise into 0.5 M KOH solution under constant stirring, and white precipitates of titanium hydroxide were formed. For the removal of SO42− and NO3−, these precipitates were then centrifuged and washed copiously with Milli-Q water. For the preparation of TOH, the precipitates of titanium hydroxide were dispersed in 50 mL of Milli-Q water and collected for further use. For the synthesis of SrTiO3, equal volumes (50 mL) of TOH and aqueous solution of 0.05 M Sr(NO3)2 were added to a beaker containing 50 mL of 0.5 M KOH solution. This mixture was then sonicated for 2.5 hours under an ambient atmosphere. The resultant white precipitates of SrTiO3 were washed several times with Milli-Q water and finally with absolute ethanol, and then dried in an oven at 70 °C under vacuum overnight. Finally, the dried SrTiO3 nanoparticles were annealed at 650 °C for 4 hours at a heating rate of 5 °C min−1, and were saved for further characterizations.
Synthesis of ZnTe
ZnTe nanoparticles were successfully synthesized by the hydrothermal process.32 In a typical procedure, 0.52 g of zinc powder, 0.51 g of tellurium powder, and 4.6 g of NaOH were put into a Teflon tube with 50 mL capacity. The Teflon tube was then filled with Milli-Q water up to 80% of its capacity, which was then sealed in a stainless steel autoclave. The autoclave was kept in an oven for two hours at 100 °C. After it cooled down to room temperature, the resulting brown ZnTe precipitates were then centrifuged, washed several times with Milli-Q water and finally with absolute ethanol, and were then dried in oven for overnight at 70 °C under vacuum. The dried ZnTe nanoparticles were ground down and stored for further use.
Synthesis of SrTiO3–ZnTe nanocomposites
In a typical hydrothermal method, stoichiometric amounts of the obtained SrTiO3 (0.15, 0.1, and 0.05 g) and ZnTe (0.05, 0.105, and 0.16 g) with a respective molar ratio of 3![[thin space (1/6-em)]](https://www.rsc.org/images/entities/char_2009.gif) :1 (25% ZnTe), 1:1 (50% ZnTe), and 1:3 (75% ZnTe) were taken in a 50 mL Teflon tube, which was then filled to 80% of its capacity with Milli-Q water. The mixture, after being stirred for 2 hours, was then sealed in a stainless steel autoclave, which was then kept in an oven at 100 °C for 10 hours. After the autoclave was cooled down at room temperature, the precipitates of SrTiO3–ZnTe nanocomposites were collected via centrifuge and washed several times with Milli-Q water and finally with absolute ethanol. The resultant precipitates were then dried at 70 °C under vacuum for 8 hours, followed by thermal annealing at 200 °C for two hours under ambient conditions, and finally saved for further use.
:1 (25% ZnTe), 1:1 (50% ZnTe), and 1:3 (75% ZnTe) were taken in a 50 mL Teflon tube, which was then filled to 80% of its capacity with Milli-Q water. The mixture, after being stirred for 2 hours, was then sealed in a stainless steel autoclave, which was then kept in an oven at 100 °C for 10 hours. After the autoclave was cooled down at room temperature, the precipitates of SrTiO3–ZnTe nanocomposites were collected via centrifuge and washed several times with Milli-Q water and finally with absolute ethanol. The resultant precipitates were then dried at 70 °C under vacuum for 8 hours, followed by thermal annealing at 200 °C for two hours under ambient conditions, and finally saved for further use.
Characterization
A Bruker D8 focus diffractometer with Ni-filtered Cu-Kα radiation was used for the X-ray diffraction (XRD) analysis to probe the crystal structure of the as-synthesized products. The XRD patterns were recorded in the 2θ range of 20° to 80° at a scan rate of 0.1° min−1. A Lambda 750 UV/visible/NIR spectrophotometer was employed to collect the UV-visible diffuse reflectance spectra with wavelengths in the range of 200–800 nm at room temperature, with BaSO4 as the reference. An HITACHI S4800 FESEM with energy dispersive X-ray (EDX) spectrometer and HITACHI H-7700 transmission electron microscope (TEM) at 100 kV were used to analyze the morphology and composition of the as-synthesized powders. An LS55 fluorescence spectrometer was used to record the photoluminescence (PL) spectra. X-ray photoelectron spectroscopy (XPS) was performed to determine the composition and valance band position of the catalysts using an ESCALAB 250Xi X-ray photoelectron spectrometer.
Photocatalytic reduction of CO2
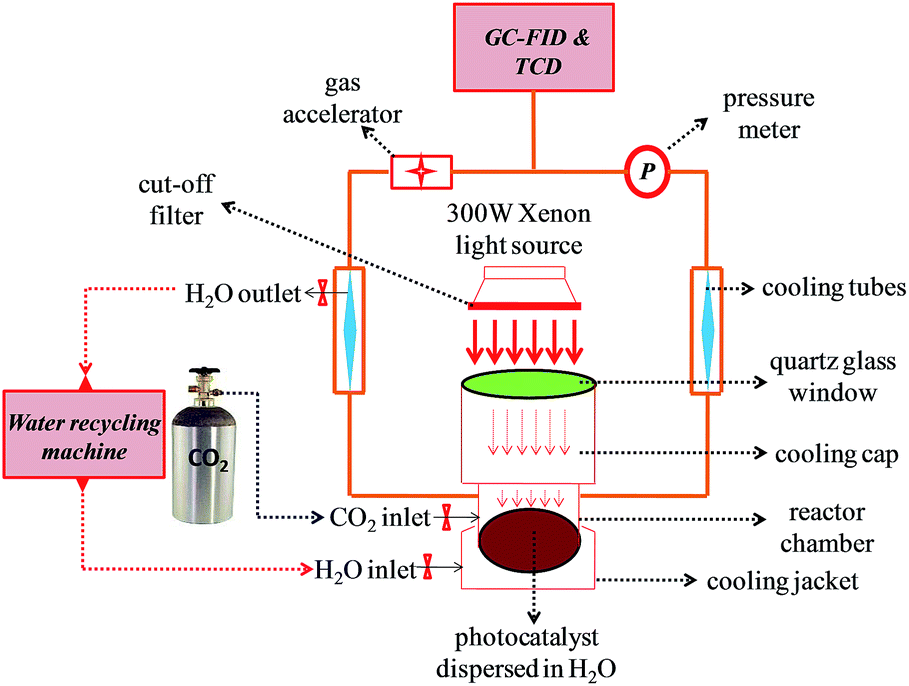
A schematic illustration of the photocatalytic reaction system for the reduction of CO2 is shown in Fig. 1. To produce a mixture of the CO2 and water vapor at atmospheric pressure, a high purity CO2 gas (≥99.999%) was bubbled through Milli-Q water in a quartz reactor attached with the photoreaction system. It was assured before the irradiation that there was no leakage in the photoreaction system and hence the positive pressure of CO2 inside the system was maintained at 25 kPa. Wet CO2 was allowed to flow through the photoreaction system loaded with 20 mg of the photocatalyst with different amounts of ZnTe (i.e., 0%, 25%, 50%, 75%, and 100%) for about 40 minutes before the irradiation, to ensure the complete removal of air from the system, as confirmed from the GC results, followed by the maximum adsorption of gas molecules on the photocatalysts. After the CO2-flow was stopped, a xenon lamp (300 W) equipped with a cut-off filter (≥420 nm) was turned on and the production of CH4 as a function of irradiation time was measured for a total time period of 8 hours. An approximate distance of 14–15 cm was maintained between the light source and the surface of the photocatalyst suspension in the photoreactor. Tap water (15 °C) was constantly recycled during the entire course of the reaction to maintain the temperature of the photoreaction system. An Agilent 7890A gas chromatograph (GC) was used to analyze the obtained CH4 via an automated gas valve using helium (He) as the carrier gas. The GC was equipped with one thermal conductivity detector (TCD) and two (front and back) flame ionization detectors (FID). In addition, four different control experiments were conducted, i.e., a dark experiment with the photocatalysts, a blank reactor with and without irradiation, and finally with exactly the same experimental conditions but using N2 instead of CO2. There was no gas product like CH4 detected for all these control experiments, indicating that the CH4 is produced only from the photoreduction of CO2 over the photocatalysts under visible-light irradiation and not from any other external surrounding factors. An ILT 950 spectrodiometer (International Light Technologies) was used to measure the intensity of the incident light, so as to determine the solar energy conversion efficiency.
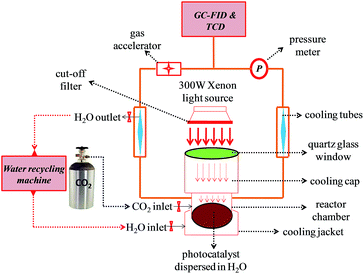 |
| | Fig. 1 Schematic illustration of the experimental setup using a photoreactor connected with a GC for the photoreduction of CO2. | |
Calculations
The XRD data were used to calculate the different crystal parameters, such as crystallite size (D) via the Scherrer formula, lattice constant (a), and cell volume (V) by using eqn (1)–(3),33 where K is the Scherrer constant (0.89),34 λ is the wavelength for the X-ray radiation (0.15418 nm for Cu-Kα), β is the full width at half maxima (FWHM) for the diffraction peak measured at 2θ, and θ is the diffraction angle. Diffuse reflectance spectroscopy was used to determine the band gap energy (Eg, eV) by using the Tauc equation (eqn (4)), where h is Plank's constant, v is the frequency of vibration, α is the absorption coefficient, Eg is the band gap (eV), and K is the proportional constant.| | |
D = Kλ/βcosθ
| (1) |
| | |
1/d2 = (h2 + k2 + l2)/a2
| (2) |
Results and discussion
XRD analysis
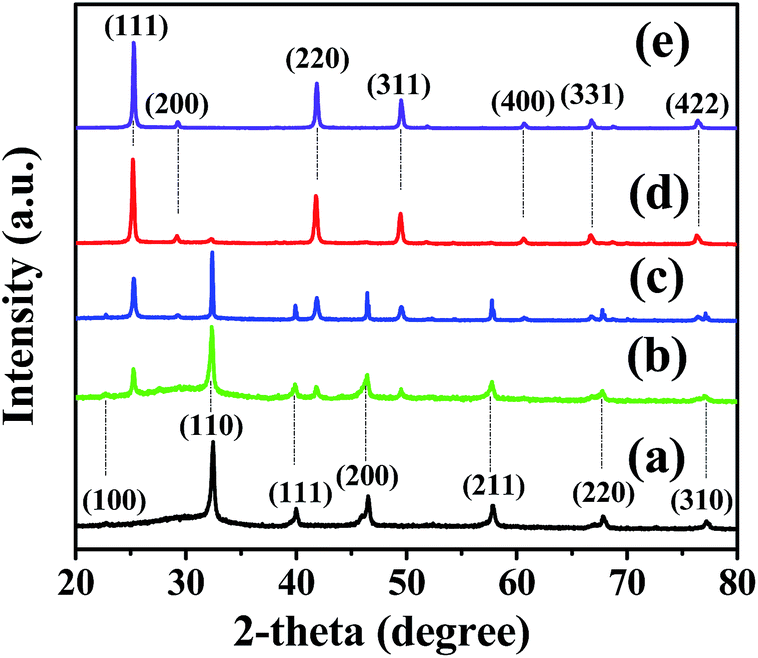
The crystal structure of the synthesized materials was verified by XRD (Fig. 2). In the case of SrTiO3, it was found to be phase pure in accordance with the available diffraction patterns (powder diffraction file (PDF) number 35-0734, a = 3.905 Å), where all the diffraction peaks confirmed the formation of a perovskite-type structure with cubic symmetry. The diffraction patterns for ZnTe, on the other hand, could be indexed for cubic ZnTe, in accordance with the reported data (PDF # 15-0746, a = 6.103 Å). It was evident from the ZnTe diffraction patterns that there were no characteristic peaks for impurities, such as elemental Zn or Te, which confirms the purity of the synthesized sample. The strong and sharp ZnTe peaks also indicate that the photocatalyst is highly crystalline in nature. To obtain a viable catalyst for the photoreduction of CO2 under visible light, the synthesized SrTiO3 and ZnTe were combined together via a modified hydrothermal reaction approach for the synthesis of SrTiO3–ZnTe nanocomposites with different amounts of ZnTe (i.e., 25%, 50%, and 75%). The XRD pattern (Fig. 2) confirms the formation of the SrTiO3–ZnTe nanocomposites, as all the peaks from SrTiO3 and ZnTe are present in the composites. It is noted that the intensity of the (111) diffraction peak corresponding to ZnTe increases with the increase of the amount of ZnTe in the nanocomposites (Fig. 2b–d), leading to a decrease in the intensity of the (110) diffraction peak for SrTiO3.
 |
| | Fig. 2 XRD patterns of (a) SrTiO3, (b–d) SrTiO3–ZnTe nanocomposites with 25%, 50%, and 75% ZnTe, respectively, and (e) ZnTe. | |
The XRD data were also used to calculate the crystallite size (D), lattice constant (a), and cell volume (V) for SrTiO3 and ZnTe, and the values are given in Table 1. All the calculated parameters for the synthesized products were in good agreement with the reported data, as already mentioned above. For ZnTe and SrTiO3, the crystal domain sizes were determined, respectively, to be around 36 nm and 26 nm using the diffraction peak width of (111) and (110) (at half maxima) in terms of the Scherrer equation (eqn (1)).
Table 1 Crystalline parameters derived from the XRD patterns for SrTiO3 and ZnTe
| Sample |
Crystallite size (D) (nm) |
Lattice constant (a) (Å) |
Cell volume (V) (Å3) |
| SrTiO3 |
26 |
3.8987 |
59.299 |
| ZnTe |
36 |
6.0958 |
226.513 |
Morphological and EDX analysis
Morphological analyses for all the synthesized photocatalyst powders using SEM are presented in Fig. 3. It is evident from Fig. 3a that the SrTiO3 particles are uniformly worm-like in shape, with a size distribution in the range of around 20–26 nm, which agrees well with the crystallite sizes obtained from XRD. For bare ZnTe, it can be clearly observed that the particles are spherical in shape, with a uniform size distribution around 30–40 nm (Fig. 3e). In the case of the nanocomposite with 25% ZnTe (Fig. 3b), the spherical ZnTe nanoparticles and worm-like SrTiO3 are well dispersed with each other, thereby, leading to close contact. As the amount of ZnTe was increased to 50% (Fig. 3c), apart from that the majority of the ZnTe nanoparticles are still well dispersed with SrTiO3, some of the small ZnTe nanoparticles start to be decorated on the surface of the large SrTiO3 worm-like structures. Upon further increasing the amount of ZnTe to 75% (Fig. 3d), the majority of the ZnTe nanoparticles appear to agglomerate on the surface.
 |
| | Fig. 3 SEM images of SrTiO3–ZnTe nanocomposites with different amounts of ZnTe: (a) 0% (i.e., SrTiO3), (b) 25%, (c) 50%, (d) 75%, and (e) 100% (i.e., pure ZnTe). | |
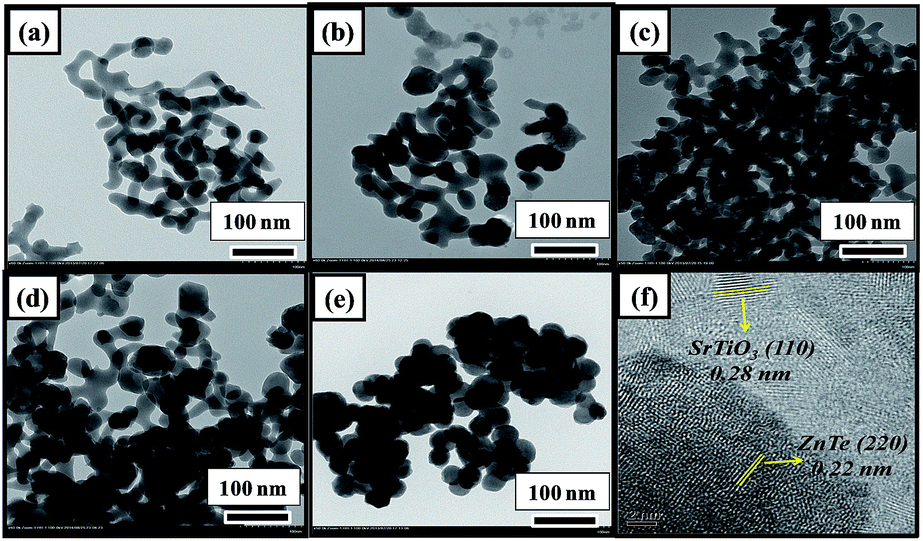
Moreover, the morphology was further analyzed using TEM and the results are shown in Fig. 4. In the high magnification TEM image for bare SrTiO3 (Fig. 4a), it can be seen that the small worm-like nanoparticles combine together to form a large cage-like structure. For the nanocomposite with 25% ZnTe (Fig. 4b), some of the spherical ZnTe particles are diffused into the cavities of the worm-like SrTiO3 to some extent. Upon further increasing the amount of ZnTe to 50% and 75% (Fig. 4c and d), most of the ZnTe appear to be decorated in the form of agglomerated clusters on the surface of the perovskite base material. For bare ZnTe (Fig. 4e), it can also be seen that the particles are spherical in shape, for which the size is in good agreement with the XRD and SEM results. To further probe the microstructure of the nanocomposite and the formation of the interface between the two semiconductors, HRTEM was also carried out (Fig. 4f). The results clearly reveal the formation of a close interface between ZnTe, with exposed (220) crystal plane, and SrTiO3, with exposed (110) crystal plane. The formation of this close interface between the two materials may facilitate the efficient transfer of electrons, thereby, hindering the recombination of the charge carriers.
 |
| | Fig. 4 TEM images of SrTiO3–ZnTe nanocomposites with different amounts of ZnTe: (a) 0%, (b) 25%, (c) 50%, (d) 75%, (e) 100%, and (f) HRTEM image of SrTiO3–ZnTe with 25% ZnTe. | |
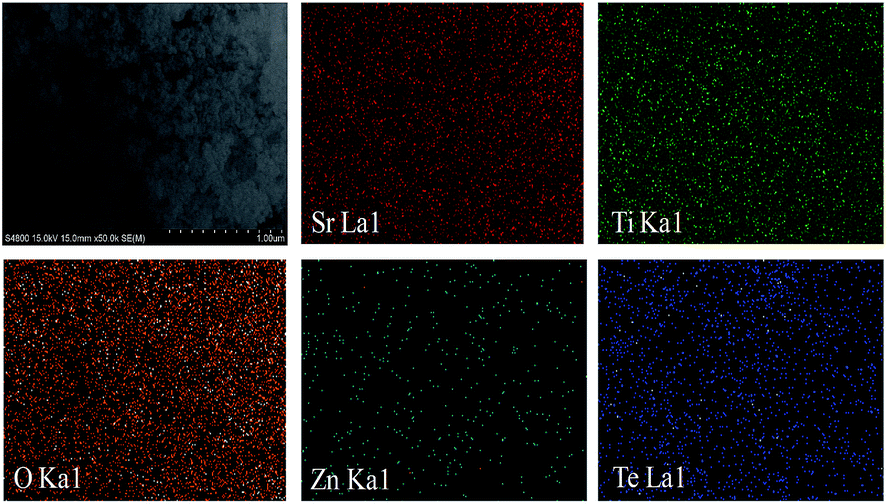
Energy Dispersive X-ray (EDX) elemental mapping also reveals that the SrTiO3–ZnTe nanocomposite with 25% ZnTe was formed (Fig. 5) by SrTiO3 acting as the base material, with Sr, Ti, and O uniformly distributed all over the surface. The micrograph further indicates that the spherical ZnTe nanoparticles were well dispersed with this base perovskite SrTiO3. The elemental maps of Zn and Te also support the claim that some of the ZnTe diffused into the cavities of the worm-like SrTiO3 to some extent. The results of the EDX elemental mapping for the nanocomposites with 50% and 75% ZnTe also agree well with the aforementioned discussions and conclusions (Fig. S1 in the ESI†).
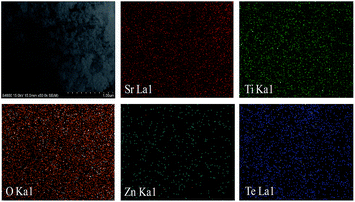 |
| | Fig. 5 EDX mapping for the SrTiO3–ZnTe nanocomposite with 25% ZnTe. | |
EDX spectroscopy was used to determine the composition and stoichiometry for all the elements in the nanocomposite (Fig. S2a†). These results reveal that all the elements in the composite are in agreement with the desired stoichiometric ratios. Moreover, the EDX compositional analyses for bare SrTiO3 and ZnTe were recorded too, and the results are shown in Fig. S2b and c,† which further indicated that all the elements in SrTiO3 (Fig. S2b†) and ZnTe (Fig. S2c†) are in accordance with the stoichiometric ratios. This also confirmed that there were no impurities in the synthesized photocatalysts. In addition, it was noted that the excess of oxygen was observed for both samples containing SrTiO3, which may be due to the adsorbed oxygen on the surface from the environment while preparing the sample for the analysis.
Alignment of band energy levels
The photocatalytic properties of a catalyst are closely related to the alignment of its band energy levels, which we investigated by UV-vis diffuse reflectance spectra and XPS valence band spectra in this work. Fig. 6 shows the UV-vis diffuse reflectance spectra of the as-prepared SrTiO3 and ZnTe. The Kubelka–Munk function was applied to convert the diffuse reflectance measurements into the equivalent absorption coefficients.35 It is evident from Fig. 6 that SrTiO3 exhibits a strong absorption, with an edge in the UV region at around 345 nm; whereas, ZnTe shows an absorption peak at around 555 nm. For both SrTiO3 and ZnTe, the band gap values (Eg) were thus estimated respectively to be 3.51 eV and 2.24 eV using the Tauc plots,36 i.e., the vertical segment of each plot was extra plotted to intersect the hν axis (x-axis) (insets of Fig. 6).
 |
| | Fig. 6 UV-vis diffuse reflectance spectroscopy and Tauc plots for (a) ZnTe, and (b) SrTiO3. | |
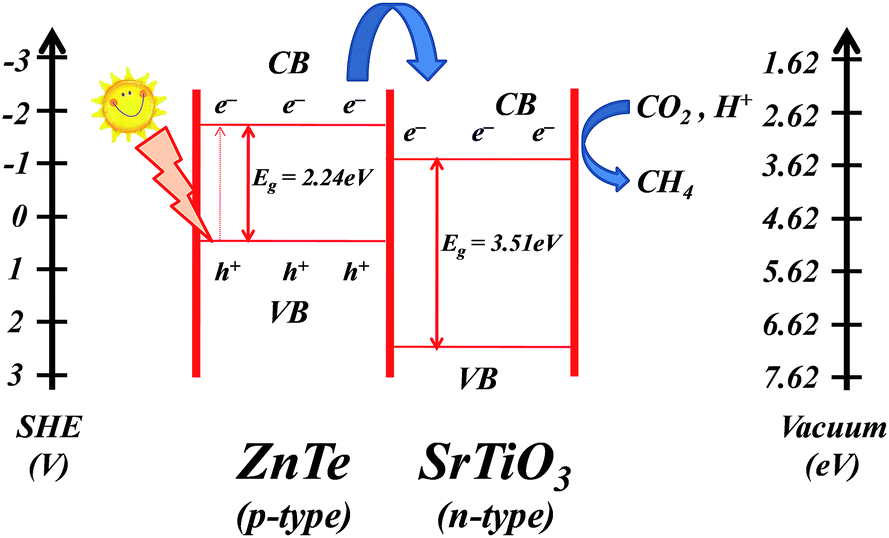
In addition, the valence band maximum of the as-synthesized materials was determined by the XPS valence band spectra (Fig. 7). The work function for the XPS instrument in this study was 4.62 eV. The valence band maximum for ZnTe was calculated to be 0.42 eV (inset of Fig. 7a, 0.44 V against a standard hydrogen electrode (SHE, given as ∼4.60 eV for 0 V)). In the case of SrTiO3, its valence band maximum was around 2.48 eV (inset of Fig. 7b, 2.50 V against SHE). Thus, the alignment of the energy levels is drawn as shown in Fig. 8, according to which the photogenerated electrons can transfer from the conduction band (CB) of ZnTe to the CB of SrTiO3. Accordingly, the recombination of the photogenerated charge carriers can be suppressed greatly, which can be confirmed by the photoluminescence (PL) results.
 |
| | Fig. 7 Valance band edge from XPS Spectra for (a) ZnTe and (b) SrTiO3. | |
 |
| | Fig. 8 Band alignment of the energy levels and proposed scheme for the photoreduction of CO2 with SrTiO3–ZnTe nanocomposite under irradiation of λ ≥ 420 nm. | |
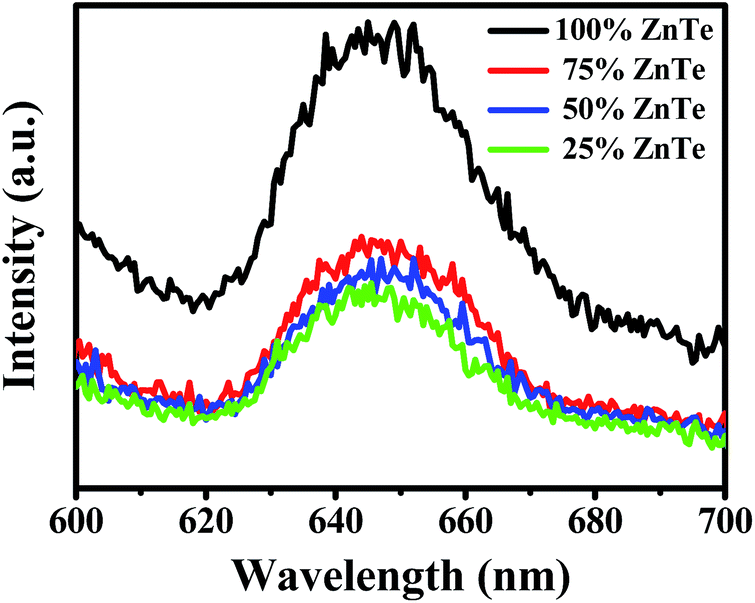
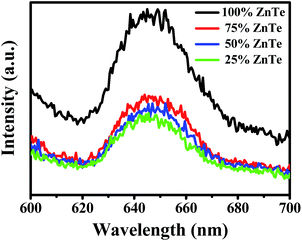
The PL spectra of bare ZnTe and the nanocomposites with different amounts of ZnTe are shown in Fig. 9. The spectra for all the synthesized photocatalysts exhibit a very similar shape to each other, with a broad band of emission signal. It is noted that the PL intensity of the nanocomposites is much weaker than that of ZnTe, due to the suppression of the recombination, the change in which follows in the order of 100% ZnTe > 75% > 50% > 25%. The reason that the nanocomposite with 25% ZnTe shows the lowest PL intensity may be mainly because of the good uniform dispersion of ZnTe in SrTiO3, as indicated by the above SEM/TEM and the mapping results (Fig. 3–5).
 |
| | Fig. 9 Photoluminescence spectra of the as-prepared photocatalysts upon 500 nm excitation. | |
Photoreduction of CO2
Methane (CH4) is the major product in the gas phase for the photoreduction of CO2, for which the production results are shown in Fig. 10. In addition, sometimes trace amounts of H2 can be observed. However, the amount of H2 cannot be determined, as He was used as carrier gas in our system. Upon visible-light illumination (λ ≥ 420 nm), the amount of CH4 produced from the SrTiO3–ZnTe nanocomposites with different amounts of ZnTe i.e., 25%, 50%, 75%, and 100% (bare ZnTe) came out to be 19.03, 14.58, 9.64, and 5.15 μmol g−1 (Fig. 10), respectively. No CH4 was observed from the bare SrTiO3 (0% ZnTe) under light ≥420 nm. Here it is noted that only ZnTe is considered to be a photocatalyst, as SrTiO3 has no response to visible light. By using the amount of fuel energy converted relative to the solar power illuminated on the samples (≥420 nm), the total conversion efficiency after 8 hours was calculated to be 0.36%, 0.28%, 0.18%, and 0.098% for the photocatalysts with different amounts of ZnTe, respectively. Thus, the combination of ZnTe with SrTiO3 can greatly improve the visible-light activity for the photoreduction of CO2. In addition, the stabilities of the photocatalysts have been demonstrated by studying the nanocomposite with 25% ZnTe. A slight decrease in the CH4 yield (<5% for each run) is observed. Thus, the nanocomposite photocatalysts exhibit relatively good stability.
 |
| | Fig. 10 Production of CH4 as a function of time for different photocatalysts upon irradiation of visible-light with λ ≥ 420 nm. | |
The activity and the rate of CH4 production for bare ZnTe were relatively high because it is active under visible-light irradiation, owing to its narrow band gap, as reported earlier; whereas, the efficiency was limited, due to recombination of the photogenerated charge carriers, as already indicated by the PL spectra (Fig. 9). In the case of the SrTiO3–ZnTe nanocomposite with 25% ZnTe, the production rate of CH4 and the conversion efficiency turned out to be the highest (Fig. 10). This may be ascribed mainly to the formation of nanocomposite with the close interface and uniform dispersion between ZnTe and SrTiO3, due to the diffusion of ZnTe spheres into the cavities of the worm-like SrTiO3 materials, as revealed by the above results. This can result in an efficient transfer of the photogenerated charge carriers from the CB of ZnTe to the CB of SrTiO3, which will, thereby, facilitate the electron–hole separation to avoid possible recombination, giving rise to an efficient production of CH4. Generally, this process of charge transfer from the CB of ZnTe to the CB of SrTiO3 is believed to be faster and more efficient than the corresponding electron–hole recombination process, because of the feasible band alignment.37
The mechanism for the photoreduction of CO2 can be elucidated according to Fig. 8. First, the charge carriers (i.e., the electron–hole pairs) were generated by the photoexcitation of the catalyst.38 For efficient electron transfer, the CB of ZnTe (ca. −1.80 V vs. SHE) must be more negative than the CB of SrTiO3 (ca. −1.01 V vs. SHE). The photocatalytic reaction for the reduction of CO2 is initiated by the absorption of visible-light photons with an energy equal or larger than the band gap energy of ZnTe (2.24 eV), resulting in the formation of charge carriers, i.e., photogenerated holes in the valence band of ZnTe semiconductor and electrons in its CB. The photogenerated electrons can then be transferred to the CB of SrTiO3 and can move freely via the conducting network of the SrTiO3, which can act as the electron reservoir. Hence, the charge separation is facilitated and the recombination of these photogenerated charge carriers is eventually hindered, leading to an improved photocatalytic activity of the nanocomposite.
The photogenerated holes in the valence band of ZnTe can adsorb the water molecules to produce hydroxyl radicals (˙OH), which subsequently result in the formation of H+ and O2. The interaction of H+ with the excited electrons gives rise to the formation of ˙H radicals. The photogenerated electrons in the CB of SrTiO3, transferred from the CB of ZnTe, can react with CO2 to trigger the formation of very negative and metastable superoxide radicals (˙CO2−),39,40 which then react with the ˙H radicals to form CO. The CO can be converted into ˙C radicals via a carbide mechanism,41,42 followed by the formation of a series of radicals, which eventually, leads to the production of CH4.42 It is noted that it may also take place via the CO insertion mechanism, which involves the cleavage of the C–O bond of CO after incorporation into the growing hydrocarbon chain, rather than the cleavage of the C–O bond of the CO before the incorporation of a CHx species into the growing hydrocarbon chain.41 Though it is possible to form other products (such as C2H4), CH4 is the major product, possibly because the amount of ˙H is much higher than other radicals.
Conclusions
In summary, ZnTe–SrTiO3 nanocomposite photocatalysts with different amounts of ZnTe were successfully synthesized for the photoreduction of CO2 under visible-light illumination. CH4 was found to be the major product. The nanocomposite photocatalysts exhibit improved efficiency for the production of CH4, due to the efficient transfer and recombination suppression of the photogenerated charge carriers. The results in this work may facilitate further R&D into high-efficiency photocatalysts for the photoreduction of CO2.
Acknowledgements
This work was supported by the Hundred-Talent Program of the Chinese Academy of Sciences.
Notes and references
- R. Lal, Energy Environ. Sci., 2008, 1, 86–100 CAS.
- A. Fujishima and K. Honda, Nature, 1972, 238, 37–38 CrossRef CAS PubMed.
- X. Feng, J. D. Sloppy, T. J. LaTempa, M. Paulose, S. Komarneni, N. Bao and C. A. Grimes, J. Mater. Chem., 2011, 21, 13429–13433 RSC.
- C. C. Lo, C. H. Hung, C. S. Yuan and J. F. Wu, Sol. Energy Mater. Sol. Cells, 2007, 91, 1765–1774 CrossRef CAS.
- K. Teramura, T. Tanaka, H. Ishikawa, Y. Kohno and T. Funabiki, J. Phys. Chem. B, 2004, 108, 346–354 CrossRef CAS.
- K. Teramura, H. Tsuneoka, T. Shishido and T. Tanaka, Chem. Phys. Lett., 2008, 467, 191–194 CrossRef CAS.
- Z. Y. Wang, H. C. Chou, J. C. S. Wu, D. P. Tsai and G. Mul, Appl. Catal., A, 2010, 380, 172–177 CrossRef CAS.
- S. C. Yan, S. X. Ouyang, J. Cao, M. Yang, J. Y. Feng, X. X. Fan, L. J. Wan, Z. S. Li, J. H. Ye, Y. Zhou and Z. G. Zou, Angew. Chem., Int. Ed., 2010, 49, 6400–6404 CrossRef CAS PubMed.
- Y. Zhou, Z. Tian, Z. Zhao, Q. Liu, J. Kou, X. Chen, J. Gao, S. Yan and Z. Zou, ACS Appl. Mater. Interfaces, 2011, 3, 3594–3601 CAS.
- N. Zhang, S. Ouyang, P. Li, Y. Zhang, G. Xi, T. Kako and J. Ye, Chem. Commun., 2011, 47, 2041–2043 RSC.
- T. Inoue, A. Fujishima, S. Konishi and K. Honda, Nature, 1979, 277, 637–638 CrossRef CAS.
- M. Anpo, H. Yamashita, K. Ikeue, Y. Fujii, S. G. Zhang, Y. Ichihashi, D. R. Park, Y. Suzuki, K. Koyano and T. Tatsumi, Catal. Today, 1998, 44, 327–332 CrossRef CAS.
- Y. Li, W. N. Wang, Z. Zhan, M. H. Woo, C. Y. Wu and P. Biswas, Appl. Catal., B, 2010, 100, 386–392 CrossRef CAS.
- W. J. Ong, M. M. Gui, S. P. Chai and A. R. Mohamed, RSC Adv., 2013, 3, 4505–4509 RSC.
- G. C. De, A. M. Roy and S. S. Bhattacharya, Int. J. Hydrogen Energy, 1996, 21, 19–23 CrossRef.
- Y. Yang, Y. Sun and Y. Jiang, Mater. Chem. Phys., 2006, 96, 234–239 CrossRef CAS.
- Y. Qin, G. Wang and Y. Wang, Catal. Commun., 2007, 8, 926–930 CrossRef CAS.
- K. Xie, N. Umezawa, N. Zhang, P. Reunchan, Y. Zhang and J. Ye, Energy Environ. Sci., 2011, 4, 4211–4219 CAS.
- D. Sui, X. Yin, H. Dong, S. Qin, J. Chen and W. Jiang, Catal. Lett., 2012, 142, 1202–1210 CrossRef CAS.
- W. Wei, Y. Dai, M. Guo, L. Yu, H. Jin, S. Han and B. Huang, Phys. Chem. Chem. Phys., 2010, 12, 7612–7619 RSC.
- W. Wei, Y. Dai, H. Jin and B. Huang, J. Phys. D: Appl. Phys., 2009, 42, 055401 CrossRef , (8pp).
- H. Zhang, X. Wu, Y. Wang, X. Chen, Z. Li, T. Yu, J. Ye and Z. Zou, J. Phys. Chem. Solids, 2007, 68, 280–283 CrossRef CAS.
- J. W. Liu, G. Chen, Z. Li and Z. G. Zhang, J. Solid State Chem., 2006, 179, 3704–3708 CrossRef CAS.
- O. Ishitani, C. Inoue, Y. Suzuki and T. Ibusuki, J. Photochem. Photobiol., A, 1993, 72, 269–271 CrossRef CAS.
- O. Ozcan, F. Yukruk, E. U. Akkaya and D. Uner, Top. Catal., 2007, 44, 523–528 CrossRef CAS.
- C. C. Yang, Y. H. Yu, B. v. d. Linden, J. C. S. Wu and G. Mul, J. Am. Chem. Soc., 2010, 132, 8398–8406 CrossRef CAS PubMed.
- J. Schrier, D. O. Demchenko and L. W. Wang, Nano Lett., 2007, 7, 2377–2382 CrossRef CAS PubMed.
- T. Tanaka, K. Saito, Q. Guo and H. Ogawa, Appl. Phys. Express, 2009, 2, 122101 CrossRef.
- Q. Wu, M. Litz and X. C. Zhang, Appl. Phys. Lett., 1996, 68, 2924–2926 CrossRef CAS.
- S. Kaniyankandy, S. Rawalekar, S. Verma and H. N. Ghosh, J. Phys. Chem. C, 2011, 115, 1428–1435 CAS.
- Y. Wang, L. Yang and Y. Wang, Adv. Mater. Res., 2012, 424–425, 949–952 CAS.
- B. B. Wang, M. K. Zhu, H. Wang, G. B. Dong and H. L. Xie, Mater. Sci. Semicond. Process., 2012, 15, 131–135 CrossRef CAS.
- M. N. Ashiq, M. F. Ehsan, M. J. Iqbal and I. H. Gul, J. Alloys Compd., 2011, 509, 5119–5126 CrossRef CAS.
- P. Scherrer, Mathematisch-Physikalische Klasse, 1918, 2, 98–100 Search PubMed.
- W. E. Vargas, J. Opt. A: Pure Appl. Opt., 2002, 4, 452–456 CrossRef.
- M. E. S. Vergara, J. C. A. Huitron, A. R. Gomez and J. N. R. Burstin, Molecules, 2012, 17, 10000–10013 CrossRef PubMed.
- L. Zhang, K. H. Wong, Z. Chen, J. C. Yu, J. Zhao, C. Hu, C.-Y. Chan and P.-K. Wong, Appl. Catal., A, 2009, 363, 221–229 CrossRef CAS.
- I. H. Tseng, W. C. Chang and J. C. S. Wu, Appl. Catal., B, 2002, 37, 37–48 CrossRef CAS.
- X. H. Xia, Z. J. Jia, Y. Yu, Y. Liang, Z. Wang and L. L. Ma, Carbon, 2007, 45, 717–721 CrossRef CAS.
- M. A. Asi, C. He, M. Su, D. Xia, L. Lin, H. Deng, Y. Xiong, R. Qiu and X. Z. Li, Catal. Today, 2011, 175, 256–263 CrossRef.
- R. A. V. Santen, A. J. Markvoort, I. A. W. Filat, M. M. Ghouri and E. J. M. Hensen, Phys. Chem. Chem. Phys., 2013, 15, 17038–17063 RSC.
- M. Tahir and N. S. Amin, Appl. Catal., A, 2013, 467, 483–496 CrossRef CAS.
Footnote |
| † Electronic supplementary information (ESI) available: Energy Dispersive X-ray (EDX) analysis/mapping of as-prepared samples and stability study of photocatalyst. See DOI: 10.1039/c4ra06828a |
|
| This journal is © The Royal Society of Chemistry 2014 |
Click here to see how this site uses Cookies. View our privacy policy here.